Transdermal Patches Market

Transdermal Patches Market by Type (Drug-in-adhesives, Matrix, Reservoir Membrane), Adhesive (Acrylic, Silicone, Hydrogel), Application (Pain, CVS, Hormonal), Distribution Channel (Pharmacy (Retail Online, Hospital)), End User & Region - Global Forecast to 2029

Report Code: MD 8869 Nov, 2023, by marketsandmarkets.com

The global transdermal patches market in terms of revenue was estimated to be worth $6.2 billion in 2023 and is poised to reach $8.0 billion by 2029, growing at a CAGR of 4.5% from 2023 to 2029. The new research study consists of an industry trend analysis of the market. The new research study consists of industry trends, pricing analysis, patent analysis, conference and webinar materials, key stakeholders, and buying behaviour in the market. The global transdermal patches market is expanding due to a number of factors, including the rising prevalence of chronic illnesses, the expanding use of analgesic patches, technological developments in transdermal patches, and the shift from traditional injections to transdermal patches. However, over the anticipated term, a number of problems, such as medication failure, transdermal drug delivery system recalls, and growing healthcare facility costs, will probably limit market growth to some degree.

Attractive Opportunities in the Transdermal Patches Market

Transdermal Patches Market

To know about the assumptions considered for the study, Request for Free Sample Report

Transdermal Patches Market

Transdermal Patches Market Dynamics

Driver: Growing adoption of analgesic patches

The rising use of analgesic patches is indicative of a paradigm shift in pain management techniques, with a focus on non-invasive and focused methods. Analgesic patches have a localized therapeutic effect by delivering a controlled and prolonged release of painkillers through the skin. In addition to improving patient comfort, this technique reduces the possibility of systemic adverse effects from oral painkillers. Analgesic patches are a desirable alternative for those with chronic pain disorders because of their simplicity of administration and prolonged wear period, which both increase patient compliance. Furthermore, the desire for alternate pain management techniques and growing awareness of the opioid epidemic have increased the demand for analgesic patches. Analgesic patch use is increasing as more people realize the advantages of transdermal medication delivery, and these patches are becoming increasingly important in the changing field of pain management.

Restraint: Drug failure and recalls of transdermal drug delivery systems

The complexity and difficulties involved with this novel approach to drug administration are highlighted by the incidence of medication failure and recalls in transdermal drug delivery systems. Transdermal patches provide benefits. However, problems with formulation, adhesive performance, or skin irritation might cause inconsistent drug administration or unfavorable reactions. Problems with the medication itself, the manufacturing process, or the design of the patch can all lead to drug failure, which is the absence of the desired therapeutic effect. Transdermal medication delivery system recalls could happen if there are safety issues, like unanticipated side effects or diminished efficacy. These incidents demonstrate how crucial it is to implement strict quality control procedures during the transdermal patch development and manufacturing process in order to guarantee patient safety and drug efficacy.

Regulatory bodies have a pivotal function in overseeing and addressing these issues, stressing the necessity of constant enhancement in the blueprint and production procedures of transdermal medication delivery systems to reduce the likelihood of medication malfunctions and recalls.

Opportunity: Collaborations between pharmaceutical companies and drug delivery firms

Partnerships between drug delivery companies and pharmaceutical companies in the transdermal patch market have been more common as a result of a common objective to improve patient outcomes and therapeutic effects. Pharmaceutical businesses provide their knowledge of drug pharmacology and their proficiency in drug discovery and formulation. However, medication delivery companies are experts in cutting-edge delivery technologies, such as the creation and production of transdermal patches. These partnerships combine the advantages of both organizations to develop cutting-edge transdermal medication delivery devices. These collaborations frequently lead to the creation of patches with higher levels of adherence, better drug release profiles, and fewer adverse effects. In the end, patients gain from this cooperative approach since it stimulates innovation, expedites the conversion of research into workable solutions, and offers more convenient and efficient transdermal patch options for a variety of therapeutic uses.

Challenge: Technical barriers related to skin irritation and permeability

Technical barriers pertaining to permeability and skin irritation are major obstacles to the development of transdermal patches. The skin, which serves as the main interface for drug absorption, needs to maintain a careful balance between enabling drugs to penetrate it effectively and reducing irritation or negative reactions. It's difficult to get the ideal permeability without sacrificing the integrity of the skin. In order to overcome these obstacles, formulation issues like choosing appropriate permeation enhancers and making sure that the patch is designed correctly are essential. Drug penetration is severely impeded by the skin's natural barrier function, which includes the stratum corneum. To overcome this, creative ways to increase permeability are needed. At the same time, reducing skin irritation necessitates careful patch component selection and patient-specific consideration.

Transdermal Patches Market Ecosystem

Transdermal Patches Market Ecosystem

The multi-layer drug in adhesive patch holds the largest segment in the transdermal patches industry by drug in adhesive segment in the forecast period.

Given its innovative design and exceptional drug delivery capabilities, the multi-layer drug-in-adhesive segment is expected to hold the largest proportion of the transdermal patches market. This section focuses on adding more layers to the adhesive matrix, which increases the transdermal patch's adaptability and provides more precise control over medication release rates. A comprehensive therapeutic approach for complex medical diseases can be provided by tailoring the distinct layers to release different medications or varied dosages simultaneously. This individualized and adaptable drug delivery system meets a range of patient requirements and adds to the supremacy of the market.

Asia Pacific accounted for the largest CAGR of the global transdermal patches industry, by region in the forecast period.

The transdermal patches market in Asia Pacific is expected to grow at the highest CAGR due to a combination of factors that highlight the region's changing healthcare landscape. Transdermal patches are becoming more and more popular due to the rising incidence of chronic illnesses and rising knowledge of non-invasive medication delivery techniques. The huge and aging population in the area is a major factor in the rising cost of healthcare, which in turn is driving up demand for accessible and patient-friendly treatment choices. The transdermal patch market in Asia Pacific is also expected to rise as a result of breakthroughs in pharmaceutical research and development, rising disposable incomes, and improved healthcare infrastructure. The region's growing market share is a result of government programs that support healthcare access and the rising use of cutting-edge medical technologies.

Transdermal Patches Market by Region

To know about the assumptions considered for the study, download the pdf brochure

Key players in the transdermal patches Market are Johnson & Johnson (U.S.), Viatris Inc. (U.S.), Hisamatsu Pharmaceuticals Co. Ltd. (Japan), USB S.A. (Belgium), Boehringer Ingelheim International GmbH (Germany), Endo International plc. (Ireland), Teva Pharmaceutical Industries Ltd. (Israel), Agile Therapeutics (U.S.), Bayer AG (Germany), Nitto Denko Corporation (Japan), Cipla Inc. (India),  Iontopatch (U.S.), Medherant Limited (U.K.), AdhexPharma (France), Evernow (U.S.), Amneal Pharmaceuticals LLC. (U.S.), Hikma Pharmaceuticals PLC (U.K.), Alvogen Group Inc. (U.S.), Sparsha Pharma International Pvt Ltd (India), Luye Pharma Group (China), Novartis AG (Switzerland), AbbVie Inc. (U.S.), LEAD CHEMICAL Co., Ltd. (Japan), Purdue Pharma L.P (U.S.) and Mundipharma International (U.K.).

Scope of the Transdermal Patches Industry

Report Metric

Details

Market Revenue in 2023

$6.2 billion

Projected Revenue by 2029

$8.0 billion

Revenue Rate

Poised to Grow at a CAGR of 4.5%

Market Driver

Growing adoption of analgesic patches

Market Opportunity

Collaborations between pharmaceutical companies and drug delivery firms

The research report categorizes the transdermal patches market to forecast revenue and analyze trends in each of the following submarkets:

By Patch Type

  • Drug-In-Adhesive
  • Matrix Patches
  • Reservoir Membrane Patches
  • Microneedle Patches
  • Iontophoresis Patches
  • Vapour Patches

By Adhesive Type

  • Acrylic Adhesives
  • Silicone Adhesives
  • Hydrogel Adhesives
  • Other Adhesives

By Application

  • Pain Management
  • Smoking Cessation
  • Hormone Replacement Therapy
  • Cardiovascular Disorder
  • Central Nervous System Disorder
  • Others

By Distribution Channel

  • Hospital Pharmacies
  • Retail Pharmacies
  • Online Pharmacies

By End User

  • Homecare Settings
  • Hospitals And Clinics

By Region

  • North America North America
    • US
    • Canada
  • Europe
    • Germany
    • UK
    • France
    • Spain
    • Italy
    • Rest of Europe
  • Asia Pacific
    • China
    • Japan
    • India
    • South Korea
    • Australia
    • Rest of Asia Pacific (RoAPAC)
  • Latin America
    • Brazil
    • Mexico
    • Rest of Latin America (ROLATM)
  • Middle East & Africa

Recent Developments of Transdermal Patches Industry

  • In July 2023, Industria Macchine Automatiche S.P.A. (Italy) acquired Phoenix Italia S.r.l. (Milano). IMA completed the acquisition of 60% of Phoenix Italia S.r.l. and 100% of its subsidiary Phoenix Tech S.r.l., both companies based in Bareggio (Milano), from its sole shareholder Phoenix Group Holding S.r.l.
  • In July 2023, IMA completed the purchase of 70% of Mespic S.r.l. and 100% of its Illinois-based subsidiary, Mespic North America Corporation, from its sole shareholder, Holding FGLG S.r.l..
  • In August 2022, SEA Vision Group and Marchesini Group launched the following solutions: the INTEGRA 720V complete robotized blister line, the BL-A525 CW high-speed labeler, and the complete Track & Trace software solution developed by SEA Vision. This is a solution for primary pack serialization and aggregation, comprising a complete range of technologies to print, inspect, and pack serialized blisters and perform aggregation with cartons, all integrated into a 4.0 environment.
  • In July 2021. Syntegon Technology GmbH (Germany) and Huhtamaki Group (Finland) collaborated. This collaboration led to the paper-based tablet packaging solution for the pharmaceutical and healthcare industries.
  • In March 2021, Syntegon expanded its portfolio for the production of parenteral pharmaceuticals. The company has launched the new SVP Essential, a cost-efficient version of its proven Pharmatec SVP process systems for the production of small-volume liquid pharmaceuticals.

Frequently Asked Questions (FAQ):

To speak to our analyst for a discussion on the above findings, click Speak to Analyst

TABLE OF CONTENTS
 
1 INTRODUCTION (Page No. - 26)
    1.1 STUDY OBJECTIVES 
    1.2 MARKET DEFINITION 
    1.3 MARKET SCOPE 
           1.3.1 INCLUSIONS AND EXCLUSIONS OF STUDY
           1.3.2 MARKETS COVERED
           1.3.3 YEARS CONSIDERED
    1.4 CURRENCY 
          TABLE 1 STANDARD CURRENCY CONVERSION RATES
    1.5 STAKEHOLDERS 
    1.6 RECESSION IMPACT 
 
2 RESEARCH METHODOLOGY (Page No. - 30)
    2.1 RESEARCH DATA 
          FIGURE 1 RESEARCH DESIGN
           2.1.1 SECONDARY DATA
                    2.1.1.1 Key data from secondary sources
           2.1.2 PRIMARY DATA
                    FIGURE 2 PRIMARY SOURCES
                    2.1.2.1 Key data from primary sources
                    2.1.2.2 Key industry insights
                                FIGURE 3 BREAKDOWN OF PRIMARY INTERVIEWS: SUPPLY-SIDE AND DEMAND-SIDE PARTICIPANTS
                                FIGURE 4 BREAKDOWN OF PRIMARY INTERVIEWS (SUPPLY SIDE): BY COMPANY TYPE, DESIGNATION, AND REGION
                                FIGURE 5 BREAKDOWN OF PRIMARY INTERVIEWS (DEMAND SIDE): BY END USER, DESIGNATION, AND REGION
    2.2 MARKET SIZE ESTIMATION 
          FIGURE 6 SUPPLY-SIDE MARKET SIZE ESTIMATION: REVENUE SHARE ANALYSIS
          FIGURE 7 REVENUE SHARE ANALYSIS ILLUSTRATION: JOHNSON & JOHNSON
          FIGURE 8 SUPPLY-SIDE MARKET SIZE ESTIMATION: TRANSDERMAL PATCHES  MARKET (2022)
          FIGURE 9 BOTTOM-UP APPROACH
          FIGURE 10 TOP-DOWN APPROACH
          FIGURE 11 CAGR PROJECTIONS FROM DRIVERS, RESTRAINTS, OPPORTUNITIES, AND CHALLENGES (2023–2029)
          FIGURE 12 CAGR PROJECTIONS: SUPPLY-SIDE ANALYSIS
    2.3 MARKET BREAKDOWN AND DATA TRIANGULATION 
          FIGURE 13 DATA TRIANGULATION METHODOLOGY
    2.4 MARKET SHARE ESTIMATION 
    2.5 ASSUMPTIONS FOR STUDY 
    2.6 RESEARCH LIMITATIONS 
           2.6.1 SCOPE-RELATED LIMITATIONS
           2.6.2 METHODOLOGY-RELATED LIMITATIONS
    2.7 RISK ASSESSMENT 
          TABLE 2 RISK ASSESSMENT: TRANSDERMAL PATCHES MARKET
    2.8 IMPACT OF RECESSION ON TRANSDERMAL PATCHES MARKET 
 
3 EXECUTIVE SUMMARY (Page No. - 46)
    FIGURE 14 TRANSDERMAL PATCHES MARKET, BY PATCH TYPE,  2023 VS. 2029 (USD MILLION)
    FIGURE 15 TRANSDERMAL PATCHES MARKET, BY ADHESIVE TYPE,  2023 VS. 2029 (USD MILLION)
    FIGURE 16 TRANSDERMAL PATCHES MARKET, BY APPLICATION,  2023 VS. 2029 (USD MILLION)
    FIGURE 17 TRANSDERMAL PATCHES MARKET, BY DISTRIBUTION CHANNEL,  2023 VS. 2029 (USD MILLION)
    FIGURE 18 TRANSDERMAL PATCHES MARKET, BY END USER,  2023 VS. 2029 (USD MILLION)
    FIGURE 19 GEOGRAPHICAL SNAPSHOT OF TRANSDERMAL PATCHES MARKET
 
4 PREMIUM INSIGHTS (Page No. - 51)
    4.1 TRANSDERMAL PATCHES MARKET OVERVIEW 
          FIGURE 20 RISING PREVALENCE OF CHRONIC DISEASES TO DRIVE MARKET
    4.2 ASIA PACIFIC: TRANSDERMAL PATCHES MARKET, BY PATCH TYPE AND COUNTRY (2022) 
          FIGURE 21 DRUG-IN-ADHESIVE PATCHES SEGMENT ACCOUNTED FOR LARGEST MARKET SHARE IN 2022
    4.3 TRANSDERMAL PATCHES MARKET: GEOGRAPHIC GROWTH OPPORTUNITIES 
          FIGURE 22 CHINA TO REGISTER HIGHEST GROWTH DURING FORECAST PERIOD
    4.4 TRANSDERMAL PATCHES MARKET, REGIONAL MIX, 2021−2029 
          FIGURE 23 NORTH AMERICA WILL CONTINUE TO DOMINATE TRANSDERMAL PATCHES MARKET DURING FORECAST PERIOD
    4.5 TRANSDERMAL PATCHES MARKET: DEVELOPING VS.  DEVELOPED MARKETS 
          FIGURE 24 DEVELOPING MARKETS TO REGISTER HIGHER GROWTH DURING  FORECAST PERIOD
 
5 MARKET OVERVIEW (Page No. - 55)
    5.1 INTRODUCTION 
    5.2 MARKET DYNAMICS 
          FIGURE 25 TRANSDERMAL PATCHES MARKET: DRIVERS, RESTRAINTS, OPPORTUNITIES, AND CHALLENGES
           5.2.1 DRIVERS
                    5.2.1.1 Increasing prevalence of chronic diseases
                    5.2.1.2 Growing adoption of analgesic patches
                    5.2.1.3 Technological advancements in transdermal patches
                    5.2.1.4 Switching from conventional needle injections to transdermal patches
           5.2.2 RESTRAINTS
                    5.2.2.1 High procedural cost of transdermal surgeries and associated products
                    5.2.2.2 Drug failure and recalls of transdermal drug delivery systems
                    5.2.2.3 Rising cost of healthcare facilities
           5.2.3 OPPORTUNITIES
                    5.2.3.1 Collaborations between pharmaceutical companies and drug delivery firms
                    5.2.3.2 Self-administration and home care drug delivery systems
           5.2.4 CHALLENGES
                    5.2.4.1 Technical barriers related to skin irritation and permeability
                    5.2.4.2 Lack of skilled professionals
    5.3 TECHNOLOGY ANALYSIS 
    5.4 INDUSTRY TRENDS 
           5.4.1 ADVANCEMENTS IN TRANSDERMAL DRUG DELIVERY SYSTEMS
    5.5 VALUE CHAIN ANALYSIS 
          FIGURE 26 TRANSDERMAL PATCHES MARKET: VALUE CHAIN ANALYSIS
    5.6 SUPPLY CHAIN ANALYSIS 
          FIGURE 27 TRANSDERMAL PATCHES MARKET: SUPPLY CHAIN ANALYSIS
    5.7 TRADE ANALYSIS 
           5.7.1 TRADE ANALYSIS FOR TRANSDERMAL PATCHES
                    TABLE3 IMPORT AND EXPORT DATA FOR TRANSDERMAL PATCHES, BY COUNTRY, 2022
    5.8 PORTER’S FIVE FORCES ANALYSIS 
          TABLE 4 TRANSDERMAL PATCHES MARKET: PORTER’S FIVE FORCES ANALYSIS
           5.8.1 THREAT OF NEW ENTRANTS
           5.8.2 THREAT OF SUBSTITUTES
           5.8.3 BARGAINING POWER OF BUYERS
           5.8.4 BARGAINING POWER OF SUPPLIERS
           5.8.5 INTENSITY OF COMPETITIVE RIVALRY
    5.9 TARIFF AND REGULATORY LANDSCAPE 
           5.9.1 REGULATORY ANALYSIS
                    5.9.1.1 North America
                               5.9.1.1.1 US
                               5.9.1.1.2 Canada
                    5.9.1.2 Europe
                    5.9.1.3 Asia Pacific
                               5.9.1.3.1 China
                               5.9.1.3.2 Japan
                               5.9.1.3.3 India
                    5.9.1.4 Latin America
                               5.9.1.4.1 Brazil
                               5.9.1.4.2 Mexico
                    5.9.1.5 Middle East
                    5.9.1.6 Africa
           5.9.2 REGULATORY BODIES, GOVERNMENT AGENCIES, AND OTHER ORGANIZATIONS
                    TABLE5 NORTH AMERICA: REGULATORY BODIES, GOVERNMENT AGENCIES, AND  OTHER ORGANIZATIONS
                    TABLE6 EUROPE: REGULATORY BODIES, GOVERNMENT AGENCIES, AND OTHER ORGANIZATIONS
                    TABLE7 ASIA PACIFIC: REGULATORY BODIES, GOVERNMENT AGENCIES, AND OTHER ORGANIZATIONS
                    TABLE8 LATIN AMERICA: REGULATORY BODIES, GOVERNMENT AGENCIES, AND  OTHER ORGANIZATIONS
                    TABLE9 REST OF THE WORLD: REGULATORY BODIES, GOVERNMENT AGENCIES, AND  OTHER ORGANIZATIONS
    5.10 PATENT ANALYSIS 
           5.10.1 PATENT PUBLICATION TRENDS FOR TRANSDERMAL PATCHES
                     FIGURE 28 PATENT PUBLICATION TRENDS (JANUARY 2015–DECEMBER 2022)
           5.10.2 JURISDICTION ANALYSIS: TOP APPLICANTS FOR PATENTS IN TRANSDERMAL PATCHES MARKET
                     FIGURE 29 TOP APPLICANTS & OWNERS (COMPANIES/INSTITUTES) FOR TRANSDERMAL PATCH PATENTS (JANUARY 2015–DECEMBER 2022)
                     FIGURE 30 TOP APPLICANT COUNTRIES/REGIONS FOR TRANSDERMAL PATCHES (JANUARY 2015–APRIL 2022)
    5.11 PRICING ANALYSIS 
           TABLE 10 AVERAGE SELLING PRICE TRENDS OF KEY PLAYERS, BY APPLICATION
           TABLE 11 REGIONAL PRICING ANALYSIS OF TRANSDERMAL PATCHES, 2023 (USD)
    5.12 KEY CONFERENCES & EVENTS IN 2023–2024 
           TABLE 12 TRANSDERMAL PATCHES MARKET: DETAILED LIST OF CONFERENCES & EVENTS
    5.13 KEY STAKEHOLDERS & BUYING CRITERIA 
           5.13.1 KEY STAKEHOLDERS IN BUYING PROCESS
                     FIGURE 31 INFLUENCE OF STAKEHOLDERS ON BUYING PROCESS OF TRANSDERMAL PATCHES
                     TABLE 13 INFLUENCE OF STAKEHOLDERS ON BUYING PROCESS OF TRANSDERMAL PATCHES
           5.13.2 BUYING CRITERIA
                     FIGURE 32 KEY BUYING CRITERIA FOR TRANSDERMAL PATCHES
                     TABLE 14 KEY BUYING CRITERIA FOR TRANSDERMAL PATCHES
    5.14 ECOSYSTEM/MARKET MAP 
           FIGURE 33 TRANSDERMAL PATCHES MARKET: ECOSYSTEM/MARKET MAP
    5.15 ADJACENT MARKET ANALYSIS 
           FIGURE 34 TRANSDERMAL PATCHES MARKET: ADJACENT MARKETS
    5.16 TRENDS/DISRUPTIONS IMPACTING CUSTOMER’S BUSINESS 
           FIGURE 35 TRENDS/DISRUPTIONS IMPACTING CUSTOMER’S BUSINESS
    5.17 UNMET NEEDS 
 
6 TRANSDERMAL PATCHES MARKET, BY PATCH TYPE (Page No. - 79)
    6.1 INTRODUCTION 
          TABLE15 TRANSDERMAL PATCHES MARKET, BY PATCH TYPE, 2021–2029 (USD MILLION)
    6.2 DRUG-IN-ADHESIVE PATCHES 
          TABLE16 DRUG-IN-ADHESIVE TRANSDERMAL PATCHES MARKET, BY TYPE,  2021–2029 (USD MILLION)
          TABLE17 DRUG-IN-ADHESIVE TRANSDERMAL PATCHES MARKET, BY COUNTRY,  2021–2029 (USD MILLION)
           6.2.1 SINGLE-LAYER DRUG-IN-ADHESIVE PATCHES
                    6.2.1.1 Used to deliver wide range of medications
                                TABLE 18 SINGLE-LAYER DRUG-IN-ADHESIVE TRANSDERMAL PATCHES MARKET, BY COUNTRY, 2021–2029 (USD MILLION)
           6.2.2 MULTI-LAYER DRUG-IN-ADHESIVE PATCHES
                    6.2.2.1 Enhanced drug release and reduced side effects to drive adoption
                                TABLE 19 MULTI-LAYER DRUG-IN-ADHESIVE TRANSDERMAL PATCHES MARKET, BY COUNTRY, 2021–2029 (USD MILLION)
    6.3 MATRIX PATCHES 
           6.3.1 TECHNOLOGICAL ADVANCEMENTS IN NEW MATRIX MATERIALS TO SUPPORT MARKET GROWTH
                    TABLE20 MATRIX TRANSDERMAL PATCHES MARKET, BY COUNTRY, 2021–2029 (USD MILLION)
    6.4 RESERVOIR MEMBRANE PATCHES 
           6.4.1 OFFER GREAT CONTROL OVER DRUG DELIVERY RATES
                    TABLE21 RESERVOIR MEMBRANE TRANSDERMAL PATCHES MARKET, BY COUNTRY,  2021–2029 (USD MILLION)
    6.5 MICRONEEDLE PATCHES 
           6.5.1 ABILITY TO DELIVER ACTIVE PHARMACEUTICAL INGREDIENTS TO BOOST ADOPTION
                    TABLE22 MICRONEEDLE TRANSDERMAL PATCHES MARKET, BY COUNTRY,  2021–2029 (USD MILLION)
    6.6 IONTOPHORESIS PATCHES 
           6.6.1 USED TO DELIVER MEDICINES WITH LOW MOLECULAR WEIGHT
                    TABLE23 IONTOPHORESIS TRANSDERMAL PATCHES MARKET, BY COUNTRY,  2021–2029 (USD MILLION)
    6.7 VAPOR PATCHES 
           6.7.1 RELEASE ESSENTIAL OILS FOR UP TO 6 HOURS
                    TABLE24 VAPOR TRANSDERMAL PATCHES MARKET, BY COUNTRY, 2021–2029 (USD MILLION)
 
7 TRANSDERMAL PATCHES MARKET, BY ADHESIVE TYPE (Page No. - 90)
    7.1 INTRODUCTION 
          TABLE 25 TRANSDERMAL PATCHES MARKET, BY ADHESIVE TYPE, 2021–2029 (USD MILLION)
    7.2 ACRYLIC ADHESIVES 
           7.2.1 HIGH DURABILITY TO BOOST DEMAND
                    TABLE26 TRANSDERMAL PATCHES MARKET FOR ACRYLIC ADHESIVES, BY COUNTRY,  2021–2029 (USD MILLION)
    7.3 SILICONE ADHESIVES 
           7.3.1 LOW PEEL ADHESION PROPERTY MAKES IT IDEAL FOR MEDICAL APPLICATIONS
                    TABLE27 TRANSDERMAL PATCHES MARKET FOR SILICONE ADHESIVES, BY COUNTRY,  2021–2029 (USD MILLION)
    7.4 HYDROGEL ADHESIVES 
           7.4.1 INCREASING DEMAND FOR TRANSDERMAL DRUG DELIVERY SYSTEMS TO DRIVE MARKET
                    TABLE28 TRANSDERMAL PATCHES MARKET FOR HYDROGEL ADHESIVES, BY COUNTRY,  2021–2029 (USD MILLION)
    7.5 OTHER ADHESIVES 
          TABLE29 TRANSDERMAL PATCHES MARKET FOR OTHER ADHESIVES, BY COUNTRY,  2021–2029 (USD MILLION)
 
8 TRANSDERMAL PATCHES MARKET, BY APPLICATION (Page No. - 96)
    8.1 INTRODUCTION 
          TABLE30 TRANSDERMAL PATCHES MARKET, BY APPLICATION, 2021–2029 (USD MILLION)
    8.2 PAIN MANAGEMENT 
           8.2.1 HIGH BURDEN OF CHRONIC PAIN WORLDWIDE TO DRIVE MARKET
                    TABLE31 TRANSDERMAL PATCHES AVAILABLE FOR PAIN MANAGEMENT
                    TABLE32 TRANSDERMAL PATCHES MARKET FOR PAIN MANAGEMENT, BY COUNTRY,  2021–2029 (USD MILLION)
    8.3 SMOKING CESSATION 
           8.3.1 CONTROLLED DRUG DELIVERY AND REDUCED SIDE EFFECTS TO SUPPORT MARKET GROWTH
                    TABLE33 TRANSDERMAL PATCHES AVAILABLE FOR SMOKING CESSATION
                    TABLE34 TRANSDERMAL PATCHES MARKET FOR SMOKING CESSATION, BY COUNTRY,  2021–2029 (USD MILLION)
    8.4 HORMONE REPLACEMENT THERAPY 
          TABLE35 TRANSDERMAL PATCHES MARKET FOR HORMONE REPLACEMENT THERAPY, BY TYPE, 2021–2029 (USD MILLION)
          TABLE36 TRANSDERMAL PATCHES MARKET FOR HORMONE REPLACEMENT THERAPY,  BY COUNTRY, 2021–2029 (USD MILLION)
           8.4.1 TRANSDERMAL TESTOSTERONE THERAPY
                    8.4.1.1 Increased bone density, better muscle development, and reduced risk factors to support market growth
                                TABLE 37 TRANSDERMAL PATCHES AVAILABLE FOR TRANSDERMAL TESTOSTERONE THERAPY
                                TABLE 38 TRANSDERMAL PATCHES MARKET FOR TRANSDERMAL TESTOSTERONE THERAPY,  BY COUNTRY, 2021–2029 (USD MILLION)
           8.4.2 TRANSDERMAL ESTROGEN THERAPY
                    8.4.2.1 Growing use of transdermal contraceptive patches to drive market
                                TABLE 39 TRANSDERMAL PATCHES AVAILABLE FOR TRANSDERMAL ESTROGEN THERAPY
                                TABLE 40 TRANSDERMAL PATCHES MARKET FOR TRANSDERMAL ESTROGEN THERAPY,  BY COUNTRY, 2021–2029 (USD MILLION)
    8.5 CENTRAL NERVOUS SYSTEM DISORDERS 
           8.5.1 EASE OF USE, SIMPLE TREATMENT REGIMEN, AND CONTINUOUS DELIVERY OF DRUGS TO DRIVE ADOPTION
                    TABLE 41 TRANSDERMAL PATCHES AVAILABLE FOR CENTRAL NERVOUS SYSTEM DISORDERS
                    TABLE 42 TRANSDERMAL PATCHES MARKET FOR CENTRAL NERVOUS SYSTEM DISORDERS,  BY COUNTRY, 2021–2029 (USD MILLION)
    8.6 CARDIOVASCULAR DISEASES 
           8.6.1 AVAILABILITY OF ALTERNATIVE AND ADVANCED DRUG DELIVERY OPTIONS TO LIMIT MARKET GROWTH
                    TABLE 43 TRANSDERMAL PATCHES AVAILABLE FOR CARDIOVASCULAR DISEASES
                    TABLE 44 TRANSDERMAL PATCHES MARKET FOR CARDIOVASCULAR DISEASES, BY COUNTRY, 2021–2029 (USD MILLION)
    8.7 OTHER APPLICATIONS 
          TABLE 45 TRANSDERMAL PATCHES AVAILABLE FOR OTHER APPLICATIONS
          TABLE 46 TRANSDERMAL PATCHES MARKET FOR OTHER APPLICATIONS, BY COUNTRY,  2021–2029 (USD MILLION)
 
9 TRANSDERMAL PATCHES MARKET, BY DISTRIBUTION CHANNEL (Page No. - 109)
    9.1 INTRODUCTION 
          TABLE 47 TRANSDERMAL PATCHES MARKET, BY DISTRIBUTION CHANNEL,  2021–2029 (USD MILLION)
    9.2 HOSPITAL PHARMACIES 
           9.2.1 LARGEST DISTRIBUTION CHANNEL FOR TRANSDERMAL PATCHES
                    TABLE 48 TRANSDERMAL PATCHES MARKET FOR HOSPITAL PHARMACIES, BY COUNTRY,  2021–2029 (USD MILLION)
    9.3 RETAIL PHARMACIES 
           9.3.1 IMPROVING HEALTHCARE INFRASTRUCTURE TO DRIVE MARKET
                    TABLE 49 TRANSDERMAL PATCHES MARKET FOR RETAIL PHARMACIES, BY COUNTRY,  2021–2029 (USD MILLION)
    9.4 ONLINE PHARMACIES 
           9.4.1 FASTEST-GROWING SEGMENT DUE TO EASY ACCESSIBILITY TO MEDICATIONS
                    TABLE 50 TRANSDERMAL PATCHES MARKET FOR ONLINE PHARMACIES, BY COUNTRY,  2021–2029 (USD MILLION)
 
10 TRANSDERMAL PATCHES MARKET, BY END USER (Page No. - 114)
     10.1 INTRODUCTION 
             TABLE 51 TRANSDERMAL PATCHES MARKET, BY END USER, 2021–2029 (USD MILLION)
     10.2 HOME CARE SETTINGS 
             10.2.1 RAPID GROWTH IN GERIATRIC POPULATION TO SUPPORT  MARKET GROWTH
                        TABLE 52 TRANSDERMAL PATCHES MARKET FOR HOME CARE SETTINGS, BY COUNTRY,  2021–2029 (USD MILLION)
     10.3 HOSPITALS & CLINICS 
             10.3.1 INCREASING PREVALENCE OF CHRONIC DISEASES TO DRIVE MARKET
                        TABLE 53 TRANSDERMAL PATCHES MARKET FOR HOSPITALS & CLINICS, BY COUNTRY,  2021–2029 (USD MILLION)
 
11 TRANSDERMAL PATCHES MARKET, BY REGION (Page No. - 119)
     11.1 INTRODUCTION 
             TABLE 54 TRANSDERMAL PATCHES MARKET, BY REGION, 2021–2029 (USD MILLION)
     11.2 NORTH AMERICA 
             11.2.1 IMPACT OF RECESSION ON NORTH AMERICAN TRANSDERMAL PATCHES MARKET
                        FIGURE 36 NORTH AMERICA: TRANSDERMAL PATCHES MARKET SNAPSHOT
                        TABLE 55 NORTH AMERICA: TRANSDERMAL PATCHES MARKET, BY COUNTRY,  2021–2029 (USD MILLION)
                        TABLE 56 NORTH AMERICA: TRANSDERMAL PATCHES MARKET, BY PATCH TYPE,  2021–2029 (USD MILLION)
                        TABLE 57 NORTH AMERICA: DRUG-IN-ADHESIVE TRANSDERMAL PATCHES MARKET, BY TYPE, 2021–2029 (USD MILLION)
                        TABLE 58 NORTH AMERICA: TRANSDERMAL PATCHES MARKET, BY ADHESIVE TYPE,  2021–2029 (USD MILLION)
                        TABLE 59 NORTH AMERICA: TRANSDERMAL PATCHES MARKET, BY APPLICATION,  2021–2029 (USD MILLION)
                        TABLE 60 NORTH AMERICA: TRANSDERMAL PATCHES MARKET FOR HORMONE REPLACEMENT THERAPY, BY TYPE, 2021–2029 (USD MILLION)
                        TABLE 61 NORTH AMERICA: TRANSDERMAL PATCHES MARKET, BY DISTRIBUTION CHANNEL,  2021–2029 (USD MILLION)
                        TABLE 62 NORTH AMERICA: TRANSDERMAL PATCHES MARKET, BY END USER,  2021–2029 (USD MILLION)
             11.2.2 US
                        11.2.2.1 Largest market for transdermal patches
                                      TABLE 63 US: MACROECONOMIC INDICATORS
                                      TABLE 64 US: TRANSDERMAL PATCHES MARKET, BY PATCH TYPE, 2021–2029 (USD MILLION)
                                      TABLE 65 US: DRUG-IN-ADHESIVE TRANSDERMAL PATCHES MARKET, BY TYPE,  2021–2029 (USD MILLION)
                                      TABLE 66 US: TRANSDERMAL PATCHES MARKET, BY ADHESIVE TYPE, 2021–2029 (USD MILLION)
                                      TABLE 67 US: TRANSDERMAL PATCHES MARKET, BY APPLICATION, 2021–2029 (USD MILLION)
                                      TABLE 68 US: TRANSDERMAL PATCHES MARKET FOR HORMONE REPLACEMENT THERAPY, BY TYPE, 2021–2029 (USD MILLION)
                                      TABLE 69 US: TRANSDERMAL PATCHES MARKET, BY DISTRIBUTION CHANNEL,  2021–2029 (USD MILLION)
                                      TABLE 70 US: TRANSDERMAL PATCHES MARKET, BY END USER, 2021–2029 (USD MILLION)
             11.2.3 CANADA
                        11.2.3.1 Rising funding for transdermal drug delivery research to drive market
                                      TABLE 71 CANADA: MACROECONOMIC INDICATORS
                                      TABLE 72 CANADA: TRANSDERMAL PATCHES MARKET, BY PATCH TYPE, 2021–2029 (USD MILLION)
                                      TABLE 73 CANADA: DRUG-IN-ADHESIVE TRANSDERMAL PATCHES MARKET, BY TYPE,  2021–2029 (USD MILLION)
                                      TABLE 74 CANADA: TRANSDERMAL PATCHES MARKET, BY ADHESIVE TYPE,  2021–2029 (USD MILLION)
                                      TABLE 75 CANADA: TRANSDERMAL PATCHES MARKET, BY APPLICATION,  2021–2029 (USD MILLION)
                                      TABLE 76 CANADA: TRANSDERMAL PATCHES MARKET FOR HORMONE REPLACEMENT THERAPY,  BY TYPE, 2021–2029 (USD MILLION)
                                      TABLE 77 CANADA: TRANSDERMAL PATCHES MARKET, BY DISTRIBUTION CHANNEL,  2021–2029 (USD MILLION)
                                      TABLE 78 CANADA: TRANSDERMAL PATCHES MARKET, BY END USER, 2021–2029 (USD MILLION)
     11.3 EUROPE 
             11.3.1 IMPACT OF RECESSION ON EUROPEAN TRANSDERMAL  PATCHES MARKET
                        TABLE 79 EUROPE: TRANSDERMAL PATCHES MARKET, BY COUNTRY, 2021–2029 (USD MILLION)
                        TABLE 80 EUROPE: TRANSDERMAL PATCHES MARKET, BY PATCH TYPE, 2021–2029 (USD MILLION)
                        TABLE 81 EUROPE: DRUG-IN-ADHESIVE TRANSDERMAL PATCHES MARKET, BY TYPE,  2021–2029 (USD MILLION)
                        TABLE 82 EUROPE: TRANSDERMAL PATCHES MARKET, BY ADHESIVE TYPE,  2021–2029 (USD MILLION)
                        TABLE 83 EUROPE: TRANSDERMAL PATCHES MARKET, BY APPLICATION,  2021–2029 (USD MILLION)
                        TABLE 84 EUROPE: TRANSDERMAL PATCHES MARKET FOR HORMONE REPLACEMENT THERAPY,  BY TYPE, 2021–2029 (USD MILLION)
                        TABLE 85 EUROPE: TRANSDERMAL PATCHES MARKET, BY DISTRIBUTION CHANNEL,  2021–2029 (USD MILLION)
                        TABLE 86 EUROPE: TRANSDERMAL PATCHES MARKET, BY END USER, 2021–2029 (USD MILLION)
             11.3.2 GERMANY
                        11.3.2.1 Favorable government policies to aid market growth
                                      TABLE 87 GERMANY: MACROECONOMIC INDICATORS
                                      TABLE 88 GERMANY: TRANSDERMAL PATCHES MARKET, BY PATCH TYPE,  2021–2029 (USD MILLION)
                                      TABLE 89 GERMANY: DRUG-IN-ADHESIVE TRANSDERMAL PATCHES MARKET, BY TYPE,  2021–2029 (USD MILLION)
                                      TABLE 90 GERMANY: TRANSDERMAL PATCHES MARKET, BY ADHESIVE TYPE,  2021–2029 (USD MILLION)
                                      TABLE 91 GERMANY: TRANSDERMAL PATCHES MARKET, BY APPLICATION,  2021–2029 (USD MILLION)
                                      TABLE 92 GERMANY: TRANSDERMAL PATCHES MARKET FOR HORMONE REPLACEMENT THERAPY, BY TYPE, 2021–2029 (USD MILLION)
                                      TABLE 93 GERMANY: TRANSDERMAL PATCHES MARKET, BY DISTRIBUTION CHANNEL,  2021–2029 (USD MILLION)
                                      TABLE 94 GERMANY: TRANSDERMAL PATCHES MARKET, BY END USER, 2021–2029 (USD MILLION)
             11.3.3 UK
                        11.3.3.1 Increasing funding for R&D of innovative transdermal technologies to drive market
                                      TABLE 95 UK: MACROECONOMIC INDICATORS
                                      TABLE 96 UK: TRANSDERMAL PATCHES MARKET, BY PATCH TYPE, 2021–2029 (USD MILLION)
                                      TABLE 97 UK: DRUG-IN-ADHESIVE TRANSDERMAL PATCHES MARKET, BY TYPE,  2021–2029 (USD MILLION)
                                      TABLE 98 UK: TRANSDERMAL PATCHES MARKET, BY ADHESIVE TYPE, 2021–2029 (USD MILLION)
                                      TABLE 99 UK: TRANSDERMAL PATCHES MARKET, BY APPLICATION, 2021–2029 (USD MILLION)
                                      TABLE 100 UK: TRANSDERMAL PATCHES MARKET FOR HORMONE REPLACEMENT THERAPY, BY TYPE, 2021–2029 (USD MILLION)
                                      TABLE 101 UK: TRANSDERMAL PATCHES MARKET, BY DISTRIBUTION CHANNEL,  2021–2029 (USD MILLION)
                                      TABLE 102 UK: TRANSDERMAL PATCHES MARKET, BY END USER, 2021–2029 (USD MILLION)
             11.3.4 FRANCE
                        11.3.4.1 Development of transdermal drug delivery systems by local players to support market growth
                                      TABLE 103 FRANCE: MACROECONOMIC INDICATORS
                                      TABLE 104 FRANCE: TRANSDERMAL PATCHES MARKET, BY PATCH TYPE, 2021–2029 (USD MILLION)
                                      TABLE 105 FRANCE: DRUG-IN-ADHESIVE TRANSDERMAL PATCHES MARKET, BY TYPE,  2021–2029 (USD MILLION)
                                      TABLE 106 FRANCE: TRANSDERMAL PATCHES MARKET, BY ADHESIVE TYPE,  2021–2029 (USD MILLION)
                                      TABLE 107 FRANCE: TRANSDERMAL PATCHES MARKET, BY APPLICATION,  2021–2029 (USD MILLION)
                                      TABLE 108 FRANCE: TRANSDERMAL PATCHES MARKET FOR HORMONE REPLACEMENT THERAPY,  BY TYPE, 2021–2029 (USD MILLION)
                                      TABLE 109 FRANCE: TRANSDERMAL PATCHES MARKET, BY DISTRIBUTION CHANNEL,  2021–2029 (USD MILLION)
                                      TABLE 110 FRANCE: TRANSDERMAL PATCHES MARKET, BY END USER, 2021–2029 (USD MILLION)
             11.3.5 ITALY
                        11.3.5.1 High burden of lung cancer to propel market
                                      TABLE 111 ITALY: MACROECONOMIC INDICATORS
                                      TABLE 112 ITALY: TRANSDERMAL PATCHES MARKET, BY PATCH TYPE, 2021–2029 (USD MILLION)
                                      TABLE 113 ITALY: DRUG-IN-ADHESIVE TRANSDERMAL PATCHES MARKET, BY TYPE,  2021–2029 (USD MILLION)
                                      TABLE 114 ITALY: TRANSDERMAL PATCHES MARKET, BY ADHESIVE TYPE, 2021–2029 (USD MILLION)
                                      TABLE 115 ITALY: TRANSDERMAL PATCHES MARKET, BY APPLICATION, 2021–2029 (USD MILLION)
                                      TABLE 116 ITALY: TRANSDERMAL PATCHES MARKET FOR HORMONE REPLACEMENT THERAPY,  BY TYPE, 2021–2029 (USD MILLION)
                                      TABLE 117 ITALY: TRANSDERMAL PATCHES MARKET, BY DISTRIBUTION CHANNEL,  2021–2029 (USD MILLION)
                                      TABLE 118 ITALY: TRANSDERMAL PATCHES MARKET, BY END USER, 2021–2029 (USD MILLION)
             11.3.6 SPAIN
                        11.3.6.1 Growing demand for self-care and personalized medicine  to drive market
                                      TABLE 119 SPAIN: MACROECONOMIC INDICATORS
                                      TABLE 120 SPAIN: TRANSDERMAL PATCHES MARKET, BY PATCH TYPE, 2021–2029 (USD MILLION)
                                      TABLE 121 SPAIN: DRUG-IN-ADHESIVE TRANSDERMAL PATCHES MARKET, BY TYPE,  2021–2029 (USD MILLION)
                                      TABLE 122 SPAIN: TRANSDERMAL PATCHES MARKET, BY ADHESIVE TYPE,  2021–2029 (USD MILLION)
                                      TABLE 123 SPAIN: TRANSDERMAL PATCHES MARKET, BY APPLICATION, 2021–2029 (USD MILLION)
                                      TABLE 124 SPAIN: TRANSDERMAL PATCHES MARKET FOR HORMONE REPLACEMENT THERAPY,  BY TYPE, 2021–2029 (USD MILLION)
                                      TABLE 125 SPAIN: TRANSDERMAL PATCHES MARKET, BY DISTRIBUTION CHANNEL,  2021–2029 (USD MILLION)
                                      TABLE 126 SPAIN: TRANSDERMAL PATCHES MARKET, BY END USER, 2021–2029 (USD MILLION)
             11.3.7 REST OF EUROPE
                        TABLE 127 REST OF EUROPE: TRANSDERMAL PATCHES MARKET, BY PATCH TYPE,  2021–2029 (USD MILLION)
                        TABLE 128 REST OF EUROPE: DRUG-IN-ADHESIVE TRANSDERMAL PATCHES MARKET, BY TYPE, 2021–2029 (USD MILLION)
                        TABLE 129 REST OF EUROPE: TRANSDERMAL PATCHES MARKET, BY ADHESIVE TYPE,  2021–2029 (USD MILLION)
                        TABLE 130 REST OF EUROPE: TRANSDERMAL PATCHES MARKET, BY APPLICATION,  2021–2029 (USD MILLION)
                        TABLE 131 REST OF EUROPE: TRANSDERMAL PATCHES MARKET FOR HORMONE REPLACEMENT THERAPY, BY TYPE, 2021–2029 (USD MILLION)
                        TABLE 132 REST OF EUROPE: TRANSDERMAL PATCHES MARKET, BY DISTRIBUTION CHANNEL  2021–2029 (USD MILLION)
                        TABLE 133 REST OF EUROPE: TRANSDERMAL PATCHES MARKET, BY END USER,  2021–2029 (USD MILLION)
     11.4 ASIA PACIFIC 
             11.4.1 IMPACT OF RECESSION ON ASIA PACIFIC TRANSDERMAL  PATCHES MARKET
                        FIGURE 37 ASIA PACIFIC: TRANSDERMAL PATCHES MARKET SNAPSHOT
                        TABLE 134 ASIA PACIFIC: TRANSDERMAL PATCHES MARKET, BY COUNTRY,  2021–2029 (USD MILLION)
                        TABLE 135 ASIA PACIFIC: TRANSDERMAL PATCHES MARKET, BY PATCH TYPE,  2021–2029 (USD MILLION)
                        TABLE 136 ASIA PACIFIC: DRUG-IN-ADHESIVE TRANSDERMAL PATCHES MARKET, BY TYPE,  2021–2029 (USD MILLION)
                        TABLE 137 ASIA PACIFIC: TRANSDERMAL PATCHES MARKET, BY ADHESIVE TYPE,  2021–2029 (USD MILLION)
                        TABLE 138 ASIA PACIFIC: TRANSDERMAL PATCHES MARKET, BY APPLICATION,  2021–2029 (USD MILLION)
                        TABLE 139 ASIA PACIFIC: TRANSDERMAL PATCHES MARKET FOR HORMONE REPLACEMENT THERAPY, BY TYPE, 2021–2029 (USD MILLION)
                        TABLE 140 ASIA PACIFIC: TRANSDERMAL PATCHES MARKET, BY DISTRIBUTION CHANNEL,  2021–2029 (USD MILLION)
                        TABLE 141 ASIA PACIFIC: TRANSDERMAL PATCHES MARKET, BY END USER,  2021–2029 (USD MILLION)
             11.4.2 CHINA
                        11.4.2.1 Large diabetic population to drive market
                                      TABLE 142 CHINA: MACROECONOMIC INDICATORS
                                      TABLE 143 CHINA: TRANSDERMAL PATCHES MARKET, BY PATCH TYPE, 2021–2029 (USD MILLION)
                                      TABLE 144 CHINA: DRUG-IN-ADHESIVE TRANSDERMAL PATCHES MARKET, BY TYPE,  2021–2029 (USD MILLION)
                                      TABLE 145 CHINA: TRANSDERMAL PATCHES MARKET, BY ADHESIVE TYPE,  2021–2029 (USD MILLION)
                                      TABLE 146 CHINA: TRANSDERMAL PATCHES MARKET, BY APPLICATION, 2021–2029 (USD MILLION)
                                      TABLE 147 CHINA: TRANSDERMAL PATCHES MARKET FOR HORMONE REPLACEMENT THERAPY,  BY TYPE, 2021–2029 (USD MILLION)
                                      TABLE 148 CHINA: TRANSDERMAL PATCHES MARKET, BY DISTRIBUTION CHANNEL,  2021–2029 (USD MILLION)
                                      TABLE 149 CHINA: TRANSDERMAL PATCHES MARKET, BY END USER, 2021–2029 (USD MILLION)
             11.4.3 JAPAN
                        11.4.3.1 Increasing number of product approvals and growing focus of local players on R&D of transdermal systems to support market growth
                                      TABLE 150 JAPAN: MACROECONOMIC INDICATORS
                                      TABLE 151 JAPAN: TRANSDERMAL PATCHES MARKET, BY PATCH TYPE, 2021–2029 (USD MILLION)
                                      TABLE 152 JAPAN: DRUG-IN-ADHESIVE TRANSDERMAL PATCHES MARKET, BY TYPE,  2021–2029 (USD MILLION)
                                      TABLE 153 JAPAN: TRANSDERMAL PATCHES MARKET, BY ADHESIVE TYPE,  2021–2029 (USD MILLION)
                                      TABLE 154 JAPAN: TRANSDERMAL PATCHES MARKET, BY APPLICATION, 2021–2029 (USD MILLION)
                                      TABLE 155 JAPAN: TRANSDERMAL PATCHES MARKET FOR HORMONE REPLACEMENT THERAPY, BY TYPE, 2021–2029 (USD MILLION)
                                      TABLE 156 JAPAN: TRANSDERMAL PATCHES MARKET, BY DISTRIBUTION CHANNEL,  2021–2029 (USD MILLION)
                                      TABLE 157 JAPAN: TRANSDERMAL PATCHES MARKET, BY END USER, 2021–2029 (USD MILLION)
             11.4.4 INDIA
                        11.4.4.1 Increasing focus on noninvasive methods of drug delivery to drive market
                                      TABLE 158 INDIA: MACROECONOMIC INDICATORS
                                      TABLE 159 INDIA: TRANSDERMAL PATCHES MARKET, BY PATCH TYPE, 2021–2029 (USD MILLION)
                                      TABLE 160 INDIA: DRUG-IN-ADHESIVE TRANSDERMAL PATCHES MARKET, BY TYPE,  2021–2029 (USD MILLION)
                                      TABLE 161 INDIA: TRANSDERMAL PATCHES MARKET, BY ADHESIVE TYPE,  2021–2029 (USD MILLION)
                                      TABLE 162 INDIA: TRANSDERMAL PATCHES MARKET, BY APPLICATION, 2021–2029 (USD MILLION)
                                      TABLE 163 INDIA: TRANSDERMAL PATCHES MARKET FOR HORMONE REPLACEMENT THERAPY,  BY TYPE, 2021–2029 (USD MILLION)
                                      TABLE 164 INDIA: TRANSDERMAL PATCHES MARKET, BY DISTRIBUTION CHANNEL,  2021–2029 (USD MILLION)
                                      TABLE 165 INDIA: TRANSDERMAL PATCHES MARKET, BY END USER, 2021–2029 (USD MILLION)
             11.4.5 SOUTH KOREA
                        11.4.5.1 Rising healthcare spending and increasing government initiatives to propel market
                                      TABLE 166 SOUTH KOREA: MACROECONOMIC INDICATORS
                                      TABLE 167 SOUTH KOREA: TRANSDERMAL PATCHES MARKET, BY PATCH TYPE,  2021–2029 (USD MILLION)
                                      TABLE 168 SOUTH KOREA: DRUG-IN-ADHESIVE TRANSDERMAL PATCHES MARKET, BY TYPE,  2021–2029 (USD MILLION)
                                      TABLE 169 SOUTH KOREA: TRANSDERMAL PATCHES MARKET, BY ADHESIVE TYPE,  2021–2029 (USD MILLION)
                                      TABLE 170 SOUTH KOREA: TRANSDERMAL PATCHES MARKET, BY APPLICATION,  2021–2029 (USD MILLION)
                                      TABLE 171 SOUTH KOREA: TRANSDERMAL PATCHES MARKET FOR HORMONE REPLACEMENT THERAPY, BY TYPE, 2021–2029 (USD MILLION)
                                      TABLE 172 SOUTH KOREA: TRANSDERMAL PATCHES MARKET, BY DISTRIBUTION CHANNEL,  2021–2029 (USD MILLION)
                                      TABLE 173 SOUTH KOREA: TRANSDERMAL PATCHES MARKET, BY END USER,  2021–2029 (USD MILLION)
             11.4.6 AUSTRALIA
                        11.4.6.1 Increasing number of smokers to drive market
                                      TABLE 174 AUSTRALIA: MACROECONOMIC INDICATORS
                                      TABLE 175 AUSTRALIA: TRANSDERMAL PATCHES MARKET, BY PATCH TYPE,  2021–2029 (USD MILLION)
                                      TABLE 176 AUSTRALIA: DRUG-IN-ADHESIVE TRANSDERMAL PATCHES MARKET, BY TYPE,  2021–2029 (USD MILLION)
                                      TABLE 177 AUSTRALIA: TRANSDERMAL PATCHES MARKET, BY ADHESIVE TYPE,  2021–2029 (USD MILLION)
                                      TABLE 178 AUSTRALIA: TRANSDERMAL PATCHES MARKET, BY APPLICATION,  2021–2029 (USD MILLION)
                                      TABLE 179 AUSTRALIA: TRANSDERMAL PATCHES MARKET FOR HORMONE REPLACEMENT THERAPY, BY TYPE, 2021–2029 (USD MILLION)
                                      TABLE 180 AUSTRALIA: TRANSDERMAL PATCHES MARKET, BY DISTRIBUTION CHANNEL,  2021–2029 (USD MILLION)
                                      TABLE 181 AUSTRALIA: TRANSDERMAL PATCHES MARKET, BY END USER,  2021–2029 (USD MILLION)
             11.4.7 REST OF ASIA PACIFIC
                        TABLE 182 REST OF ASIA PACIFIC: TRANSDERMAL PATCHES MARKET, BY PATCH TYPE,  2021–2029 (USD MILLION)
                        TABLE 183 REST OF ASIA PACIFIC: DRUG-IN-ADHESIVE TRANSDERMAL PATCHES MARKET, BY TYPE, 2021–2029 (USD MILLION)
                        TABLE 184 REST OF ASIA PACIFIC: TRANSDERMAL PATCHES MARKET, BY ADHESIVE TYPE,  2021–2029 (USD MILLION)
                        TABLE 185 REST OF ASIA PACIFIC: TRANSDERMAL PATCHES MARKET, BY APPLICATION,  2021–2029 (USD MILLION)
                        TABLE 186 REST OF ASIA PACIFIC: TRANSDERMAL PATCHES MARKET FOR HORMONE REPLACEMENT THERAPY, BY TYPE, 2021–2029 (USD MILLION)
                        TABLE 187 REST OF ASIA PACIFIC: TRANSDERMAL PATCHES MARKET, BY DISTRIBUTION CHANNEL, 2021–2029 (USD MILLION)
                        TABLE 188 REST OF ASIA PACIFIC: TRANSDERMAL PATCHES MARKET, BY END USER,  2021–2029 (USD MILLION)
     11.5 LATIN AMERICA 
             11.5.1 IMPACT OF RECESSION ON TRANSDERMAL PATCHES MARKET  IN LATIN AMERICA
                        TABLE 189 LATIN AMERICA: TRANSDERMAL PATCHES MARKET, BY COUNTRY,  2021–2029 (USD MILLION)
                        TABLE 190 LATIN AMERICA: TRANSDERMAL PATCHES MARKET, BY PATCH TYPE,  2021–2029 (USD MILLION)
                        TABLE 191 LATIN AMERICA: DRUG-IN-ADHESIVE TRANSDERMAL PATCHES MARKET, BY TYPE,  2021–2029 (USD MILLION)
                        TABLE 192 LATIN AMERICA: TRANSDERMAL PATCHES MARKET, BY ADHESIVE TYPE,  2021–2029 (USD MILLION)
                        TABLE 193 LATIN AMERICA: TRANSDERMAL PATCHES MARKET, BY APPLICATION,  2021–2029 (USD MILLION)
                        TABLE 194 LATIN AMERICA: TRANSDERMAL PATCHES MARKET FOR HORMONE REPLACEMENT THERAPY, BY TYPE, 2021–2029 (USD MILLION)
                        TABLE 195 LATIN AMERICA: TRANSDERMAL PATCHES MARKET, BY DISTRIBUTION CHANNEL,  2021–2029 (USD MILLION)
                        TABLE 196 LATIN AMERICA: TRANSDERMAL PATCHES MARKET, BY END USER,  2021–2029 (USD MILLION)
             11.5.2 BRAZIL
                        11.5.2.1 High prevalence of diabetes to propel market
                                      TABLE 197 BRAZIL: KEY MACROINDICATORS
                                      TABLE 198 BRAZIL: TRANSDERMAL PATCHES MARKET, BY PATCH TYPE, 2021–2029 (USD MILLION)
                                      TABLE 199 BRAZIL: DRUG-IN-ADHESIVE TRANSDERMAL PATCHES MARKET, BY TYPE,  2021–2029 (USD MILLION)
                                      TABLE 200 BRAZIL: TRANSDERMAL PATCHES MARKET, BY ADHESIVE TYPE,  2021–2029 (USD MILLION)
                                      TABLE 201 BRAZIL: TRANSDERMAL PATCHES MARKET, BY APPLICATION, 2021–2029 (USD MILLION)
                                      TABLE 202 BRAZIL: TRANSDERMAL PATCHES MARKET FOR HORMONE REPLACEMENT THERAPY,  BY TYPE, 2021–2029 (USD MILLION)
                                      TABLE 203 BRAZIL: TRANSDERMAL PATCHES MARKET, BY DISTRIBUTION CHANNEL,  2021–2029 (USD MILLION)
                                      TABLE 204 BRAZIL: TRANSDERMAL PATCHES MARKET, BY END USER, 2021–2029 (USD MILLION)
             11.5.3 MEXICO
                        11.5.3.1 Government investments to drive transdermal drug delivery production
                                      TABLE 205 MEXICO: KEY MACROINDICATORS
                                      TABLE 206 MEXICO: TRANSDERMAL PATCHES MARKET, BY PATCH TYPE, 2021–2029 (USD MILLION)
                                      TABLE 207 MEXICO: DRUG-IN-ADHESIVE TRANSDERMAL PATCHES MARKET, BY TYPE,  2021–2029 (USD MILLION)
                                      TABLE 208 MEXICO: TRANSDERMAL PATCHES MARKET, BY ADHESIVE TYPE,  2021–2029 (USD MILLION)
                                      TABLE 209 MEXICO: TRANSDERMAL PATCHES MARKET, BY APPLICATION,  2021–2029 (USD MILLION)
                                      TABLE 210 MEXICO: TRANSDERMAL PATCHES MARKET FOR HORMONE REPLACEMENT THERAPY,  BY TYPE, 2021–2029 (USD MILLION)
                                      TABLE 211 MEXICO: TRANSDERMAL PATCHES MARKET, BY DISTRIBUTION CHANNEL,  2021–2029 (USD MILLION)
                                      TABLE 212 MEXICO: TRANSDERMAL PATCHES MARKET, BY END USER, 2021–2029 (USD MILLION)
             11.5.4 REST OF LATIN AMERICA
                        TABLE 213 REST OF LATIN AMERICA: TRANSDERMAL PATCHES MARKET, BY PATCH TYPE,  2021–2029 (USD MILLION)
                        TABLE 214 REST OF LATIN AMERICA: DRUG-IN-ADHESIVE TRANSDERMAL PATCHES MARKET,  BY TYPE, 2021–2029 (USD MILLION)
                        TABLE 215 REST OF LATIN AMERICA: TRANSDERMAL PATCHES MARKET, BY ADHESIVE TYPE,  2021–2029 (USD MILLION)
                        TABLE 216 REST OF LATIN AMERICA: TRANSDERMAL PATCHES MARKET, BY APPLICATION,  2021–2029 (USD MILLION)
                        TABLE 217 REST OF LATIN AMERICA: TRANSDERMAL PATCHES MARKET FOR HORMONE REPLACEMENT THERAPY, BY TYPE, 2021–2029 (USD MILLION)
                        TABLE 218 REST OF LATIN AMERICA: TRANSDERMAL PATCHES MARKET, BY DISTRIBUTION CHANNEL, 2021–2029 (USD MILLION)
                        TABLE 219 REST OF LATIN AMERICA: TRANSDERMAL PATCHES MARKET, BY END USER,  2021–2029 (USD MILLION)
     11.6 MIDDLE EAST & AFRICA 
             11.6.1 GOVERNMENT SUPPORT TO BOOST LOCAL PRODUCTION TO OFFER GROWTH OPPORTUNITIES FOR TRANSDERMAL PATCH MANUFACTURERS
             11.6.2 IMPACT OF RECESSION ON TRANSDERMAL PATCHES MARKET  IN MIDDLE EAST AND AFRICA
                        TABLE 220 MIDDLE EAST & AFRICA: TRANSDERMAL PATCHES MARKET, BY PATCH TYPE,  2021–2029 (USD MILLION)
                        TABLE 221 MIDDLE EAST & AFRICA: DRUG-IN-ADHESIVE TRANSDERMAL PATCHES MARKET, BY TYPE, 2021–2029 (USD MILLION)
                        TABLE 222 MIDDLE EAST & AFRICA: TRANSDERMAL PATCHES MARKET, BY ADHESIVE TYPE,  2021–2029 (USD MILLION)
                        TABLE 223 MIDDLE EAST & AFRICA: TRANSDERMAL PATCHES MARKET, BY APPLICATION,  2021–2029 (USD MILLION)
                        TABLE 224 MIDDLE EAST & AFRICA: TRANSDERMAL PATCHES MARKET FOR HORMONE REPLACEMENT THERAPY, BY TYPE, 2021–2029 (USD MILLION)
                        TABLE 225 MIDDLE EAST & AFRICA: TRANSDERMAL PATCHES MARKET, BY DISTRIBUTION CHANNEL, 2021–2029 (USD MILLION)
                        TABLE 226 MIDDLE EAST & AFRICA: TRANSDERMAL PATCHES MARKET, BY END USER,  2021–2029 (USD MILLION)
 
12 COMPETITIVE LANDSCAPE (Page No. - 204)
     12.1 INTRODUCTION 
             TABLE 227 KEY DEVELOPMENTS IN TRANSDERMAL PATCHES MARKET  (JANUARY 2020–OCTOBER 2023)
     12.2 REVENUE ANALYSIS OF KEY MARKET PLAYERS 
             FIGURE 38 REVENUE ANALYSIS OF KEY PLAYERS IN TRANSDERMAL PATCHES MARKET
     12.3 MARKET SHARE ANALYSIS 
             FIGURE 39 TRANSDERMAL PATCHES MARKET SHARE, BY KEY PLAYER, 2022
     12.4 COMPANY FOOTPRINT 
             12.4.1 FOOTPRINT OF COMPANIES IN TRANSDERMAL PATCHES MARKET
             12.4.2 PATCH TYPE FOOTPRINT
             12.4.3 ADHESIVE TYPE FOOTPRINT
             12.4.4 APPLICATION FOOTPRINT
             12.4.5 DISTRIBUTION CHANNEL FOOTPRINT
             12.4.6 END-USER FOOTPRINT
             12.4.7 REGIONAL FOOTPRINT
     12.5 TRANSDERMAL PATCHES MARKET: R&D EXPENDITURE 
             FIGURE 40 R&D EXPENDITURE OF KEY PLAYERS IN TRANSDERMAL PATCHES MARKET (2021 VS. 2022)
     12.6 COMPANY EVALUATION MATRIX 
             12.6.1 STARS
             12.6.2 EMERGING LEADERS
             12.6.3 PERVASIVE PLAYERS
             12.6.4 PARTICIPANTS
                        FIGURE 41 TRANSDERMAL PATCHES MARKET: COMPANY EVALUATION MATRIX, 2022
     12.7 SME/STARTUP EVALUATION MATRIX 
             12.7.1 PROGRESSIVE COMPANIES
             12.7.2 STARTING BLOCKS
             12.7.3 RESPONSIVE COMPANIES
             12.7.4 DYNAMIC COMPANIES
                        FIGURE 42 TRANSDERMAL PATCHES MARKET: SME/STARTUP EVALUATION MATRIX
             12.7.5 COMPETITIVE BENCHMARKING
                        TABLE 228 TRANSDERMAL PATCHES MARKET: DETAILED LIST OF KEY STARTUP/SMES
     12.8 COMPETITIVE SITUATION AND TRENDS 
             12.8.1 PRODUCT LAUNCHES
                        TABLE 229 TRANSDERMAL PATCHES MARKET: PRODUCT LAUNCHES,  JANUARY 2020–OCTOBER 2023
             12.8.2 DEALS
                        TABLE 230 TRANSDERMAL PATCHES MARKET: DEALS, JANUARY 2020–OCTOBER 2023
             12.8.3 OTHER DEVELOPMENTS
                        TABLE 231 TRANSDERMAL PATCHES MARKET: OTHER DEVELOPMENTS,  JANUARY 2020–OCTOBER 2023
 
13 COMPANY PROFILES (Page No. - 221)
(Business overview, Products offered, Recent developments & MnM View)*
     13.1 KEY PLAYERS 
             13.1.1 HISAMITSU PHARMACEUTICAL CO., INC.
                        TABLE 232 HISAMITSU PHARMACEUTICAL CO., INC.: BUSINESS OVERVIEW
                        FIGURE 43 HISAMITSU PHARMACEUTICAL CO., INC.: COMPANY SNAPSHOT (2022)
             13.1.2 VIATRIS INC.
                        TABLE 233 VIATRIS INC.: BUSINESS OVERVIEW
                        FIGURE 44 VIATRIS INC.: COMPANY SNAPSHOT (2022)
             13.1.3 NOVARTIS AG
                        TABLE 234 NOVARTIS AG: BUSINESS OVERVIEW
                        FIGURE 45 NOVARTIS AG: COMPANY SNAPSHOT (2022)
             13.1.4 BOEHRINGER INGELHEIM INTERNATIONAL GMBH
                        TABLE 235 BOEHRINGER INGELHEIM INTERNATIONAL GMBH: BUSINESS OVERVIEW
                        FIGURE 46 BOEHRINGER INGELHEIM INTERNATIONAL GMBH: COMPANY SNAPSHOT (2022)
             13.1.5 JOHNSON & JOHNSON
                        TABLE 236 JOHNSON & JOHNSON: BUSINESS OVERVIEW
                        FIGURE 47 JOHNSON & JOHNSON: COMPANY SNAPSHOT (2022)
             13.1.6 UCB S.A.
                        TABLE 237 UCB S.A.: BUSINESS OVERVIEW
                        FIGURE 48 UCB S.A.: COMPANY SNAPSHOT (2022)
             13.1.7 ENDO INTERNATIONAL PLC
                        TABLE 238 ENDO INTERNATIONAL PLC: BUSINESS OVERVIEW
                        FIGURE 49 ENDO INTERNATIONAL PLC: COMPANY SNAPSHOT (2022)
             13.1.8 LUYE PHARMA GROUP
                        TABLE 239 LUYE PHARMA GROUP: BUSINESS OVERVIEW
                        FIGURE 50 LUYE PHARMA GROUP: COMPANY SNAPSHOT (2022)
             13.1.9 ABBVIE INC.
                        TABLE 240 ABBVIE INC.: BUSINESS OVERVIEW
                        FIGURE 51 ABBVIE INC.: COMPANY SNAPSHOT (2022)
             13.1.10 NITTO DENKO CORPORATION
                        TABLE 241 NITTO DENKO CORPORATION: BUSINESS OVERVIEW
                        FIGURE 52 NITTO DENKO CORPORATION: COMPANY SNAPSHOT (2022)
             13.1.11 CIPLA INC.
                        TABLE 242 CIPLA INC.: BUSINESS OVERVIEW
                        FIGURE 53 CIPLA INC.: COMPANY SNAPSHOT (2022)
             13.1.12 TEVA PHARMACEUTICAL INDUSTRIES LTD.
                        TABLE 243 TEVA PHARMACEUTICAL INDUSTRIES LTD.: BUSINESS OVERVIEW
                        FIGURE 54 TEVA PHARMACEUTICAL INDUSTRIES LTD.: COMPANY SNAPSHOT (2022)
             13.1.13 AGILE THERAPEUTICS
                        TABLE 244 AGILE THERAPEUTICS: BUSINESS OVERVIEW
                        FIGURE 55 AGILE THERAPEUTICS: COMPANY SNAPSHOT (2022)
             13.1.14 BAYER AG
                        TABLE 245 BAYER AG: BUSINESS OVERVIEW
                        FIGURE 56 BAYER AG: COMPANY SNAPSHOT (2022)
             13.1.15 AMNEAL PHARMACEUTICALS LLC
                        TABLE 246 AMNEAL PHARMACEUTICALS LLC: BUSINESS OVERVIEW
                        FIGURE 57 AMNEAL PHARMACEUTICALS LLC: COMPANY SNAPSHOT (2022)
             13.1.16 HIKMA PHARMACEUTICALS PLC
                        TABLE 247 HIKMA PHARMACEUTICALS PLC: BUSINESS OVERVIEW
                        FIGURE 58 HIKMA PHARMACEUTICALS PLC: COMPANY SNAPSHOT (2022)
*Details on Business overview, Products offered, Recent developments & MnM View might not be captured in case of unlisted companies.
     13.2 OTHER PLAYERS 
             13.2.1 ALVOGEN GROUP INC.
                        TABLE 248 ALVOGEN GROUP INC.: COMPANY OVERVIEW
             13.2.2 SPARSHA PHARMA INTERNATIONAL PVT. LTD.
                        TABLE 249 SPARSHA PHARMA INTERNATIONAL PVT. LTD.: COMPANY OVERVIEW
             13.2.3 IONTOPATCH
                        TABLE 250 IONTOPATCH: COMPANY OVERVIEW
             13.2.4 MEDHERANT LIMITED
                        TABLE 251 MEDHERANT LIMITED: COMPANY OVERVIEW
             13.2.5 ADHEXPHARMA
                        TABLE 252 ADHEXPHARMA: COMPANY OVERVIEW
             13.2.6 EVERNOW
                        TABLE 253 EVERNOW: COMPANY OVERVIEW
             13.2.7 LEAD CHEMICAL CO., LTD.
                        TABLE 254 LEAD CHEMICAL CO., LTD.: COMPANY OVERVIEW
             13.2.8 PURDUE PHARMA L.P.
                        TABLE 255 PURDUE PHARMA L.P.: COMPANY OVERVIEW
             13.2.9 MUNDIPHARMA INTERNATIONAL
                        TABLE 256 MUNDIPHARMA INTERNATIONAL: COMPANY OVERVIEW
     13.3 COMPANIES PROVIDING ADHESIVES FOR  TRANSDERMAL PATCHES 
             13.3.1 WACKER CHEMIE AG
                        13.3.1.1 Business overview
                                      TABLE 257 WACKER CHEMIE AG: BUSINESS OVERVIEW
                                      FIGURE 59 WACKER CHEMIE AG: COMPANY SNAPSHOT (2022)
                        13.3.1.2 Products offered
             13.3.2 ELKEM ASA
                        13.3.2.1 Business overview
                                      TABLE 258 ELKEM ASA: BUSINESS OVERVIEW
                                      FIGURE 60 ELKEM ASA: COMPANY SNAPSHOT (2022)
                        13.3.2.2 Products offered
             13.3.3 DUPONT DE NEMOURS, INC.
                        13.3.3.1 Business overview
                                      TABLE 259 DUPONT DE NEMOURS, INC.: BUSINESS OVERVIEW
                                      FIGURE 61 DUPONT DE NEMOURS, INC.: COMPANY SNAPSHOT (2022)
                        13.3.3.2 Products offered
             13.3.4 KATECHO, LLC
                        TABLE 260 KATECHO, LLC: COMPANY OVERVIEW
             13.3.5 POLYMER SCIENCE, INC.
                        TABLE 261 POLYMER SCIENCE, INC.: COMPANY OVERVIEW
 
14 APPENDIX (Page No. - 274)
     14.1 DISCUSSION GUIDE 
     14.2 KNOWLEDGESTORE: MARKETSANDMARKETS’  SUBSCRIPTION PORTAL 
     14.3 CUSTOMIZATION OPTIONS 
     14.4 RELATED REPORTS 
     14.5 AUTHOR DETAILS 

The study involved four major activities in estimating the current size of the Transdermal Patches Market. Exhaustive secondary research was done to collect information on the market, peer market, and parent market. The next step was to validate these findings, assumptions, and sizing with industry experts across the value chain through primary research. Both top-down and bottom-up approaches were employed to estimate the complete market size. After that, market breakdown and data triangulation were used to estimate the market size of segments and subsegments.

Secondary Research

Secondary sources referred to for this research study include financial statements of companies offering Transdermal Patches and information from various trade, business, and professional associations. The secondary data was collected and analyzed to arrive at the overall size of the Transdermal Patches market, which was validated by primary respondents.

Primary Research

Extensive primary research was conducted after obtaining information regarding the Transdermal Patches market scenario through secondary research. Several primary interviews were conducted with market experts from both the demand and supply sides across major countries of North America, Europe, Asia Pacific,  Latin America, and the Middle East & Africa. Primary data was collected through questionnaires, emails, and telephonic interviews. The primary sources from the supply side included various industry experts, such as Chief X Officers (CXOs), Vice Presidents (VPs), Directors from business development, marketing, product development/innovation teams, and related key executives from Transdermal Patches manufacturers; distributors; and key opinion leaders.

Primary interviews were conducted to gather insights such as market statistics, data on revenue collected from the products and services, market breakdowns, market size estimations, market forecasting, and data triangulation. Primary research also helped in understanding the various trends related to technology, application, vertical, and region. Stakeholders from the demand side customers/end users who are using Transdermal Patches were interviewed to understand the buyer’s perspective on the suppliers, products, and their current usage of microfluidics and the future outlook of their business, which will affect the overall market.

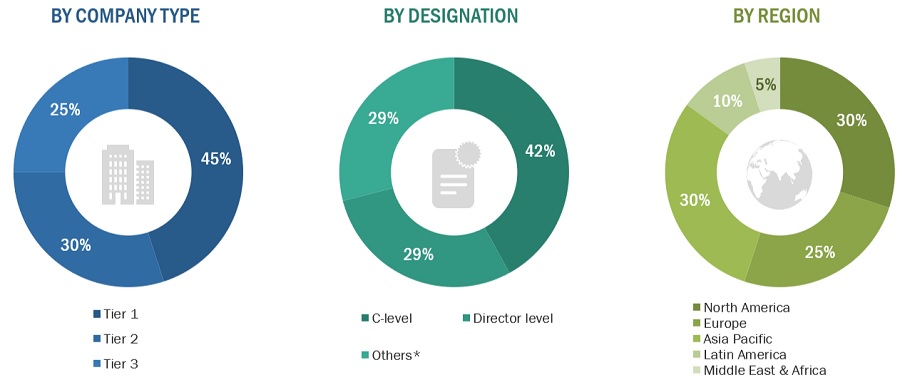
A breakdown of the primary respondents for the Transdermal Patches market is provided below:
Transdermal Patches Market Size, and Share

Note 1: C-level primaries include CEOs, COOs, CTOs, and VPs.

Note 2: Other primaries include Others include sales managers, marketing managers, and product managers.

Note 3: Companies are classified into tiers based on their total revenue. As of 2020: Tier 1=>USD 1 billion, Tier 2 = USD 500 million to USD 1 billion, Tier 3=<USD 500 million

To know about the assumptions considered for the study, download the pdf brochure

Market Size Estimation

The research methodology used to estimate the size of the Transdermal Patches market includes the following details.

The market sizing of the market was undertaken from the global side.

Country-level Analysis: The size of the Transdermal Patches market was obtained from the annual presentations of leading players and secondary data available in the public domain. The share of products and services in the overall Transdermal Patches market was obtained from secondary data and validated by primary participants to arrive at the total Transdermal Patches market. Primary participants further validated the numbers.

Geographic market assessment (by region & country): The geographic assessment was done using the following approaches:

Approach 1: Geographic revenue contributions/splits of leading players in the market (wherever available) and respective growth trends

Approach 2: Geographic adoption trends for individual product segments by end users and growth prospects for each of the segments (assumptions and indicative estimates validated from primary interviews)

At each point, the assumptions and approaches were validated through industry experts contacted during primary research. Considering the limitations of data available from secondary research, revenue estimates for individual companies (for the overall Transdermal Patches market and geographic market assessment) were ascertained based on a detailed analysis of their respective product offerings, geographic reach/strength (direct or through distributors or suppliers), and the shares of the leading players in a particular region or country.

Global Transdermal Patches Market Size: Top-Down Approach

IoT in Smart Cities Market Size, and Share

To know about the assumptions considered for the study, Request for Free Sample Report

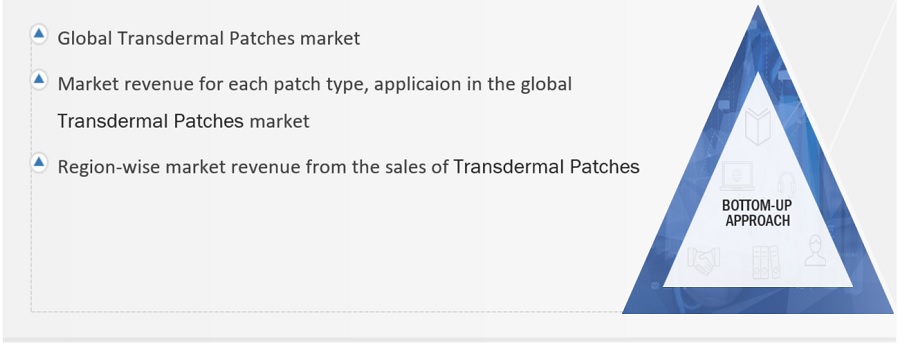
Global Transdermal Patches Market Size: Bottom-Up Approach
Transdermal Patches Market Size, and Share

Data Triangulation

After arriving at the overall size from the market size estimation process explained above, the total market was split into several segments and subsegments. The data triangulation and market breakdown procedures explained below were implemented, wherever applicable, to complete the overall market engineering process and arrive at the exact statistics for various market segments and subsegments. The data was triangulated by studying various factors and trends from the demand and supply sides. Along with this, the market size was validated using both the top-down and bottom-up approaches.

Market Definition

Transdermal patches are medicated adhesive patches that are placed on the skin to deliver a specific dose of medication into the bloodstream. These patches are promising alternatives to oral formulations as they offer improved bioavailability, continuous drug delivery, and reduced side effects, among other advantages. Transdermal patches are especially useful for patients who require constant drug levels.

Key Stakeholders

  • Senior Management
  • Finance Department
  • Procurement Department

Objectives of the Study

  • To describe, analyze, and forecast the transdermal patches market, by patch type, adhesive type, application, distribution channel, end user and region.
  • To describe and forecast the transdermal patches market for key regions, namely, North America, Europe, the Asia Pacific, Latin America, and the Middle East and Africa
  • To provide detailed information regarding the drivers, restraints, opportunities, and challenges influencing the growth of the transdermal patches market
  • To strategically analyze the ecosystem, regulations, patenting trend, value chain, Porter’s five forces, and prices pertaining to the market under study
  • To strategically analyze micro-markets with respect to individual growth trends, prospects, and contributions to the overall market
  • To analyze market opportunities for stakeholders and provide details of the competitive landscape for market players.
  • To profile key players and comprehensively analyze their market shares and core competencies in the transdermal patches market.
  • To analyze competitive developments such as collaborations, acquisitions, product launches, expansions, and R&D activities in the transdermal patches market.

Available Customizations

With the given market data, MarketsandMarkets offers customizations as per the company’s specific needs. The following customization options are available for the report:

Geographic Analysis

  • Further breakdown of the Rest of Europe Transdermal Patches market into the Netherlands, Switzerland, Austria, Belgium, and others
  • Further breakdown of the Rest of Asia Pacific Transdermal Patches market into Singapore, Malaysia, and others

Company Information

  • Detailed analysis and profiling of additional market players
Custom Market Research Services

We will customize the research for you, in case the report listed above does not meet with your exact requirements. Our custom research will comprehensively cover the business information you require to help you arrive at strategic and profitable business decisions.

Request Customization
Report Code
MD 8869
Published ON
Nov, 2023
Choose License Type
BUY NOW
  • SHARE
X
Request Customization
Speak to Analyst
Speak to Analyst
OR FACE-TO-FACE MEETING
PERSONALIZE THIS RESEARCH
  • Triangulate with your Own Data
  • Get Data as per your Format and Definition
  • Gain a Deeper Dive on a Specific Application, Geography, Customer or Competitor
  • Any level of Personalization
REQUEST A FREE CUSTOMIZATION
LET US HELP YOU!
  • What are the Known and Unknown Adjacencies Impacting the Transdermal Patches Market
  • What will your New Revenue Sources be?
  • Who will be your Top Customer; what will make them switch?
  • Defend your Market Share or Win Competitors
  • Get a Scorecard for Target Partners
CUSTOMIZED WORKSHOP REQUEST
+1-888-600-6441
  • Call Us
  • +1-888-600-6441 (Corporate office hours)
  • +1-888-600-6441 (US/Can toll free)
  • +44-800-368-9399 (UK office hours)
CONNECT WITH US
ABOUT TRUST ONLINE
©2024 MarketsandMarkets Research Private Ltd. All rights reserved
DMCA.com Protection Status Website Feedback