Translation Management Systems Market

Translation Management Systems Market by Offering (Software (Localization, Terminology Management), Services), Content Type (Audio, Video, Text), Application (Project Management, Billing & Invoice Analysis), Vertical and Region - Global Forecast to 2030

Report Code: TC 8944 Feb, 2024, by marketsandmarkets.com

[417 Pages Report] The Translation Management Systems (TMS) market is currently witnessing robust growth, with estimates indicating a substantial increase in market size. Projections suggest a notable expansion in market value, from USD 2.2 billion in 2024 to USD 5.7 billion by 2030, reflecting a substantial CAGR of 17.2% over the forecast period. This growth surge is propelled by globalization, increased digital content, and expanding cross-border business operations. As businesses endeavor to establish a ubiquitous global footprint, there is a soaring demand for efficient translation solutions to surmount language barriers. TMS emerges as a pivotal catalyst, streamlining translation workflows, fostering collaboration, and ensuring linguistic consistency, thereby becoming indispensable for enterprises managing multilingual content. Additionally, the TMS market's upward trajectory is propelled by the synergy between businesses and advanced technologies like artificial intelligence and machine translation, elevating translation accuracy and speed. This expansion mirrors a broader industry trend wherein businesses increasingly recognize the pivotal role of adept language management in achieving and sustaining global success.

Technology Roadmap of Translation Management Systems Market

The translation management systems market report covers the technology roadmap, with insights into the short-term and long-term developments.

  • Short-term (1-5 Years):
    • Advanced NLP and contextual analysis in TMS will contribute to improved language understanding and translation context.
    • Continued evolution of Neural Machine Translation (NMT) will result in more accurate and context-aware translations.
    • Enhanced data security and compliance features will be integrated into TMS to meet evolving regulatory standards.
    • API capabilities in TMS will be further enhanced for smoother integration with emerging technologies.
    • AI-driven TMS with improved contextual understanding and robust collaboration features will be prominent.
  • Long-term (5+ years):
    • Enhanced neural network architectures in TMS will enable more sophisticated language processing.
    • AI translation will evolve with reasoning capabilities for improved context-aware translations.
    • Blockchain integration will secure translations and maintain the integrity of translated content.
    • TMS will offer multimodal translation capabilities, managing various forms of content including images and audio.
    • Industry-specific language models and predictive translation will support specialized use cases for emerging topics.

Translation Management Systems Market

To know about the assumptions considered for the study, Request for Free Sample Report

Translation Management Systems Market Opportunities

To know about the assumptions considered for the study, download the pdf brochure

Market Dynamics

Driver: The exponential growth of digital content has fueled the need for effective translation solutions

The exponential growth of digital content is a significant driver for the expansion of the Translation Management Systems (TMS) market. As businesses increasingly embrace digital platforms for communication, marketing, and operations, the volume of content produced in various languages has surged. This digital proliferation necessitates efficient translation solutions to bridge language barriers and cater to diverse audiences. TMS, with its ability to streamline and automate translation workflows, emerges as a crucial tool in managing this vast and rapidly expanding pool of digital content. It not only enhances the speed of translation but also ensures consistency and accuracy, enabling businesses to maintain a cohesive global presence and effectively engage with diverse markets. In essence, the growth of digital content amplifies the demand for TMS, making it an indispensable solution for businesses navigating the complexities of a globalized digital landscape.

Restraint: Poor translation accuracy rates caused by less common languages

The restraint of poor translation accuracy rates for less common languages poses a challenge to the TMS market. Automated translation tools within TMS often struggle with languages that have limited linguistic resources, intricate grammatical structures, or less widespread usage. In the case of less common languages, there might be a scarcity of comprehensive datasets and linguistic models, leading to inaccurate translations that fail to capture the nuances and cultural subtleties of the language. As a result, businesses relying on TMS for less common languages may encounter challenges in maintaining the precision and quality required for effective communication. This limitation hampers the broad applicability of TMS across diverse linguistic landscapes and underscores the importance of continual advancements in linguistic research and technology development to address these accuracy concerns.

Opportunity: Integration with AI-driven content creation to streamline creation of multilingual content

Untapped opportunity lies in the integration of translation management systems with AI-driven content creation, offering a streamlined approach to generating multilingual content. By combining TMS with artificial intelligence, businesses can automate and optimize the entire content creation and translation process. AI technologies can be employed to generate initial content in a source language, and TMS can seamlessly take over to translate and localize this content into multiple languages. This integration not only enhances efficiency by reducing manual efforts but also ensures consistency and accuracy across all translated versions. The synergy between TMS and AI-driven content creation presents an opportunity to revolutionize the production of multilingual content, providing businesses with a competitive edge in global markets while maintaining linguistic quality and cultural relevance.

Challenge: Complexities involving translation of language structures

The challenge in the TMS market centers around the intricate complexities of translating diverse language structures. Languages such as Japanese and Korean, with complex hierarchical and context-dependent structures, pose difficulties for automated systems. For instance, idiomatic expressions, word order variations, and nuanced linguistic elements demand a profound understanding of cultural context. TMS platforms face the challenge of accurately conveying not just linguistic meaning but also preserving contextual and cultural nuances. A succinct example is the difficulty in translating idioms, where literal translations may fail to capture the intended meaning. Overcoming these challenges requires continuous advancements in natural language processing and machine learning, pushing TMS capabilities to handle diverse language structures effectively and ensuring accurate, culturally sensitive translations.

Translation Management Systems Market Ecosystem

Top Companies in Translation Management Systems Market

By offering, translation software to be the largest segment by market value in 2024

Translation software is estimated to account for largest market share in 2024 due to its fundamental role in facilitating efficient and accurate language translation. As businesses expand globally, the demand for automated translation tools within TMS has surged to streamline multilingual content management. Translation software enables organizations to swiftly translate vast volumes of text, enhancing productivity and reducing manual efforts. For example, a multinational e-commerce platform utilizes TMS with advanced translation software to automatically convert product descriptions, ensuring a consistent and accurate presentation across multiple languages. The efficiency and scalability offered by translation software make it a cornerstone of TMS solutions, catering to the growing need for rapid and reliable language translation in an increasingly interconnected global business environment.

By content type, audio-based content segment to emerge as the fastest growing segment between 2024 to 2030

Audio-based content is set to witness rapid growth surge during the forecast period, owing to the increasing prevalence of podcasts, audiobooks, and multimedia content. As consumers embrace audio content for its accessibility and convenience, businesses are compelled to translate and localize audio materials to reach wider audiences. TMS facilitates the translation of spoken content by integrating with Automatic Speech Recognition (ASR) and Natural Language Processing (NLP) technologies, enabling accurate transcription and subsequent translation. For instance, a global streaming platform may utilize TMS to seamlessly translate and localize podcasts, ensuring that the linguistic and cultural nuances are preserved across various language markets. The demand for efficient and accurate translation of audio content, driven by the rising popularity of auditory experiences, cements audio-based content as the fastest growing segment by content type in the TMS market.

By application, terminology management is slated to witness the highest growth rate during the forecast period

Terminology management is expected to emerge as the fastest-growing application segment in the TMS market over the forecast period, attributed to its pivotal role in ensuring linguistic precision and consistency. Businesses are increasingly recognizing the significance of maintaining a standardized vocabulary across diverse languages to uphold brand integrity and enhance communication. For instance, a global pharmaceutical company employing TMS with robust terminology management ensures that medical terms and product names are uniformly translated, minimizing the risk of errors, and enhancing regulatory compliance. This heightened awareness of the importance of precise and consistent terminology has propelled the demand for specialized TMS solutions. The growth of terminology management within the TMS market underscores its critical contribution to maintaining linguistic coherence in an increasingly globalized business landscape.

By vertical, healthcare & life sciences segment will account for the largest market share in 2024

Healthcare & life sciences vertical is poised to emerge as the largest segment by market value in 2024, due to the critical need for accurate and culturally sensitive translations in this sector. As this industry operates on a global scale, TMS plays a pivotal role in ensuring precise translations of medical documents, regulatory compliance materials, and patient communications. For instance, a pharmaceutical company employing TMS can seamlessly translate drug labels, clinical trial documents, and patient information leaflets into multiple languages, maintaining accuracy and adherence to regional regulations. The stringent requirements for linguistic precision and compliance within the healthcare & life sciences sector drive the extensive adoption of TMS, making it a cornerstone for global communication in this industry and thus the largest segment by market share.

By region, Asia Pacific is set to experience the fastest growth rate during the forecast period

Asia Pacific is expected to stand out as the fastest-growing market in translation management systems market between 2024–2030. The region's dynamic economic growth and increasing globalization have driven businesses to expand their operations across diverse linguistic landscapes. As companies establish a presence in multiple countries within APAC, the demand for TMS solutions has surged to manage the complexities of translating and localizing content for diverse audiences.

Both the Chinese and Japanese governments are demonstrating a keen interest in supporting language service providers (LSPs) and translator tools. Japan plans to invest USD 19 million in enhancing simultaneous interpretation, a complex translation task, through AI-based software covering 15 languages in the Asia-Pacific region. This move follows China's recent investment in the language services industry as part of the One Belt One Road (OBOR) program, which is attracting international LSPs to the Chinese market due to its emphasis on translation.

The diverse linguistic landscape within the region, encompassing languages such as Chinese, Japanese, Korean, Hindi, and others, poses unique challenges that necessitate advanced TMS solutions. Asia Pacific is experiencing a rise in language studies, notably in China, where over 300 universities offer specialized Master of Translation and Interpreting (MTI) programs. This trend is expected to boost China's translation workforce and global market presence. Additionally, the growth of video-based educational content in the Asia-Pacific region is driving the demand for audiovisual translation expertise, particularly in the context of immersive online learning environments for global students.

North American Translation Management Systems Market Size, and Share

Key Market Players

The translation management systems solution and service providers have implemented various types of organic and inorganic growth strategies, such as new product launches, product upgrades, partnerships, and agreements, business expansions, and mergers and acquisitions to strengthen their offerings in the market. Some major players in the translation management systems market include TransPerfect (US), RWS Group (UK), LanguageLine Solutions (US), Lionbridge (US), and Welocalize (US), along with SMEs and startups such as Babylon Software LTD. (Israel), Crowdin (Estonia), DeepL (Germany), United Language Group (US), and CQ Fluency (US).

Get online access to the report on the World's First Market Intelligence Cloud

  • Easy to Download Historical Data & Forecast Numbers
  • Company Analysis Dashboard for high growth potential opportunities
  • Research Analyst Access for customization & queries
  • Competitor Analysis with Interactive dashboard
  • Latest News, Updates & Trend analysis
Request Sample

Scope of the Report

Report Metrics

Details

Market size available for years

2018–2030

Base year considered

2023

Forecast period

2024–2030

Forecast units

USD (Million)

Segments covered

Offering, Content Type, Application, Business Function, Vertical, and Region

Geographies covered

North America, Europe, Asia Pacific, Middle East & Africa, and Latin America

Companies covered

TransPerfect (US), RWS Group (UK), LanguageLine Solutions (US), Lionbridge (US), Acolad Group (France), Welocalize (US), Translate Plus (UK), Microsoft (US), Google (US), AWS (US), Smartling (US), XTM International (UK), Star Group (Switzerland), memoQ (Hungary), Transifex (US), Oracle (US), Centific (US), and SAP (Germany), Across Systems (Germany), Phrase (Germany), Toppan Digital Language Ltd (UK), Wordbee (Luxembourg), Babylon Software LTD (Israel), Corwdin (Estonia), DeepL (Germany), United Language Group (US), CQ Fluency (US), Lokalise (US), Weglot (France), Smartcat (US), Unbabel (US), Localize (US), and Wordfast (US)

This research report categorizes the translation management systems market based on offering, content type, business function, application, vertical, and region

By Offering
  • Software
    • Translation Software
      • Computer-Assisted Translation
        • Translation Memory Management
        • Translation Alignment Tools
      • Machine Translation
        • Rule-Based Machine Translation
        • Statistical Machine Translation
        • Neural Machine Translation
    • Localization Software
      • Content Management Systems (CMS)
        • Web CMS
        • Enterprise CMS
      • Globalization Management Systems (GMS)
        • Cultural Adaptation Tools
        • Locale-Specific Content Management
    • Translation Project Management Software
      • Project Planning Tools
        • Resource Allocation Software
        • Task Scheduling Tools
        • Team Communication Tools
      • Workflow Automation Tools
        • Task Automation
        • Notification Systems
    • Terminology Management Software
      • Terminology Databases
        • Multi-Lingual Databases
        • Domain-Specific Databases
      • Terminology Extraction Tools
        • Statistical Extraction
        • Machine Learning-Based Extraction
    • Quality Assurance Software
      • Linguistic QA Tools
        • Spellcheckers
        • Grammar Checkers
      • Automation Tools For QA
        • Test Scripting Tools
        • Regression Testing Tools
    • Analytics And Reporting
      • Project Progress Reports
      • Predictive Analytics
    • Other Software (Security & Compliance)
  • Services
    • Professional Services
      • Training & Consulting Services
      • System Integration & Deployment Services
      • Support & Maintenance Services
  • Managed Services
By Content Type
  • Audio-based Content
  • Video-based Content
  • Text-based Content
By Application
  • Translation
    • Machine Translation
    • Neural Machine Translation
  • Terminology Management
    • Dynamic Terminology Management
    • Industry-Specific Terminology
    • Automated Terminology Extraction
    • Cross-Language Terminology Integration
  • Quality Assurance
    • Linguistic Quality Assurance
    • Automated Quality Assurance Tools
    • Real-Time Consistency Checks
    • Multilingual Completeness Verification
  • Project Management
    • Agile Project Management
    • Real-Time Collaboration Tools
    • Resource Allocation and Tracking
    • Automated Project Scheduling
  • Resource Management
    • Translation Memory Management
    • Linguistic Resource Sharing
    • Integration With External Translation Resources
    • Intelligent Resource Recommendation
  • Billing & Invoicing Analysis
    • Cost Estimation and Forecasting
    • Budget Tracking and Analysis
    • Automated Invoicing Systems
    • Revenue Optimization Analytics
  • Other Applications
By Business Function
  • Legal
    • Legal Document Translation
    • Compliance and Regulatory Translation
    • Court Filings Translation
    • Intellectual Property Documentation
    • Litigation Support Translation
    • Others
  • Finance & Accounting
    • Multilingual Financial Reports
    • Cross-Border Invoicing
    • Tax Document Translation
    • Audit Report Translation
    • Financial Compliance Documentation
    • Others
  • Sales & Marketing
    • Multilingual Marketing Campaigns
    • Market Entry Strategy
    • Product Packaging Translation
    • Advertising Content Localization
    • Social Media Campaign Translation
    • Others
  • Human Resources
    • Multilingual Employee Communications
    • Global Workforce Development
    • Training Program Localization
    • HR Policy Translation
    • Employee Benefits Documentation
    • Others
  • Other BusinessFunctions
By Vertical
  • BFSI
  • Healthcare & Life Sciences
  • Manufacturing
  • Retail & E-Commerce
  • Media & Entertainment
  • Education
  • IT & ITeS
  • Travel & Hospitality
  • Other Verticals
By Region
  • North America
    • United States
    • Canada
  • Europe
    • UK
    • Germany
    • France
    • Italy
    • Spain
    • Rest of Europe
  • Asia Pacific
    • China
    • India
    • Japan
    • South Korea
    • Singapore
    • Australia & New Zealand
    • Rest of Asia Pacific
  • Middle East And Africa
    • GCC
    • South Africa
    • Turkey
    • Rest of Middle East And Africa
  • Latin America
    • Brazil
    • Mexico
    • Argentina
    • Rest of Latin America

Recent Developments:

  • In January 2024, Bosch Brazil partnered with Oracle to harness Oracle Digital Assistant’s (ODA) multilingual capabilities. The partnership demonstrates the power of integrating technologies such as artificial intelligence and customer service. Bosch selected ODA because of its versatility in generating and understanding not only responses in different languages, but also its ability to generate speech in multiple languages.
  • In January 2024, Acolad expanded its already extensive solutions and technology portfolio through the introduction of its artificial intelligence powered solution – AI voice-over. The new solution ensures impactful synthetic voice-over and dubbing by combining the latest speech synthesis technology and high-quality resources.
  • In January 2024, OneMeta partnered with Microsoft to introduce its AI-powered translation and transcription Verbum service to Microsoft Teams. OneMeta’s Verbum software translates and transcribes in over 140 languages and has now reached Microsoft IP Co-sell Ready Status
  • In December 2023, Google partnered with Welocalize to evaluate its adaptive translation LLM solution. Welocalize, in partnership with Google, conducted a case study to evaluate the effectiveness of Google’s adaptive translation LLM solution.
  • In December 2023, RWS Group announced the acquisition of Dublin-based Propylon Holdings Limited (Propylon), a provider of content creation, management, and publishing solutions for the government, legal, assurance, audit, and publishing industries.
  • In October 2023, with the aim of strengthening support for all major Indian languages, Microsoft India announced the addition of four new languages: Bhojpuri, Bodo, Dogri, and Kashmiri, to Microsoft Translator. With this latest release, Microsoft Translator now supports a total of 20 Indian languages, including Assamese, Bengali, Gujarati, Hindi, Kannada, Konkani, Maithili, Malayalam, Marathi, Nepali, Odia, Punjabi, Sindhi, Tamil, Telugu, and Urdu. This brings Microsoft Translator a step closer to its goal of supporting all 22 official Indian languages and now covers the languages spoken by almost 95% of the country’s population.
  • In June 2023, Welocalize, a pioneer of tech enablement within language services, announced the launch of its newest innovation: TranslationRate, a plugin for ChatGPT. A first in OpenAI’s plugin store for ChatGPT, the new tool allows users to gain insight into the quality of text translations provided by the language model or input by users.
  • In May 2023, LanguageLine Solutions announced its new partnership with Vibe Health by eVideon, the leader in hospital smart room technology and digital workflow solutions. Through the partnership, Vibe Health and LanguageLine are expanding access to interpreter services at the patient’s bedside.

Frequently Asked Questions (FAQ):

To speak to our analyst for a discussion on the above findings, click Speak to Analyst

TABLE OF CONTENTS
 
1 INTRODUCTION (Page No. - 52)
    1.1 STUDY OBJECTIVES 
    1.2 MARKET DEFINITION 
           1.2.1 INCLUSIONS & EXCLUSIONS
    1.3 STUDY SCOPE 
           1.3.1 MARKET SEGMENTATION
           1.3.2 REGIONS COVERED
    1.4 YEARS CONSIDERED 
    1.5 CURRENCY CONSIDERED 
           TABLE 1 USD EXCHANGE RATES, 2018–2023
    1.6 STAKEHOLDERS 
           1.6.1 IMPACT OF RECESSION
 
2 RESEARCH METHODOLOGY (Page No. - 57)
    2.1 RESEARCH DATA 
           FIGURE 1 TRANSLATION MANAGEMENT SYSTEMS MARKET: RESEARCH DESIGN
           2.1.1 SECONDARY DATA
           2.1.2 PRIMARY DATA
                    TABLE 2 PRIMARY INTERVIEWS
                    2.1.2.1 Breakup of primary profiles
                    2.1.2.2 Key industry insights
    2.2 MARKET BREAKUP AND DATA TRIANGULATION 
           FIGURE 2 DATA TRIANGULATION
    2.3 MARKET SIZE ESTIMATION 
           FIGURE 3 MARKET: TOP-DOWN AND BOTTOM-UP APPROACHES
           2.3.1 TOP-DOWN APPROACH
           2.3.2 BOTTOM-UP APPROACH
                    FIGURE 4 MARKET SIZE ESTIMATION METHODOLOGY – APPROACH 1, BOTTOM-UP (SUPPLY SIDE): REVENUE FROM SOLUTIONS/SERVICES OF TRANSLATION MANAGEMENT SYSTEM VENDORS
                    FIGURE 5 MARKET SIZE ESTIMATION METHODOLOGY – APPROACH 2, BOTTOM-UP  (SUPPLY SIDE): COLLECTIVE REVENUE FROM ALL SOLUTIONS/SERVICES OF TRANSLATION MANAGEMENT SYSTEM VENDORS
                    FIGURE 6 MARKET SIZE ESTIMATION METHODOLOGY – APPROACH 3, BOTTOM-UP  (SUPPLY SIDE): COLLECTIVE REVENUE FROM ALL SOLUTIONS/SERVICES OF TRANSLATION MANAGEMENT SYSTEM VENDORS
                    FIGURE 7 MARKET SIZE ESTIMATION METHODOLOGY – APPROACH 4, BOTTOM-UP (DEMAND SIDE): SHARE OF TRANSLATION MANAGEMENT SYSTEMS THROUGH OVERALL LANGUAGE TECHNOLOGY SPENDING
    2.4 MARKET FORECAST 
           TABLE 3 FACTOR ANALYSIS
    2.5 RESEARCH ASSUMPTIONS 
    2.6 LIMITATIONS AND RISK ASSESSMENT 
    2.7 IMPLICATIONS OF RECESSION ON TRANSLATION MANAGEMENT SYSTEMS MARKET 
           TABLE 4 IMPACT OF RECESSION ON MARKET
 
3 EXECUTIVE SUMMARY (Page No. - 71)
    TABLE 5 TRANSLATION MANAGEMENT SYSTEMS MARKET AND GROWTH RATE,  2018–2023 (USD MILLION, Y-O-Y %) 
    TABLE 6 MARKET AND GROWTH RATE,  2024–2030 (USD MILLION, Y-O-Y %) 
    FIGURE 8 SOFTWARE SEGMENT TO ACCOUNT FOR LARGER MARKET IN 2024 
    FIGURE 9 TRANSLATION SOFTWARE SEGMENT TO LEAD MARKET DURING FORECAST PERIOD 
    FIGURE 10 PROFESSIONAL SERVICES SEGMENT TO DOMINATE MARKET IN 2024 
    FIGURE 11 SYSTEM INTEGRATION & DEPLOYMENT SERVICES SEGMENT TO BE FASTEST-GROWING SEGMENT DURING FORECAST PERIOD 
    FIGURE 12 SALES & MARKETING SEGMENT TO LEAD MARKET IN 2024 
    FIGURE 13 AUDIO-BASED CONTENT SEGMENT TO REGISTER FASTEST GROWTH DURING FORECAST PERIOD 
    FIGURE 14 TRANSLATION SEGMENT TO WITNESS HIGHEST GROWTH DURING FORECAST PERIOD 
    FIGURE 15 RETAIL & E-COMMERCE SEGMENT TO ACHIEVE HIGHEST GROWTH DURING FORECAST PERIOD 
    FIGURE 16 ASIA PACIFIC TO REGISTER HIGHEST GROWTH DURING FORECAST PERIOD 
 
4 PREMIUM INSIGHTS (Page No. - 77)
    4.1 ATTRACTIVE OPPORTUNITIES FOR PLAYERS IN TRANSLATION MANAGEMENT SYSTEMS MARKET 
           FIGURE 17 AMPLIFIED DEMAND FOR LOCALIZATION INSIGHTS TO PROPAGATE EXPONENTIAL GROWTH IN MARKET
    4.2 MARKET: TOP THREE APPLICATIONS 
           FIGURE 18 TERMINOLOGY MANAGEMENT SEGMENT TO ACCOUNT FOR LARGEST SHARE DURING FORECAST PERIOD
    4.3 NORTH AMERICA: MARKET, BY OFFERING AND KEY VERTICAL 
           FIGURE 19 SOFTWARE AND BFSI SEGMENTS TO ACCOUNT FOR SIGNIFICANT SHARE IN 2024
    4.4 MARKET, BY REGION 
           FIGURE 20 EUROPE TO ACCOUNT FOR LARGEST SHARE IN 2024
 
5 MARKET OVERVIEW AND INDUSTRY TRENDS (Page No. - 80)
    5.1 INTRODUCTION 
    5.2 MARKET DYNAMICS 
           FIGURE 21 DRIVERS, RESTRAINTS, OPPORTUNITIES, AND CHALLENGES: TRANSLATION MANAGEMENT SYSTEMS MARKET
           5.2.1 DRIVERS
                    5.2.1.1 Exponential growth of digital content to fuel demand for effective translation solutions
                               FIGURE 22 SUBSTANTIAL RISE IN MULTILINGUALISM ACROSS DIGITAL CONTENT
                    5.2.1.2 Rise in e-commerce platforms to propel adoption of translation services
                               FIGURE 23 E-COMMERCE PLATFORMS WITH HIGHEST PERCENTAGE OF CROSS-BORDER PURCHASES IN 2023
                    5.2.1.3 Increasing cross-border collaboration between individuals and businesses
                    5.2.1.4 Shift toward cloud computing evolving translation software industry
           5.2.2 RESTRAINTS
                    5.2.2.1 Quality concerns with machine translation
                               FIGURE 24 MACHINE-BASED TRANSLATIONS HAVE STRUGGLED TO MATCH HUMAN TRANSLATION ACCURACY
                    5.2.2.2 Poor translation accuracy rates while translating fewer common languages
                               FIGURE 25 LANGUAGES WITH LOWEST MACHINE TRANSLATION ACCURACY RATES, 2022
                    5.2.2.3 Rising concerns about data security and privacy
           5.2.3 OPPORTUNITIES
                    5.2.3.1 Scalability and geographic expansion of businesses with translation management systems
                    5.2.3.2 Cross-platform and cross-device integration to enhance accessibility and usability of translation software
                    5.2.3.3 Integration with AI-driven content creation to streamline process of creating multilingual content
                               FIGURE 26 TOP USE CASES OF AI IN TRANSLATION ACTIVITIES, 2022
           5.2.4 CHALLENGES
                    5.2.4.1 Complexity involved with translating language structures
                               FIGURE 27 REPUTATION DAMAGE CAUSED TO BRANDS IN ASIA PACIFIC BY TRANSLATION MISTAKES, 2022
                    5.2.4.2 Adaptability to constantly evolving language and communication
                    5.2.4.3 Growing ethical concerns and biasness in machine translation models
    5.3 EVOLUTION OF TRANSLATION MANAGEMENT SYSTEMS MARKET 
           FIGURE 28 EVOLUTION OF MARKET
    5.4 ARCHITECTURE OF TRANSLATION MANAGEMENT SYSTEMS 
           FIGURE 29 TRANSLATION MANAGEMENT SYSTEMS: ARCHITECTURE
    5.5 VALUE CHAIN ANALYSIS 
           FIGURE 30 MARKET: VALUE CHAIN ANALYSIS
           TABLE 7 TRANSLATION MANAGEMENT SYSTEMS MARKET: VALUE CHAIN ANALYSIS
    5.6 ECOSYSTEM ANALYSIS/MARKET MAP 
           TABLE 8 TRANSLATION MANAGEMENT SYSTEM MARKET: ECOSYSTEM
           FIGURE 31 KEY PLAYERS IN TRANSLATION MANAGEMENT SYSTEM MARKET ECOSYSTEM
           5.6.1 TRANSLATION MANAGEMENT SOFTWARE PROVIDERS
           5.6.2 TRANSLATION MANAGEMENT SERVICE PROVIDERS
           5.6.3 CLOUD PROVIDERS
           5.6.4 TECHNOLOGY PROVIDERS
           5.6.5 END USERS
           5.6.6 GOVERNMENT & REGULATORY BODIES
    5.7 INVESTMENT LANDSCAPE AND FUNDING SCENARIO 
           FIGURE 32 LEADING TRANSLATION MANAGEMENT STARTUPS, BY FUNDING VALUE AND FUNDING ROUND, 2023
           FIGURE 33 FUNDING IN LANGUAGE TECHNOLOGIES, BY CATEGORY, 2022 (USD MILLION)
           FIGURE 34 LANGUAGE AI FUNDING AS PERCENTAGE OF TOTAL AI FUNDING IN MAJOR COUNTRIES, 2013–2018
    5.8 CASE STUDY ANALYSIS 
           5.8.1 MANUFACTURING
                    5.8.1.1 Case study 1: TransPerfect's translation services helped Hamamatsu Photonics reduce costs and maintain high quality
           5.8.2 IT & ITES
                    5.8.2.1 Case study 2: NETGEAR achieved global growth with localization services and technology from RWS Group
           5.8.3 GOVERNMENT & PUBLIC SECTOR
                    5.8.3.1 Case study 3: Video interpretation helped New York Police address language barriers and improve community relations
           5.8.4 RETAIL & E-COMMERCE
                    5.8.4.1 Case study 4: Acolad Group helped Migros update multilingual product information faster with machine translation
           5.8.5 EDUCATION
                    5.8.5.1 Case study 5: Excedo achieved elevated visibility in new market with help of translate plus
    5.9 TECHNOLOGY ANALYSIS 
           5.9.1 KEY TECHNOLOGIES
                    5.9.1.1 Artificial Intelligence (AI) & Machine Learning (ML)
                    5.9.1.2 Neural Machine Translation (NMT)
                    5.9.1.3 Natural Language Processing (NLP)
                    5.9.1.4 Cloud Computing
           5.9.2 COMPLEMENTARY TECHNOLOGIES
                    5.9.2.1 Big Data Analytics
                    5.9.2.2 Speech Recognition
                    5.9.2.3 Optical Character Recognition (OCR)
                    5.9.2.4 Content Management Systems (CMS)
           5.9.3 ADJACENT TECHNOLOGIES
                    5.9.3.1 Localization Automation Systems
                    5.9.3.2 Terminology Management Systems
                    5.9.3.3 Speech-to-Text (STT) Technology
                    5.9.3.4 Digital Asset Management (DAM) Systems
    5.10 TARIFF AND REGULATORY LANDSCAPE 
           5.10.1 TARIFF RELATED TO COMPUTER SOFTWARE
                    TABLE 9 TARIFF RELATED TO COMPUTER SOFTWARE, 2022
           5.10.2 REGULATORY LANDSCAPE
                    5.10.2.1 Regulatory bodies, government agencies, and other organizations
                               TABLE 10 NORTH AMERICA: REGULATORY BODIES, GOVERNMENT AGENCIES, AND OTHER ORGANIZATIONS
                               TABLE 11 EUROPE: REGULATORY BODIES, GOVERNMENT AGENCIES, AND OTHER ORGANIZATIONS
                               TABLE 12 ASIA PACIFIC: REGULATORY BODIES, GOVERNMENT AGENCIES, AND OTHER ORGANIZATIONS
                               TABLE 13 MIDDLE EAST & AFRICA: REGULATORY BODIES, GOVERNMENT AGENCIES,  AND OTHER ORGANIZATIONS
                               TABLE 14 LATIN AMERICA: REGULATORY BODIES, GOVERNMENT AGENCIES, AND OTHER ORGANIZATIONS
           5.10.3 REGULATIONS: TRANSLATION MANAGEMENT SYSTEMS MARKET
                    5.10.3.1 North America
                               5.10.3.1.1 Title 21 CFR Part 11 Translation Services
                               5.10.3.1.2 Standard Guide for Quality Assurance in Translation (F2575)
                               5.10.3.1.3 Title VI DOT and FTA Language Requirements Under Circular 4702.1B
                    5.10.3.2 Europe
                               5.10.3.2.1 EU Directive 2010/64/EU on the Right to Interpretation and Translation in Criminal Proceedings
                               5.10.3.2.2 EN 15038:2006 - European Quality Standard for Translation Services
                               5.10.3.2.3 General Data Protection Regulation (GDPR)
                    5.10.3.3 Asia Pacific
                               5.10.3.3.1 Standardization of Translation Services (GB/T 19025-2015) - China
                               5.10.3.3.2 Copyright Law (Chapter VI: Translation Rights) - Japan
                               5.10.3.3.3 Certification for Legal Interpreters and Translators (Ministry of Law and Justice) - India
                    5.10.3.4 Middle East & Africa
                               5.10.3.4.1 Federal Law No. 2 of 2006 on Copyright and Related Rights - UAE
                               5.10.3.4.2 National Qualifications Framework (NQF) Levels for Translation – South Africa
                               5.10.3.4.3 Regulations for Government Translation Services (Ministry of Culture and Information) – Kingdom of Saudi Arabia
                    5.10.3.5 Latin America
                               5.10.3.5.1 LGPD - Lei Geral de Proteção de Dados, Law No. 13.709/2018 - Brazil
                               5.10.3.5.2 Law on Audiovisual Communication Services (Law No. 26.522) - Argentina
                               5.10.3.5.3 Regulations on the Rights of Indigenous Peoples and Communities (Constitutional Reform and General Law on Indigenous Rights and Communities) - Mexico
    5.11 PATENT ANALYSIS 
           5.11.1 METHODOLOGY
           5.11.2 PATENTS FILED, BY DOCUMENT TYPE
                    TABLE 15 PATENTS FILED, 2013–2023
           5.11.3 INNOVATION AND PATENT APPLICATIONS
                    FIGURE 35 NUMBER OF PATENTS GRANTED IN LAST 10 YEARS, 2013–2023
                    5.11.3.1 Top 10 applicants in translation management systems market
                    FIGURE 36 TOP 10 APPLICANTS IN MARKET,  2013–2023
                    TABLE 16 TOP 20 PATENT OWNERS IN MARKET,  2013–2023
                    TABLE 17 LIST OF FEW PATENTS IN MARKET, 2022–2023
                    FIGURE 37 REGIONAL ANALYSIS OF PATENTS GRANTED, 2013–2023
    5.12 PRICING ANALYSIS 
           5.12.1 AVERAGE SELLING PRICE TREND OF KEY PLAYERS, BY SOFTWARE TYPE
                    FIGURE 38 AVERAGE SELLING PRICE TREND OF KEY PLAYERS, BY SOFTWARE TYPE
                    TABLE 18 AVERAGE SELLING PRICE TREND OF KEY PLAYERS, BY KEY SOFTWARE TYPE
           5.12.2 INDICATIVE PRICING ANALYSIS, BY TRANSLATION MANAGEMENT SYSTEMS VENDOR
                    TABLE 19 INDICATIVE PRICING LEVELS OF TRANSLATION MANAGEMENT SYSTEMS VENDORS
    5.13 TRADE ANALYSIS 
           5.13.1 EXPORT SCENARIO OF COMPUTER SOFTWARE
                    FIGURE 39 EXPORT OF COMPUTER SOFTWARE, BY KEY COUNTRY,  2015–2022 (USD BILLION)
           5.13.2 IMPORT SCENARIO OF COMPUTER SOFTWARE
                    FIGURE 40 IMPORT OF COMPUTER SOFTWARE, BY KEY COUNTRY,  2015–2022 (USD BILLION)
    5.14 KEY CONFERENCES & EVENTS, 2024–2025 
                    TABLE 20 TRANSLATION MANAGEMENT SYSTEMS MARKET: DETAILED LIST OF CONFERENCES & EVENTS, 2024–2025
    5.15 PORTER’S FIVE FORCES ANALYSIS 
                    TABLE 21 PORTER’S FIVE FORCES’ IMPACT ON  MARKET
                    FIGURE 41 PORTER’S FIVE FORCES ANALYSIS: MARKET
           5.15.1 THREAT OF NEW ENTRANTS
           5.15.2 THREAT OF SUBSTITUTES
           5.15.3 BARGAINING POWER OF SUPPLIERS
           5.15.4 BARGAINING POWER OF BUYERS
           5.15.5 INTENSITY OF COMPETITIVE RIVALRY
    5.16 TRANSLATION MANAGEMENT SYSTEMS MARKET: TECHNOLOGY ROADMAP 
                    FIGURE 42 TECHNOLOGY ROADMAP FOR MARKET
    5.17 TRANSLATION MANAGEMENT SYSTEMS: BUSINESS MODELS 
                    FIGURE 43 TRANSLATION MANAGEMENT SYSTEMS: BUSINESS MODELS
           5.17.1 SOFTWARE VENDOR MODEL
           5.17.2 CONSULTING SERVICES MODEL
           5.17.3 PLATFORM INTEGRATOR MODEL
    5.18 TRENDS/DISRUPTIONS IMPACTING CUSTOMERS’ BUSINESSES 
           5.18.1 REVENUE SHIFT & NEW REVENUE POCKETS FOR TRANSLATION MANAGEMENT SYSTEM PROVIDERS
                    FIGURE 44 TRENDS/DISRUPTIONS IMPACTING CUSTOMERS’ BUSINESSES
    5.19 KEY STAKEHOLDERS & BUYING CRITERIA 
           5.19.1 KEY STAKEHOLDERS IN BUYING PROCESS
                    FIGURE 45 INFLUENCE OF STAKEHOLDERS ON BUYING PROCESS FOR KEY VERTICALS
                    TABLE 22 INFLUENCE OF STAKEHOLDERS ON BUYING PROCESS FOR KEY VERTICALS
           5.19.2 BUYING CRITERIA
                    FIGURE 46 KEY BUYING CRITERIA FOR TOP THREE VERTICALS
                    TABLE 23 KEY BUYING CRITERIA FOR TOP THREE VERTICALS
 
6 TRANSLATION MANAGEMENT SYSTEMS MARKET, BY OFFERING (Page No. - 138)
    6.1 INTRODUCTION 
           6.1.1 OFFERING: MARKET DRIVERS
                    FIGURE 47 SOFTWARE SEGMENT TO REGISTER LARGER MARKET SHARE IN 2024
                    TABLE 24 MARKET, BY OFFERING,  2018–2023 (USD MILLION)
                    TABLE 25 MARKET, BY OFFERING,  2024–2030 (USD MILLION)
    6.2 SOFTWARE 
           FIGURE 48 TERMINOLOGY MANAGEMENT SOFTWARE TO BE FASTEST-GROWING SOFTWARE SEGMENT BETWEEN 2024 AND 2030
           TABLE 26 MARKET, BY SOFTWARE,  2018–2023 (USD MILLION)
           TABLE 27 MARKET, BY SOFTWARE,  2024–2030 (USD MILLION)
           6.2.1 TRANSLATION SOFTWARE
                    6.2.1.1 Integration of AI technologies to drive growth of translation software by enhancing translation accuracy and efficiency
                               TABLE 28 TRANSLATION SOFTWARE: MARKET, BY REGION, 2018–2023 (USD MILLION)
                               TABLE 29 TRANSLATION SOFTWARE: TRANSLATION MANAGEMENT SYSTEMS MARKET, BY REGION, 2024–2030 (USD MILLION)
                    6.2.1.2 Computer Assisted Translation
                               6.2.1.2.1 Translation Memory Management
                               6.2.1.2.2 Translation Alignment Tools
                    6.2.1.3 Machine Translation
                               6.2.1.3.1 Rule-based Machine Translation
                               6.2.1.3.2 Statistical Machine Translation
                               6.2.1.3.3 Neural Machine Translation
           6.2.2 LOCALIZATION SOFTWARE
                    6.2.2.1 Surging demand for personalized and culturally resonant global digital experiences to propel growth of localization software
                               TABLE 30 LOCALIZATION SOFTWARE: MARKET, BY REGION, 2018–2023 (USD MILLION)
                               TABLE 31 LOCALIZATION SOFTWARE: MARKET, BY REGION, 2024–2030 (USD MILLION)
                    6.2.2.2 Content Management Systems (CMS)
                               6.2.2.2.1 Web CMS
                               6.2.2.2.2 Enterprise CMS
                    6.2.2.3 Globalization Management Systems (GMS)
                               6.2.2.3.1 Cultural Adaptation Tools
                               6.2.2.3.2 Locale-specific Content Management
           6.2.3 TRANSLATION PROJECT MANAGEMENT SOFTWARE
                    6.2.3.1 Growing complexity of translation projects to fuel demand for efficient project management solutions
                               TABLE 32 TRANSLATION PROJECT MANAGEMENT SOFTWARE: MARKET, BY REGION, 2018–2023 (USD MILLION)
                               TABLE 33 TRANSLATION PROJECT MANAGEMENT SOFTWARE: MARKET, BY REGION, 2024–2030 (USD MILLION)
                    6.2.3.2 Project Planning Tools
                               6.2.3.2.1 Resource Allocation Software
                               6.2.3.2.2 Task Scheduling Tools
                               6.2.3.2.3 Team Communication Tools
                    6.2.3.3 Workflow Automation Tools
                               6.2.3.3.1 Task Automation
                               6.2.3.3.2 Notification Systems
           6.2.4 TERMINOLOGY MANAGEMENT SOFTWARE
                    6.2.4.1 Increasing demand for consistent and accurate use of terminology in multilingual content creation to propel terminology management software
                               TABLE 34 TERMINOLOGY MANAGEMENT SOFTWARE: TRANSLATION MANAGEMENT SYSTEMS MARKET, BY REGION, 2018–2023 (USD MILLION)
                               TABLE 35 TERMINOLOGY MANAGEMENT SOFTWARE: MARKET, BY REGION, 2024–2030 (USD MILLION)
                    6.2.4.2 Terminology Databases
                               6.2.4.2.1 Multilingual Databases
                               6.2.4.2.2 Domain-specific Databases
                    6.2.4.3 Terminology Extraction Tools
                               6.2.4.3.1 Statistical Extraction
                               6.2.4.3.2 Machine Learning-based Extraction
           6.2.5 QUALITY ASSURANCE (QA) SOFTWARE
                    6.2.5.1 Emphasis on delivering high-quality translations and meeting regulatory compliance standards to drive adoption of quality assurance software
                               TABLE 36 QUALITY ASSURANCE SOFTWARE: MARKET,  BY REGION, 2018–2023 (USD MILLION)
                               TABLE 37 QUALITY ASSURANCE SOFTWARE: MARKET,  BY REGION, 2024–2030 (USD MILLION)
                    6.2.5.2 Linguistic QA Tools
                               6.2.5.2.1 Spellcheckers
                               6.2.5.2.2 Grammar Checkers
                    6.2.5.3 QA Automation Tools
                               6.2.5.3.1 Test Scripting Tools
                               6.2.5.3.2 Regression Testing Tools
           6.2.6 ANALYTICS AND REPORTING
                    6.2.6.1 Growing need for data-driven insights to optimize translation processes to expand market size of analytics and reporting solutions
                               TABLE 38 ANALYTICS AND REPORTING: MARKET,  BY REGION, 2018–2023 (USD MILLION)
                               TABLE 39 ANALYTICS AND REPORTING: MARKET,  BY REGION, 2024–2030 (USD MILLION)
                    6.2.6.2 Project Progress Reports
                    6.2.6.3 Predictive Analytics
           6.2.7 OTHER SOFTWARE
                    TABLE 40 OTHER SOFTWARE: TRANSLATION MANAGEMENT SYSTEMS MARKET, BY REGION,  2018–2023 (USD MILLION)
                    TABLE 41 OTHER SOFTWARE: MARKET, BY REGION,  2024–2030 (USD MILLION)
    6.3 SERVICES 
           FIGURE 49 MANAGED SERVICES TO REGISTER HIGHER GROWTH RATE IN MARKET BETWEEN 2024 AND 2030
           TABLE 42 MARKET, BY SERVICE,  2018–2023 (USD MILLION)
           TABLE 43 MARKET, BY SERVICE,  2024–2030 (USD MILLION)
           6.3.1 PROFESSIONAL SERVICES
                    6.3.1.1 Rising adoption of TMS solutions across industries to accentuate demand for expert consultation, training, and implementation services
                               TABLE 44 MARKET, BY PROFESSIONAL SERVICE,  2018–2023 (USD MILLION)
                               TABLE 45 MARKET, BY PROFESSIONAL SERVICE,  2024–2030 (USD MILLION)
                    6.3.1.2 Training & Consulting Services
                               TABLE 46 TRAINING & CONSULTING SERVICES: MARKET,  BY REGION, 2018–2023 (USD MILLION)
                               TABLE 47 TRAINING & CONSULTING SERVICES: MARKET,  BY REGION, 2024–2030 (USD MILLION)
                    6.3.1.3 System Integration & Deployment Services
                               TABLE 48 SYSTEM INTEGRATION & DEPLOYMENT SERVICES: MARKET, BY REGION, 2018–2023 (USD MILLION)
                               TABLE 49 SYSTEM INTEGRATION & DEPLOYMENT SERVICES: MARKET, BY REGION, 2024–2030 (USD MILLION)
                    6.3.1.4 Support & Maintenance Services
                               TABLE 50 SUPPORT & MAINTENANCE SERVICES: MARKET, BY REGION, 2018–2023 (USD MILLION)
                               TABLE 51 SUPPORT & MAINTENANCE SERVICES: MARKET, BY REGION, 2024–2030 (USD MILLION)
           6.3.2 MANAGED SERVICES
                    6.3.2.1 Translation management systems to be outsourced to specialized providers, ensuring continuous system monitoring
                               TABLE 52 MANAGED SERVICES: MARKET, BY REGION, 2018–2023 (USD MILLION)
                               TABLE 53 MANAGED SERVICES: MARKET, BY REGION, 2024–2030 (USD MILLION)
 
7 TRANSLATION MANAGEMENT SYSTEMS MARKET,  BY BUSINESS FUNCTION (Page No. - 176)
    7.1 INTRODUCTION 
           7.1.1 BUSINESS FUNCTION: MARKET DRIVERS
                    FIGURE 50 SALES & MARKETING SEGMENT TO LEAD MARKET DURING FORECAST PERIOD
                    TABLE 54 MARKET, BY BUSINESS FUNCTION,  2018–2023 (USD MILLION)
                    TABLE 55 MARKET, BY BUSINESS FUNCTION,  2024–2030 (USD MILLION)
    7.2 LEGAL 
           7.2.1 ADOPTION OF TMS IN LEGAL SECTOR TO ENSURE LINGUISTIC ACCURACY WITHIN COMPLEX LANDSCAPE OF LEGAL PROCESSES
                    TABLE 56 LEGAL: MARKET, BY REGION,  2018–2023 (USD MILLION)
                    TABLE 57 LEGAL: MARKET, BY REGION,  2024–2030 (USD MILLION)
           7.2.2 LEGAL DOCUMENT TRANSLATION
           7.2.3 COMPLIANCE AND REGULATORY TRANSLATION
           7.2.4 COURT FILINGS TRANSLATION
           7.2.5 INTELLECTUAL PROPERTY DOCUMENTATION
           7.2.6 LITIGATION SUPPORT TRANSLATION
           7.2.7 OTHERS
    7.3 FINANCE & ACCOUNTING 
           7.3.1 FOSTERING FINANCIAL TRANSPARENCY, CONTROL, AND STRATEGIC DECISION-MAKING IN FINANCE & ACCOUNTING TO BE POSSIBLE WITH TMS
                    TABLE 58 FINANCE & ACCOUNTING: MARKET, BY REGION, 2018–2023 (USD MILLION)
                    TABLE 59 FINANCE & ACCOUNTING: MARKET, BY REGION, 2024–2030 (USD MILLION)
           7.3.2 MULTILINGUAL FINANCIAL REPORTS
           7.3.3 CROSS-BORDER INVOICING
           7.3.4 TAX DOCUMENT TRANSLATION
           7.3.5 AUDIT REPORT TRANSLATION
           7.3.6 FINANCIAL COMPLIANCE DOCUMENTATION
           7.3.7 OTHERS
    7.4 SALES & MARKETING 
           7.4.1 TMS IN SALES & MARKETING TO CONTRIBUTE TO OVERALL EFFECTIVENESS OF CROSS-BORDER SALES EFFORTS, FOSTERING SUCCESSFUL BUSINESS TRANSACTIONS AND PARTNERSHIPS
                    TABLE 60 SALES & MARKETING: TRANSLATION MANAGEMENT SYSTEMS MARKET, BY REGION, 2018–2023 (USD MILLION)
                    TABLE 61 SALES & MARKETING: MARKET, BY REGION, 2024–2030 (USD MILLION)
           7.4.2 MULTILINGUAL MARKETING CAMPAIGNS
           7.4.3 MARKET ENTRY STRATEGY
           7.4.4 PRODUCT PACKAGING TRANSLATION
           7.4.5 ADVERTISING CONTENT LOCALIZATION
           7.4.6 SOCIAL MEDIA CAMPAIGN TRANSLATION
           7.4.7 OTHERS
    7.5 HUMAN RESOURCES 
           7.5.1 TMS TO HELP BUSINESSES TO BUILD DIVERSE AND INCLUSIVE TEAMS, TAPPING INTO GLOBAL TALENT POOLS
                    TABLE 62 HUMAN RESOURCES: MARKET, BY REGION, 2018–2023 (USD MILLION)
                    TABLE 63 HUMAN RESOURCES: MARKET, BY REGION, 2024–2030 (USD MILLION)
           7.5.2 MULTILINGUAL EMPLOYEE COMMUNICATIONS
           7.5.3 GLOBAL WORKFORCE DEVELOPMENT
           7.5.4 TRAINING PROGRAM LOCALIZATION
           7.5.5 HR POLICY TRANSLATION
           7.5.6 EMPLOYEE BENEFITS DOCUMENTATION
           7.5.7 OTHERS
    7.6 OTHER BUSINESS FUNCTIONS 
           TABLE 64 OTHER BUSINESS FUNCTIONS: MARKET,  BY REGION, 2018–2023 (USD MILLION)
           TABLE 65 OTHER BUSINESS FUNCTIONS: MARKET,  BY REGION, 2024–2030 (USD MILLION)
 
8 TRANSLATION MANAGEMENT SYSTEMS MARKET,  BY CONTENT TYPE (Page No. - 197)
    8.1 INTRODUCTION 
           8.1.1 CONTENT TYPE: MARKET DRIVERS
                    FIGURE 51 TEXT-BASED CONTENT SEGMENT TO REGISTER LARGEST MARKET SHARE IN 2024
                    TABLE 66 MARKET, BY CONTENT TYPE,  2018–2023 (USD MILLION)
                    TABLE 67 MARKET, BY CONTENT TYPE,  2024–2030 (USD MILLION)
    8.2 AUDIO-BASED CONTENT 
           8.2.1 INCREASING DEMAND FOR DIVERSE AUDIO-BASED CONTENT, INCLUDING PODCASTS, VOICEOVERS, AND AUDIOBOOKS, TO PROPEL NEED FOR TMS SOLUTIONS
                    TABLE 68 AUDIO-BASED CONTENT: MARKET, BY REGION, 2018–2023 (USD MILLION)
                    TABLE 69 AUDIO-BASED CONTENT: MARKET, BY REGION, 2024–2030 (USD MILLION)
    8.3 VIDEO-BASED CONTENT 
           8.3.1 PROLIFERATION OF MULTIMEDIA CONTENT IN MARKETING, EDUCATION, AND ENTERTAINMENT INDUSTRIES TO FUEL NEED FOR ADVANCED TMS TOOLS
                    TABLE 70 VIDEO-BASED CONTENT: MARKET, BY REGION, 2018–2023 (USD MILLION)
                    TABLE 71 VIDEO-BASED CONTENT: MARKET, BY REGION, 2024–2030 (USD MILLION)
    8.4 TEXT-BASED CONTENT 
           8.4.1 SURGE IN DEMAND WITNESSED FOR ACCURATELY TRANSLATING DIVERSE TEXT-BASED CONTENT, INCLUDING WEBSITES, LEGAL DOCUMENTS, AND MARKETING MATERIALS
                    TABLE 72 TEST-BASED CONTENT: MARKET, BY REGION, 2018–2023 (USD MILLION)
                    TABLE 73 TEXT-BASED CONTENT: MARKET, BY REGION, 2024–2030 (USD MILLION)
 
9 TRANSLATION MANAGEMENT SYSTEMS MARKET, BY APPLICATION (Page No. - 205)
    9.1 INTRODUCTION 
           9.1.1 APPLICATION: MARKET DRIVERS
                    FIGURE 52 TRANSLATION SEGMENT TO LEAD MARKET DURING FORECAST PERIOD
                    TABLE 74 MARKET, BY APPLICATION,  2018–2023 (USD MILLION)
                    TABLE 75 MARKET, BY APPLICATION,  2024–2030 (USD MILLION)
    9.2 TRANSLATION 
           9.2.1 INTEGRATION OF MACHINE AND NEURAL MACHINE TRANSLATION WITHIN TMS ENHANCES EFFICIENCY AND CONTRIBUTE TO DEMOCRATIZATION OF TRANSLATION SERVICES
                    TABLE 76 TRANSLATION: MARKET, BY REGION,  2018–2023 (USD MILLION)
                    TABLE 77 TRANSLATION: MARKET, BY REGION,  2024–2030 (USD MILLION)
           9.2.2 MACHINE TRANSLATION
           9.2.3 NEURAL MACHINE TRANSLATION
    9.3 TERMINOLOGY MANAGEMENT 
           9.3.1 TERMINOLOGY MANAGEMENT TO ENSURE CONSISTENCY AND ACCURACY IN TERMINOLOGY USED ACROSS LANGUAGES AND CONTENT TYPES
                    TABLE 78 TERMINOLOGY MANAGEMENT: TRANSLATION MANAGEMENT SYSTEMS MARKET,  BY REGION, 2018–2023 (USD MILLION)
                    TABLE 79 TERMINOLOGY MANAGEMENT: MARKET,  BY REGION, 2024–2030 (USD MILLION)
           9.3.2 DYNAMIC TERMINOLOGY MANAGEMENT
           9.3.3 INDUSTRY-SPECIFIC TERMINOLOGY
           9.3.4 AUTOMATED TERMINOLOGY EXTRACTION
           9.3.5 CROSS-LANGUAGE TERMINOLOGY INTEGRATION
    9.4 QUALITY ASSURANCE 
           9.4.1 QUALITY ASSURANCE TO INCORPORATE INDUSTRY-SPECIFIC COMPLIANCE STANDARDS, ENSURING THAT TRANSLATED CONTENT ALIGNS WITH REGULATORY REQUIREMENTS
                    TABLE 80 QUALITY ASSURANCE: MARKET, BY REGION, 2018–2023 (USD MILLION)
                    TABLE 81 QUALITY ASSURANCE: MARKET, BY REGION, 2024–2030 (USD MILLION)
           9.4.2 LINGUISTIC QUALITY ASSURANCE
           9.4.3 AUTOMATED QUALITY ASSURANCE TOOLS
           9.4.4 REAL-TIME CONSISTENCY CHECKS
           9.4.5 MULTILINGUAL COMPLETENESS VERIFICATION
    9.5 PROJECT MANAGEMENT 
           9.5.1 INTEGRATION OF PROJECT MANAGEMENT APPLICATIONS WITH TMS TO OFFER CENTRALIZED AND COLLABORATIVE ENVIRONMENT FOR PLANNING, ORGANIZING, AND TRACKING TRANSLATION PROJECTS
                    TABLE 82 PROJECT MANAGEMENT: TRANSLATION MANAGEMENT SYSTEMS MARKET, BY REGION, 2018–2023 (USD MILLION)
                    TABLE 83 PROJECT MANAGEMENT: MARKET, BY REGION, 2024–2030 (USD MILLION)
           9.5.2 AGILE PROJECT MANAGEMENT
           9.5.3 REAL-TIME COLLABORATION TOOLS
           9.5.4 RESOURCE ALLOCATION AND TRACKING
           9.5.5 AUTOMATED PROJECT SCHEDULING
    9.6 RESOURCE MANAGEMENT 
           9.6.1 RESOURCE MANAGEMENT APPLICATION TO FACILITATE EFFECTIVE DEPLOYMENT OF TRANSLATION TECHNOLOGIES TO ENHANCE PRODUCTIVITY AND CONSISTENCY
                    TABLE 84 RESOURCE MANAGEMENT: MARKET, BY REGION, 2018–2023 (USD MILLION)
                    TABLE 85 RESOURCE MANAGEMENT: MARKET, BY REGION, 2024–2030 (USD MILLION)
           9.6.2 TRANSLATION MEMORY MANAGEMENT
           9.6.3 LINGUISTIC RESOURCE SHARING
           9.6.4 INTEGRATION WITH EXTERNAL TRANSLATION RESOURCES
           9.6.5 INTELLIGENT RESOURCE RECOMMENDATION
    9.7 BILLING & INVOICING ANALYSIS 
           9.7.1 WITH SOPHISTICATED ALGORITHMS AND ANALYTICS, BILLING AND INVOICING ANALYSIS APPLICATION TO HELP ORGANIZATIONS GENERATE PRECISE INVOICES AND ACCOUNTING
                    TABLE 86 BILLING & INVOICING ANALYSIS: MARKET,  BY REGION, 2018–2023 (USD MILLION)
                    TABLE 87 BILLING & INVOICING ANALYSIS: MARKET,  BY REGION, 2024–2030 (USD MILLION)
           9.7.2 COST ESTIMATION AND FORECASTING
           9.7.3 BUDGET TRACKING AND ANALYSIS
           9.7.4 AUTOMATED INVOICING SYSTEMS
           9.7.5 REVENUE OPTIMIZATION ANALYTICS
    9.8 OTHER APPLICATIONS 
           TABLE 88 OTHER APPLICATIONS: MARKET, BY REGION, 2018–2023 (USD MILLION)
           TABLE 89 OTHER APPLICATIONS: MARKET, BY REGION, 2024–2030 (USD MILLION)
 
10 TRANSLATION MANAGEMENT SYSTEMS MARKET, BY VERTICAL (Page No. - 227)
     10.1 INTRODUCTION 
             10.1.1 VERTICAL: MARKET DRIVERS
                       FIGURE 53 RETAIL & E-COMMERCE VERTICAL TO GROW AT HIGHEST CAGR DURING FORECAST PERIOD
                       TABLE 90 MARKET, BY VERTICAL,  2018–2023 (USD MILLION)
                       TABLE 91 MARKET, BY VERTICAL,  2024–2030 (USD MILLION)
     10.2 BFSI 
             10.2.1 TMS TO FACILITATE INTERNATIONAL EXPANSION OF BANKING SECTOR BY OVERCOMING LANGUAGE BARRIERS AND ENSURING HIGH-QUALITY FINANCIAL TRANSLATIONS
                       TABLE 92 BFSI: MARKET, BY REGION,  2018–2023 (USD MILLION)
                       TABLE 93 BFSI: MARKET, BY REGION,  2024–2030 (USD MILLION)
     10.3 HEALTHCARE & LIFE SCIENCES 
             10.3.1 TRANSLATION MANAGEMENT SYSTEMS TO HANDLE UNIQUE COMPLEXITIES OF MEDICAL TERMINOLOGY, REGULATORY REQUIREMENTS, AND CULTURAL NUANCES
                       TABLE 94 HEALTHCARE & LIFE SCIENCES: MARKET,  BY REGION, 2018–2023 (USD MILLION)
                       TABLE 95 HEALTHCARE & LIFE SCIENCES: MARKET,  BY REGION, 2024–2030 (USD MILLION)
     10.4 MANUFACTURING 
             10.4.1 MANUFACTURERS TO MITIGATE RISKS ASSOCIATED WITH INACCURATE TRANSLATIONS BY PRIORITIZING COMPLIANCE AND QUALITY ASSURANCE
                       TABLE 96 MANUFACTURING: MARKET, BY REGION,  2018–2023 (USD MILLION)
                       TABLE 97 MANUFACTURING: MARKET, BY REGION,  2024–2030 (USD MILLION)
     10.5 RETAIL & E-COMMERCE 
             10.5.1 DIGITAL TECHNOLOGIES TO FACILITATE TRANSPARENCY AND TRACEABILITY, ALLOWING MANUFACTURERS TO MAKE INFORMED DECISIONS
                       TABLE 98 RETAIL & E-COMMERCE: MARKET, BY REGION, 2018–2023 (USD MILLION)
                       TABLE 99 RETAIL & E-COMMERCE: MARKET, BY REGION, 2024–2030 (USD MILLION)
     10.6 MEDIA & ENTERTAINMENT 
             10.6.1 TRANSLATION MANAGEMENT SYSTEMS TO HELP EFFICIENTLY TRANSLATE AND LOCALIZE CONTENT FOR DIVERSE AUDIENCES WORLDWIDE
                       TABLE 100 MEDIA & ENTERTAINMENT: TRANSLATION MANAGEMENT SYSTEMS MARKET, BY REGION, 2018–2023 (USD MILLION)
                       TABLE 101 MEDIA & ENTERTAINMENT: MARKET, BY REGION, 2024–2030 (USD MILLION)
     10.7 GOVERNMENT & PUBLIC SECTOR 
             10.7.1 TMS TO ENHANCE PRODUCTIVITY OF GOVERNMENT & PUBLIC SECTOR BY FACILITATING TRANSLATION AND LOCALIZATION OF LEGAL DOCUMENTS AND OFFICIAL CORRESPONDENCE
                       TABLE 102 GOVERNMENT & PUBLIC SECTOR: MARKET,  BY REGION, 2018–2023 (USD MILLION)
                       TABLE 103 GOVERNMENT & PUBLIC SECTOR: MARKET,  BY REGION, 2024–2030 (USD MILLION)
     10.8 IT & ITES 
             10.8.1 TMS TO ENABLE EFFICIENT TRANSLATION AND LOCALIZATION OF SOFTWARE, WEBSITES, DOCUMENTATION, AND OTHER DIGITAL ASSETS
                       TABLE 104 IT & ITES: MARKET, BY REGION,  2018–2023 (USD MILLION)
                       TABLE 105 IT & ITES: MARKET, BY REGION,  2024–2030 (USD MILLION)
     10.9 TRAVEL & HOSPITALITY 
             10.9.1 TMS TO STREAMLINE TRANSLATION PROCESS, ENABLING TRAVEL & HOSPITALITY COMPANIES TO PROVIDE MULTILINGUAL CONTENT TO CUSTOMERS
                       TABLE 106 TRAVEL & HOSPITALITY: MARKET, BY REGION, 2018–2023 (USD MILLION)
                       TABLE 107 TRAVEL & HOSPITALITY: MARKET, BY REGION, 2024–2030 (USD MILLION)
     10.10 OTHER VERTICALS 
               TABLE 108 OTHER VERTICALS: MARKET, BY REGION,  2018–2023 (USD MILLION)
               TABLE 109 OTHER VERTICALS: MARKET, BY REGION,  2024–2030 (USD MILLION)
 
11 TRANSLATION MANAGEMENT SYSTEMS MARKET, BY REGION (Page No. - 243)
     11.1 INTRODUCTION 
               FIGURE 54 ASIA PACIFIC TO REGISTER HIGHEST CAGR DURING FORECAST PERIOD
               FIGURE 55 SINGAPORE TO REGISTER HIGHEST GROWTH RATE IN MARKET DURING FORECAST PERIOD
               TABLE 110 MARKET, BY REGION, 2018–2023 (USD MILLION)
               TABLE 111 MARKET, BY REGION, 2024–2030 (USD MILLION)
     11.2 NORTH AMERICA 
             11.2.1 NORTH AMERICA: MARKET DRIVERS
             11.2.2 NORTH AMERICA: RECESSION IMPACT
                       TABLE 112 NORTH AMERICA: TRANSLATION MANAGEMENT SYSTEMS MARKET, BY OFFERING,  2018–2023 (USD MILLION)
                       TABLE 113 NORTH AMERICA: MARKET, BY OFFERING,  2024–2030 (USD MILLION)
                       TABLE 114 NORTH AMERICA: MARKET, BY SOFTWARE, 2018–2023 (USD MILLION)
                       TABLE 115 NORTH AMERICA: MARKET, BY SOFTWARE, 2024–2030 (USD MILLION)
                       TABLE 116 NORTH AMERICA: MARKET, BY SERVICE,  2018–2023 (USD MILLION)
                       TABLE 117 NORTH AMERICA: MARKET, BY SERVICE,  2024–2030 (USD MILLION)
                       TABLE 118 NORTH AMERICA: MARKET, BY PROFESSIONAL SERVICE, 2018–2023 (USD MILLION)
                       TABLE 119 NORTH AMERICA: MARKET, BY PROFESSIONAL SERVICES, 2024–2030 (USD MILLION)
                       TABLE 120 NORTH AMERICA: MARKET, BY CONTENT TYPE, 2018–2023 (USD MILLION)
                       TABLE 121 NORTH AMERICA: MARKET, BY CONTENT TYPE, 2024–2030 (USD MILLION)
                       TABLE 122 NORTH AMERICA: MARKET, BY APPLICATION, 2018–2023 (USD MILLION)
                       TABLE 123 NORTH AMERICA: MARKET, BY APPLICATION, 2024–2030 (USD MILLION)
                       TABLE 124 NORTH AMERICA: MARKET, BY BUSINESS FUNCTION, 2018–2023 (USD MILLION)
                       TABLE 125 NORTH AMERICA: MARKET, BY BUSINESS FUNCTION, 2024–2030 (USD MILLION)
                       TABLE 126 NORTH AMERICA: MARKET, BY VERTICAL,  2018–2023 (USD MILLION)
                       TABLE 127 NORTH AMERICA: MARKET, BY VERTICAL,  2024–2030 (USD MILLION)
                       TABLE 128 NORTH AMERICA: MARKET, BY COUNTRY,  2018–2023 (USD MILLION)
                       TABLE 129 NORTH AMERICA: MARKET, BY COUNTRY,  2024–2030 (USD MILLION)
             11.2.3 US
                       11.2.3.1 Proliferation of digital content and growing need to reach diverse audiences to drive market
                                   TABLE 130 US: TRANSLATION MANAGEMENT SYSTEMS MARKET, BY OFFERING,  2018–2023 (USD MILLION)
                                   TABLE 131 US: MARKET, BY OFFERING,  2024–2030 (USD MILLION)
             11.2.4 CANADA
                       11.2.4.1 Diverse, multicultural society and substantial immigrant community boost adoption of TMS platforms
                                   TABLE 132 CANADA: MARKET, BY OFFERING,  2018–2023 (USD MILLION)
                                   TABLE 133 CANADA: MARKET, BY OFFERING,  2024–2030 (USD MILLION)
     11.3 EUROPE 
             11.3.1 EUROPE: MARKET DRIVERS
             11.3.2 EUROPE: RECESSION IMPACT
                       FIGURE 56 EUROPE: TRANSLATION MANAGEMENT SYSTEMS MARKET SNAPSHOT
                       TABLE 134 EUROPE: MARKET, BY OFFERING,  2018–2023 (USD MILLION)
                       TABLE 135 EUROPE: MARKET, BY OFFERING,  2024–2030 (USD MILLION)
                       TABLE 136 EUROPE: MARKET, BY SOFTWARE,  2018–2023 (USD MILLION)
                       TABLE 137 EUROPE: MARKET, BY SOFTWARE,  2024–2030 (USD MILLION)
                       TABLE 138 EUROPE: MARKET, BY SERVICE,  2018–2023 (USD MILLION)
                       TABLE 139 EUROPE: MARKET, BY SERVICE,  2024–2030 (USD MILLION)
                       TABLE 140 EUROPE: MARKET, BY PROFESSIONAL SERVICE, 2018–2023 (USD MILLION)
                       TABLE 141 EUROPE: MARKET, BY PROFESSIONAL SERVICE, 2024–2030 (USD MILLION)
                       TABLE 142 EUROPE: MARKET, BY CONTENT TYPE,  2018–2023 (USD MILLION)
                       TABLE 143 EUROPE: MARKET, BY CONTENT TYPE,  2024–2030 (USD MILLION)
                       TABLE 144 EUROPE: MARKET, BY APPLICATION,  2018–2023 (USD MILLION)
                       TABLE 145 EUROPE: MARKET, BY APPLICATION,  2024–2030 (USD MILLION)
                       TABLE 146 EUROPE: MARKET, BY BUSINESS FUNCTION, 2018–2023 (USD MILLION)
                       TABLE 147 EUROPE: MARKET, BY BUSINESS FUNCTION, 2024–2030 (USD MILLION)
                       TABLE 148 EUROPE: MARKET, BY VERTICAL,  2018–2023 (USD MILLION)
                       TABLE 149 EUROPE: MARKET, BY VERTICAL,  2024–2030 (USD MILLION)
                       TABLE 150 EUROPE: MARKET, BY COUNTRY,  2018–2023 (USD MILLION)
                       TABLE 151 EUROPE: MARKET, BY COUNTRY,  2024–2030 (USD MILLION)
             11.3.3 UK
                       11.3.3.1 Expanding international trade and collaboration - key growth drivers for market
                                   TABLE 152 UK: TRANSLATION MANAGEMENT SYSTEMS MARKET, BY OFFERING,  2018–2023 (USD MILLION)
                                   TABLE 153 UK: MARKET, BY OFFERING,  2024–2030 (USD MILLION)
             11.3.4 GERMANY
                       11.3.4.1 TMS solutions facilitate global trade through precise and culturally relevant translations across industries
                                   TABLE 154 GERMANY: MARKET, BY OFFERING,  2018–2023 (USD MILLION)
                                   TABLE 155 GERMANY: MARKET, BY OFFERING,  2024–2030 (USD MILLION)
             11.3.5 FRANCE
                       11.3.5.1 Market driven by accurate translation and promotion of French identity across luxury, fashion, and arts sectors
                                   TABLE 156 FRANCE: MARKET, BY OFFERING,  2018–2023 (USD MILLION)
                                   TABLE 157 FRANCE: MARKET, BY OFFERING,  2024–2030 (USD MILLION)
             11.3.6 ITALY
                       11.3.6.1 Status as cultural hub and a global destination for luxury and fashion fuels market growth in hospitality sector
                                   TABLE 158 ITALY: MARKET, BY OFFERING,  2018–2023 (USD MILLION)
                                   TABLE 159 ITALY: MARKET, BY OFFERING,  2024–2030 (USD MILLION)
             11.3.7 SPAIN
                       11.3.7.1 Leadership in renewable energy sector, which requires global collaboration, propels demand for TMS
                                   TABLE 160 SPAIN: MARKET, BY OFFERING,  2018–2023 (USD MILLION)
                                   TABLE 161 SPAIN: MARKET, BY OFFERING,  2024–2030 (USD MILLION)
             11.3.8 REST OF EUROPE
                       TABLE 162 REST OF EUROPE: MARKET, BY OFFERING,  2018–2023 (USD MILLION)
                       TABLE 163 REST OF EUROPE: MARKET, BY OFFERING,  2024–2030 (USD MILLION)
     11.4 ASIA PACIFIC 
             11.4.1 ASIA PACIFIC: MARKET DRIVERS
             11.4.2 ASIA PACIFIC: RECESSION IMPACT
                       FIGURE 57 ASIA PACIFIC: MARKET SNAPSHOT
                       TABLE 164 ASIA PACIFIC: TRANSLATION MANAGEMENT SYSTEMS MARKET, BY OFFERING,  2018–2023 (USD MILLION)
                       TABLE 165 ASIA PACIFIC: MARKET, BY OFFERING,  2024–2030 (USD MILLION)
                       TABLE 166 ASIA PACIFIC: MARKET, BY SOFTWARE,  2018–2023 (USD MILLION)
                       TABLE 167 ASIA PACIFIC: MARKET, BY SOFTWARE,  2024–2030 (USD MILLION)
                       TABLE 168 ASIA PACIFIC: MARKET, BY SERVICE,  2018–2023 (USD MILLION)
                       TABLE 169 ASIA PACIFIC: MARKET, BY SERVICE,  2024–2030 (USD MILLION)
                       TABLE 170 ASIA PACIFIC: MARKET, BY PROFESSIONAL SERVICE, 2018–2023 (USD MILLION)
                       TABLE 171 ASIA PACIFIC: MARKET, BY PROFESSIONAL SERVICE, 2024–2030 (USD MILLION)
                       TABLE 172 ASIA PACIFIC: MARKET, BY CONTENT TYPE, 2018–2023 (USD MILLION)
                       TABLE 173 ASIA PACIFIC: MARKET, BY CONTENT TYPE, 2024–2030 (USD MILLION)
                       TABLE 174 ASIA PACIFIC: MARKET, BY APPLICATION,  2018–2023 (USD MILLION)
                       TABLE 175 ASIA PACIFIC: MARKET, BY APPLICATION,  2024–2030 (USD MILLION)
                       TABLE 176 ASIA PACIFIC: MARKET, BY BUSINESS FUNCTION, 2018–2023 (USD MILLION)
                       TABLE 177 ASIA PACIFIC: MARKET, BY BUSINESS FUNCTION, 2024–2030 (USD MILLION)
                       TABLE 178 ASIA PACIFIC: MARKET, BY VERTICAL,  2018–2023 (USD MILLION)
                       TABLE 179 ASIA PACIFIC: MARKET, BY VERTICAL,  2024–2030 (USD MILLION)
                       TABLE 180 ASIA PACIFIC: MARKET, BY COUNTRY,  2018–2023 (USD MILLION)
                       TABLE 181 ASIA PACIFIC: MARKET, BY COUNTRY,  2024–2030 (USD MILLION)
             11.4.3 CHINA
                       11.4.3.1 Rapid globalization and numerous minority languages fuel adoption of translation management systems
                                   TABLE 182 CHINA: TRANSLATION MANAGEMENT SYSTEMS MARKET, BY OFFERING,  2018–2023 (USD MILLION)
                                   TABLE 183 CHINA: MARKET, BY OFFERING,  2024–2030 (USD MILLION)
             11.4.4 INDIA
                       11.4.4.1 22 officially recognized languages make India key for TMS industry
                                   TABLE 184 INDIA: MARKET, BY OFFERING,  2018–2023 (USD MILLION)
                                   TABLE 185 INDIA: MARKET, BY OFFERING,  2024–2030 (USD MILLION)
             11.4.5 JAPAN
                       11.4.5.1 Highly developed technology sector and emphasis on precision to help growth of market
                                   TABLE 186 JAPAN: MARKET, BY OFFERING,  2018–2023 (USD MILLION)
                                   TABLE 187 JAPAN: MARKET, BY OFFERING,  2024–2030 (USD MILLION)
             11.4.6 SOUTH KOREA
                       11.4.6.1 Vibrant entertainment industry and highly developed technological landscape – key to market growth
                                   TABLE 188 SOUTH KOREA: TRANSLATION MANAGEMENT SYSTEMS MARKET, BY OFFERING,  2018–2023 (USD MILLION)
                                   TABLE 189 SOUTH KOREA: MARKET, BY OFFERING,  2024–2030 (USD MILLION)
             11.4.7 SINGAPORE
                       11.4.7.1 Highly developed infrastructure and multilingual workforce - gateway for business expansion
                                   TABLE 190 SINGAPORE: MARKET, BY OFFERING,  2018–2023 (USD MILLION)
                                   TABLE 191 SINGAPORE: MARKET, BY OFFERING,  2024–2030 (USD MILLION)
             11.4.8 AUSTRALIA & NEW ZEALAND
                       11.4.8.1 Increasing demand for cross-border communication drives need for TMS solutions
                                   TABLE 192 AUSTRALIA & NEW ZEALAND: MARKET,  BY OFFERING, 2018–2023 (USD MILLION)
                                   TABLE 193 AUSTRALIA & NEW ZEALAND: MARKET,  BY OFFERING, 2024–2030 (USD MILLION)
             11.4.9 REST OF ASIA PACIFIC
                       TABLE 194 REST OF ASIA PACIFIC: MARKET, BY OFFERING, 2018–2023 (USD MILLION)
                       TABLE 195 REST OF ASIA PACIFIC: MARKET, BY OFFERING, 2024–2030 (USD MILLION)
     11.5 MIDDLE EAST & AFRICA 
             11.5.1 MIDDLE EAST & AFRICA: MARKET DRIVERS
             11.5.2 MIDDLE EAST & AFRICA: RECESSION IMPACT
                       TABLE 196 MIDDLE EAST & AFRICA: TRANSLATION MANAGEMENT SYSTEMS MARKET, BY OFFERING, 2018–2023 (USD MILLION)
                       TABLE 197 MIDDLE EAST & AFRICA: MARKET, BY OFFERING, 2024–2030 (USD MILLION)
                       TABLE 198 MIDDLE EAST & AFRICA: MARKET, BY SOFTWARE, 2018–2023 (USD MILLION)
                       TABLE 199 MIDDLE EAST & AFRICA: MARKET, BY SOFTWARE, 2024–2030 (USD MILLION)
                       TABLE 200 MIDDLE EAST & AFRICA: MARKET, BY SERVICE, 2018–2023 (USD MILLION)
                       TABLE 201 MIDDLE EAST & AFRICA: MARKET, BY SERVICE, 2024–2030 (USD MILLION)
                       TABLE 202 MIDDLE EAST & AFRICA: MARKET,  BY PROFESSIONAL SERVICE, 2018–2023 (USD MILLION)
                       TABLE 203 MIDDLE EAST & AFRICA: MARKET,  BY PROFESSIONAL SERVICE, 2024–2030 (USD MILLION)
                       TABLE 204 MIDDLE EAST & AFRICA: MARKET, BY CONTENT TYPE, 2018–2023 (USD MILLION)
                       TABLE 205 MIDDLE EAST & AFRICA: MARKET, BY CONTENT TYPE, 2024–2030 (USD MILLION)
                       TABLE 206 MIDDLE EAST & AFRICA: MARKET,  BY APPLICATION, 2018–2023 (USD MILLION)
                       TABLE 207 MIDDLE EAST & AFRICA: MARKET,  BY APPLICATION, 2024–2030 (USD MILLION)
                       TABLE 208 MIDDLE EAST & AFRICA: MARKET, BY BUSINESS FUNCTION, 2018–2023 (USD MILLION)
                       TABLE 209 MIDDLE EAST & AFRICA: MARKET, BY BUSINESS FUNCTION, 2024–2030 (USD MILLION)
                       TABLE 210 MIDDLE EAST & AFRICA: MARKET, BY VERTICAL, 2018–2023 (USD MILLION)
                       TABLE 211 MIDDLE EAST & AFRICA: MARKET, BY VERTICAL, 2024–2030 (USD MILLION)
                       TABLE 212 MIDDLE EAST & AFRICA: MARKET, BY COUNTRY, 2018–2023 (USD MILLION)
                       TABLE 213 MIDDLE EAST & AFRICA: MARKET, BY COUNTRY, 2024–2030 (USD MILLION)
             11.5.3 GCC
                       11.5.3.1 Rapid technological advancements and digital transformation initiatives drive adoption
                                   TABLE 214 GCC: TRANSLATION MANAGEMENT SYSTEMS MARKET, BY OFFERING,  2018–2023 (USD MILLION)
                                   TABLE 215 GCC: MARKET, BY OFFERING,  2024–2030 (USD MILLION)
             11.5.4 EGYPT
                       11.5.4.1 Rapid market growth due to advancements in IT infrastructure and digitalization efforts
                                   TABLE 216 EGYPT: MARKET, BY OFFERING,  2018–2023 (USD MILLION)
                                   TABLE 217 EGYPT: MARKET, BY OFFERING,  2024–2030 (USD MILLION)
             11.5.5 SOUTH AFRICA
                       11.5.5.1 Strategic geographical location and status as regional economic hub enhance potential as lucrative market
                                   TABLE 218 SOUTH AFRICA: MARKET, BY OFFERING,  2018–2023 (USD MILLION)
                                   TABLE 219 SOUTH AFRICA: MARKET, BY OFFERING,  2024–2030 (USD MILLION)
             11.5.6 TURKEY
                       11.5.6.1 Economic development to lead to greater demand for translation and localization services
                                   TABLE 220 TURKEY: MARKET, BY OFFERING,  2018–2023 (USD MILLION)
                                   TABLE 221 TURKEY: MARKET, BY OFFERING,  2024–2030 (USD MILLION)
             11.5.7 REST OF MIDDLE EAST & AFRICA
                       TABLE 222 REST OF MIDDLE EAST & AFRICA: MARKET,  BY OFFERING, 2018–2023 (USD MILLION)
                       TABLE 223 REST OF MIDDLE EAST & AFRICA: MARKET,  BY OFFERING, 2024–2030 (USD MILLION)
     11.6 LATIN AMERICA 
             11.6.1 LATIN AMERICA: MARKET DRIVERS
             11.6.2 LATIN AMERICA: RECESSION IMPACT
                       TABLE 224 LATIN AMERICA: TRANSLATION MANAGEMENT SYSTEMS MARKET, BY OFFERING,  2018–2023 (USD MILLION)
                       TABLE 225 LATIN AMERICA: MARKET, BY OFFERING,  2024–2030 (USD MILLION)
                       TABLE 226 LATIN AMERICA: MARKET, BY SOFTWARE,  2018–2023 (USD MILLION)
                       TABLE 227 LATIN AMERICA: MARKET, BY SOFTWARE,  2024–2030 (USD MILLION)
                       TABLE 228 LATIN AMERICA: MARKET, BY SERVICE,  2018–2023 (USD MILLION)
                       TABLE 229 LATIN AMERICA: MARKET, BY SERVICE,  2024–2030 (USD MILLION)
                       TABLE 230 LATIN AMERICA: MARKET, BY PROFESSIONAL SERVICE, 2018–2023 (USD MILLION)
                       TABLE 231 LATIN AMERICA: MARKET, BY PROFESSIONAL SERVICE, 2024–2030 (USD MILLION)
                       TABLE 232 LATIN AMERICA: MARKET, BY CONTENT TYPE, 2018–2023 (USD MILLION)
                       TABLE 233 LATIN AMERICA: MARKET, BY CONTENT TYPE, 2024–2030 (USD MILLION)
                       TABLE 234 LATIN AMERICA: MARKET, BY APPLICATION, 2018–2023 (USD MILLION)
                       TABLE 235 LATIN AMERICA: MARKET, BY APPLICATION, 2024–2030 (USD MILLION)
                       TABLE 236 LATIN AMERICA: MARKET, BY BUSINESS FUNCTION, 2018–2023 (USD MILLION)
                       TABLE 237 LATIN AMERICA: MARKET, BY BUSINESS FUNCTION, 2024–2030 (USD MILLION)
                       TABLE 238 LATIN AMERICA: MARKET, BY VERTICAL,  2018–2023 (USD MILLION)
                       TABLE 239 LATIN AMERICA: MARKET, BY VERTICAL,  2024–2030 (USD MILLION)
                       TABLE 240 LATIN AMERICA: MARKET, BY COUNTRY,  2018–2023 (USD MILLION)
                       TABLE 241 LATIN AMERICA: MARKET, BY COUNTRY,  2024–2030 (USD MILLION)
             11.6.3 BRAZIL
                       11.6.3.1 Robust economy and e-commerce growth amplify necessity for translation and localization services
                                   TABLE 242 BRAZIL: TRANSLATION MANAGEMENT SYSTEMS MARKET, BY OFFERING,  2018–2023 (USD MILLION)
                                   TABLE 243 BRAZIL: MARKET, BY OFFERING,  2024–2030 (USD MILLION)
             11.6.4 MEXICO
                       11.6.4.1 Government initiatives and growing emphasis on internationalization to increase demand for TMS solutions
                                   TABLE 244 MEXICO: MARKET, BY OFFERING,  2018–2023 (USD MILLION)
                                   TABLE 245 MEXICO: MARKET, BY OFFERING,  2024–2030 (USD MILLION)
             11.6.5 ARGENTINA
                       11.6.5.1 Need for efficient language solutions to facilitate linguistic diversity to boost market growth
                                   TABLE 246 ARGENTINA: MARKET, BY OFFERING,  2018–2023 (USD MILLION)
                                   TABLE 247 ARGENTINA: MARKET, BY OFFERING,  2024–2030 (USD MILLION)
             11.6.6 REST OF LATIN AMERICA
                       TABLE 248 REST OF LATIN AMERICA: MARKET, BY OFFERING, 2018–2023 (USD MILLION)
                       TABLE 249 REST OF LATIN AMERICA: MARKET, BY OFFERING, 2024–2030 (USD MILLION)
 
12 COMPETITIVE LANDSCAPE (Page No. - 315)
     12.1 OVERVIEW 
     12.2 KEY PLAYER STRATEGIES 
               TABLE 250 OVERVIEW OF STRATEGIES ADOPTED BY KEY TRANSLATION MANAGEMENT SYSTEM VENDORS
     12.3 REVENUE ANALYSIS 
               FIGURE 58 TOP 5 PLAYERS DOMINATED MARKET FOR LAST 5 YEARS
     12.4 MARKET SHARE ANALYSIS 
               FIGURE 59 SHARE OF LEADING COMPANIES IN MARKET, 2023
             12.4.1 MARKET RANKING ANALYSIS
                       TABLE 251 TRANSLATION MANAGEMENT SYSTEMS MARKET: DEGREE OF COMPETITION
     12.5 BRAND/PRODUCT COMPARATIVE ANALYSIS 
             12.5.1 BRAND/PRODUCT COMPARATIVE ANALYSIS, BY TRANSLATION SOFTWARE
                       FIGURE 60 BRAND/PRODUCT COMPARATIVE ANALYSIS, BY TRANSLATION SOFTWARE
                       12.5.1.1 memoQ
                       12.5.1.2 Smartling
                       12.5.1.3 Lokalise
                       12.5.1.4 Smartcat
             12.5.2 BRAND/PRODUCT COMPARATIVE ANALYSIS, BY TERMINOLOGY MANAGEMENT SOFTWARE
                       FIGURE 61 BRAND/PRODUCT COMPARATIVE ANALYSIS, BY TERMINOLOGY MANAGEMENT SOFTWARE
                       12.5.2.1 Weglot
                       12.5.2.2 RWS
                       12.5.2.3 Transifex
                       12.5.2.4 Wordbee
             12.5.3 BRAND/PRODUCT COMPARATIVE ANALYSIS, BY TRANSLATION QUALITY ASSURANCE SOFTWARE
                       FIGURE 62 BRAND/PRODUCT COMPARATIVE ANALYSIS, BY TRANSLATION QUALITY ASSURANCE SOFTWARE
                       12.5.3.1 Localize
                       12.5.3.2 TransPerfect
                       12.5.3.3 Crowdin
                       12.5.3.4 Welocalize
     12.6 COMPANY VALUATION AND FINANCIAL METRICS OF KEY VENDORS 
               FIGURE 63 COMPANY VALUATION AND FINANCIAL METRICS OF KEY VENDORS
               FIGURE 64 YEAR-TO-DATE (YTD) PRICE TOTAL RETURN AND 5-YEAR STOCK BETA OF KEY VENDORS
     12.7 COMPANY EVALUATION MATRIX, 2023 
             12.7.1 STARS
             12.7.2 EMERGING LEADERS
             12.7.3 PERVASIVE PLAYERS
             12.7.4 PARTICIPANTS
                       FIGURE 65 TRANSLATION MANAGEMENT SYSTEMS MARKET: COMPANY EVALUATION MATRIX, 2023
             12.7.5 COMPANY FOOTPRINT: KEY PLAYERS, 2023
                       12.7.5.1 Company Footprint
                                   FIGURE 66 COMPANY FOOTPRINT (18 COMPANIES)
                       12.7.5.2 Region Footprint
                                   TABLE 252 REGION FOOTPRINT (18 COMPANIES)
                       12.7.5.3 Offering Footprint
                                   TABLE 253 OFFERING FOOTPRINT (18 COMPANIES)
                       12.7.5.4 Vertical Footprint
                                   TABLE 254 VERTICAL FOOTPRINT (18 COMPANIES)
                       12.7.5.5 Business Function Footprint
                                   TABLE 255 BUSINESS FUNCTION FOOTPRINT (18 COMPANIES)
     12.8 COMPANY EVALUATION MATRIX: STARTUPS/SMES, 2023 
             12.8.1 PROGRESSIVE COMPANIES
             12.8.2 RESPONSIVE COMPANIES
             12.8.3 DYNAMIC COMPANIES
             12.8.4 STARTING BLOCKS
                       FIGURE 67 MARKET: STARTUP/SME EVALUATION MATRIX, 2023
             12.8.5 COMPETITIVE BENCHMARKING: STARTUPS/SMES, 2023
                       12.8.5.1 Detailed List of Key Startups/SMEs
                                   TABLE 256 MARKET: DETAILED LIST OF KEY STARTUPS/SMES
                       12.8.5.2 Competitive Benchmarking Of Key Startups/SMEs
                                   TABLE 257 MARKET: COMPETITIVE BENCHMARKING OF STARTUPS/SMES
     12.9 COMPETITIVE SCENARIO AND TRENDS 
             12.9.1 PRODUCT LAUNCHES AND ENHANCEMENTS
                       TABLE 258 MARKET: PRODUCT LAUNCHES AND ENHANCEMENTS, JANUARY 2021–JANUARY 2024
             12.9.2 DEALS
                       TABLE 259 TRANSLATION MANAGEMENT SYSTEMS MARKET: DEALS, JANUARY 2021–JANUARY 2024
 
13 COMPANY PROFILES (Page No. - 342)
     13.1 INTRODUCTION 
     13.2 KEY PLAYERS 
(Business overview, Products /Solutions/Services offered, Recent developments, MnM view, Key strengths, Strategic choices made, and Weaknesses and Competitive threats)*
             13.2.1 TRANSPERFECT
                       TABLE 260 TRANSPERFECT: BUSINESS OVERVIEW
                       TABLE 261 TRANSPERFECT: PRODUCTS/SOLUTIONS/SERVICES OFFERED
                       TABLE 262 TRANSPERFECT: PRODUCT LAUNCHES AND ENHANCEMENTS
                       TABLE 263 TRANSPERFECT: DEALS
             13.2.2 RWS GROUP
                       TABLE 264 RWS GROUP: BUSINESS OVERVIEW
                       FIGURE 68 RWS GROUP: COMPANY SNAPSHOT
                       TABLE 265 RWS GROUP: PRODUCTS/SOLUTIONS/SERVICES OFFERED
                       TABLE 266 RWS GROUP: PRODUCT LAUNCHES AND ENHANCEMENTS
                       TABLE 267 RWS GROUP: DEALS
             13.2.3 LANGUAGELINE SOLUTIONS
                       TABLE 268 LANGUAGELINE SOLUTIONS: BUSINESS OVERVIEW
                       TABLE 269 LANGUAGELINE SOLUTIONS: PRODUCTS/SOLUTIONS/SERVICES OFFERED
                       TABLE 270 LANGUAGELINE SOLUTIONS: DEALS
             13.2.4 LIONBRIDGE
                       TABLE 271 LIONBRIDGE: BUSINESS OVERVIEW
                       TABLE 272 LIONBRIDGE: PRODUCTS/SOLUTIONS/SERVICES OFFERED
                       TABLE 273 LIONBRIDGE: DEALS
             13.2.5 ACOLAD GROUP
                       TABLE 274 ACOLAD GROUP: BUSINESS OVERVIEW
                       TABLE 275 ACOLAD GROUP: PRODUCTS/SOLUTIONS/SERVICES OFFERED
                       TABLE 276 ACOLAD GROUP: PRODUCT LAUNCHES AND ENHANCEMENTS
                       TABLE 277 ACOLAD GROUP: DEALS
             13.2.6 WELOCALIZE
                       TABLE 278 WELOCALIZE: BUSINESS OVERVIEW
                       TABLE 279 WELOCALIZE: PRODUCTS/SOLUTIONS/SERVICES OFFERED
                       TABLE 280 WELOCALIZE: PRODUCT LAUNCHES AND ENHANCEMENTS
                       TABLE 281 WELOCALIZE: DEALS
             13.2.7 MICROSOFT
                       TABLE 282 MICROSOFT: BUSINESS OVERVIEW
                       FIGURE 69 MICROSOFT: COMPANY SNAPSHOT
                       TABLE 283 MICROSOFT: PRODUCTS/SOLUTIONS/SERVICES OFFERED
                       TABLE 284 MICROSOFT: PRODUCT LAUNCHES AND ENHANCEMENTS
                       TABLE 285 MICROSOFT: DEALS
             13.2.8 GOOGLE
                       TABLE 286 GOOGLE: BUSINESS OVERVIEW
                       FIGURE 70 GOOGLE: COMPANY SNAPSHOT
                       TABLE 287 GOOGLE: PRODUCTS/SOLUTIONS/SERVICES OFFERED
                       TABLE 288 GOOGLE: PRODUCT LAUNCHES AND ENHANCEMENTS
                       TABLE 289 GOOGLE: DEALS
             13.2.9 SAP
                       TABLE 290 SAP: BUSINESS OVERVIEW
                       FIGURE 71 SAP: COMPANY SNAPSHOT
                       TABLE 291 SAP: SOLUTIONS/SERVICES/PRODUCTS OFFERED
                       TABLE 292 SAP: DEALS
             13.2.10 ORACLE
                       TABLE 293 ORACLE: BUSINESS OVERVIEW
                       FIGURE 72 ORACLE: COMPANY SNAPSHOT
                       TABLE 294 ORACLE: PRODUCTS/SOLUTIONS/SERVICES OFFERED
                       TABLE 295 ORACLE: PRODUCT LAUNCHES AND ENHANCEMENTS
                       TABLE 296 ORACLE: DEALS
             13.2.11 AWS
                       TABLE 297 AWS: BUSINESS OVERVIEW
                       FIGURE 73 AWS: COMPANY SNAPSHOT
                       TABLE 298 AWS: PRODUCTS/SOLUTIONS/SERVICES OFFERED
                       TABLE 299 AWS: PRODUCT LAUNCHES AND ENHANCEMENTS
                       TABLE 300 AWS: DEALS
             13.2.12 TRANSLATE PLUS
             13.2.13 SMARTLING
             13.2.14 XTM INTERNATIONAL
             13.2.15 STAR GROUP
             13.2.16 MEMOQ
             13.2.17 TRANSIFEX
             13.2.18 CENTIFIC
     13.3 STARTUP/SME PROFILES 
             13.3.1 ACROSS SYSTEMS
             13.3.2 PHRASE
             13.3.3 TOPPAN DIGITAL LANGUAGE
             13.3.4 WORDBEE
             13.3.5 BABYLON SOFTWARE
             13.3.6 CROWDIN
             13.3.7 DEEPL
             13.3.8 UNITED LANGUAGE GROUP
             13.3.9 CQ FLUENCY
             13.3.10 LOKALISE
             13.3.11 WEGLOT
             13.3.12 SMARTCAT
             13.3.13 UNBABEL
             13.3.14 LOCALIZE
             13.3.15 WORDFAST
*Details on Business overview, Products /Solutions/Services offered, Recent developments, Product launches, MnM view, Key strengths, Strategic choices made, and Weaknesses and Competitive threats might not be captured in case of unlisted companies.
 
14 ADJACENT AND RELATED MARKETS (Page No. - 399)
     14.1 INTRODUCTION 
     14.2 SPEECH ANALYTICS MARKET - GLOBAL FORECAST TO 2027 
             14.2.1 MARKET DEFINITION
             14.2.2 MARKET OVERVIEW
                       14.2.2.1 Speech analytics market, by component
                                   TABLE 301 SPEECH ANALYTICS MARKET, BY COMPONENT, 2017–2021 (USD MILLION)
                                   TABLE 302 SPEECH ANALYTICS MARKET, BY COMPONENT, 2022–2027 (USD MILLION)
                       14.2.2.2 Speech analytics market, by business function
                                   TABLE 303 SPEECH ANALYTICS MARKET, BY BUSINESS FUNCTION, 2017–2021 (USD MILLION)
                                   TABLE 304 SPEECH ANALYTICS MARKET, BY BUSINESS FUNCTION, 2022–2027 (USD MILLION)
                       14.2.2.3 Speech analytics market, by organization size
                                   TABLE 305 SPEECH ANALYTICS MARKET, BY ORGANIZATION SIZE, 2017–2021 (USD MILLION)
                                   TABLE 306 SPEECH ANALYTICS MARKET, BY ORGANIZATION SIZE, 2022–2027 (USD MILLION)
                       14.2.2.4 Speech analytics market, by deployment mode
                                   TABLE 307 SPEECH ANALYTICS MARKET, BY DEPLOYMENT MODE, 2017–2021 (USD MILLION)
                                   TABLE 308 SPEECH ANALYTICS MARKET, BY DEPLOYMENT MODE, 2022–2027 (USD MILLION)
                       14.2.2.5 Speech analytics market, by region
                                   TABLE 309 SPEECH ANALYTICS MARKET, BY REGION, 2017–2021 (USD MILLION)
                                   TABLE 310 SPEECH ANALYTICS MARKET, BY REGION, 2022–2027 (USD MILLION)
     14.3 SPEECH-TO-TEXT API MARKET - GLOBAL FORECAST TO 2026 
             14.3.1 MARKET DEFINITION
             14.3.2 MARKET OVERVIEW
                       14.3.2.1 Speech-to-text API market, by component
                                   TABLE 311 SPEECH-TO-TEXT API MARKET, BY COMPONENT, 2017–2020 (USD MILLION)
                                   TABLE 312 SPEECH-TO-TEXT API MARKET, BY COMPONENT, 2021–2026 (USD MILLION)
                       14.3.2.2 Speech-to-text API market, by deployment mode
                                   TABLE 313 SPEECH-TO-TEXT API MARKET, BY DEPLOYMENT MODE, 2017–2020 (USD MILLION)
                                   TABLE 314 SPEECH-TO-TEXT API MARKET, BY DEPLOYMENT MODE, 2021–2026 (USD MILLION)
                       14.3.2.3 Speech-to-text API market, by organization size
                                   TABLE 315 SPEECH-TO-TEXT API MARKET, BY ORGANIZATION SIZE, 2017–2020 (USD MILLION)
                                   TABLE 316 SPEECH-TO-TEXT API MARKET, BY ORGANIZATION SIZE, 2021–2026 (USD MILLION)
                       14.3.2.4 Speech-to-text API market, by region
                                   TABLE 317 SPEECH-TO-TEXT API MARKET, BY REGION, 2017–2020 (USD MILLION)
                                   TABLE 318 SPEECH-TO-TEXT API MARKET, BY REGION, 2021–2026 (USD MILLION)
 
15 APPENDIX (Page No. - 407)
     15.1 DISCUSSION GUIDE 
     15.2 KNOWLEDGESTORE: MARKETSANDMARKETS’  SUBSCRIPTION PORTAL 
     15.3 CUSTOMIZATION OPTIONS 
     15.4 RELATED REPORTS 
     15.5 AUTHOR DETAILS 

The translation management systems market research study involved extensive secondary sources, directories, journals, and paid databases. Primary sources were mainly industry experts from the core and related industries, preferred translation management systems providers, third-party service providers, consulting service providers, end users, and other commercial enterprises. In-depth interviews were conducted with various primary respondents, including key industry participants and subject matter experts, to obtain and verify critical qualitative and quantitative information, and assess the market’s prospects.

Secondary Research

In the secondary research process, various sources were referred to, for identifying and collecting information for this study. Secondary sources included annual reports, press releases, and investor presentations of companies; white papers, journals, and certified publications; and articles from recognized authors, directories, and databases. The data was also collected from other secondary sources, such as journals, government websites, blogs, and vendors websites. Additionally, translation management systems spending of various countries was extracted from the respective sources. Secondary research was mainly used to obtain key information related to the industry’s value chain and supply chain to identify key players based on solutions, services, market classification, and segmentation according to offerings of major players, industry trends related to software, hardware, services, technology, applications, warehouse sizes, verticals, and regions, and key developments from both market- and technology-oriented perspectives.

Primary Research

In the primary research process, various primary sources from both supply and demand sides were interviewed to obtain qualitative and quantitative information on the market. The primary sources from the supply side included various industry experts, including Chief Experience Officers (CXOs); Vice Presidents (VPs); directors from business development, marketing, and translation management systems expertise; related key executives from translation management systems solution vendors, SIs, professional service providers, and industry associations; and key opinion leaders.

Primary interviews were conducted to gather insights, such as market statistics, revenue data collected from solutions and services, market breakups, market size estimations, market forecasts, and data triangulation. Primary research also helped in understanding various trends related to technologies, applications, deployments, and regions. Stakeholders from the demand side, such as Chief Information Officers (CIOs), Chief Technology Officers (CTOs), Chief Strategy Officers (CSOs), and end users using translation management systems solutions, were interviewed to understand the buyer’s perspective on suppliers, products, service providers, and their current usage of translation management systems solutions and services, which would impact the overall translation management systems market.
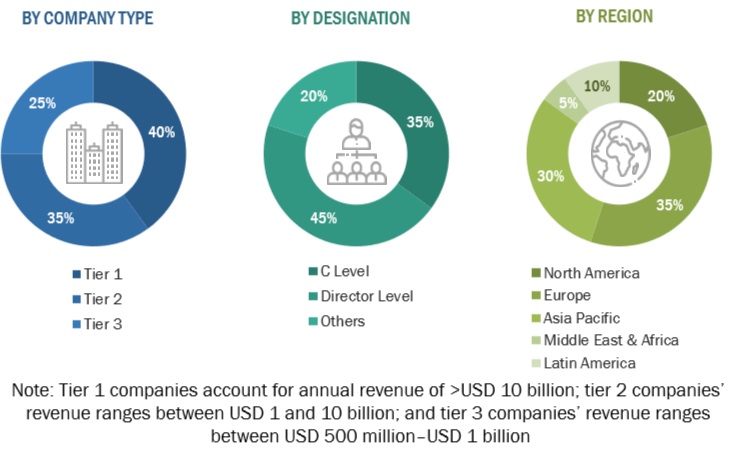
Translation Management Systems  Market Size, and Share

To know about the assumptions considered for the study, download the pdf brochure

COMPANY NAME

DESIGNATION

Lingo24

Language Technology, Localization Content Lifecycle & Translation Workflow Consultant

RWS Group

Director, Linguistic AI Consultant

Localization Lab

Translation and Localization Professional

BingX

Language Localization Specialist & Language Owner

Unbabel

Language Operations Specialist

Commit Global

Localization Project Manager

Pegasystems

Senior Localization Specialist, Product UI

Centific

Director of Strategy & Research

AWS

Senior Consultant AI & ML

Expert AI

Senior Project Manager

Senseforth AI

Senior Software Developer- AI

Market Size Estimation

In the bottom-up approach, the adoption rate of translation management systems solutions and services among different end users in key countries with respect to their regions contributing the most to the market share was identified. For cross-validation, the adoption of translation management systems solutions and services among industries, along with different use cases with respect to their regions, was identified and extrapolated. Weightage was given to use cases identified in different regions for the market size calculation.

Based on the market numbers, the regional split was determined by primary and secondary sources. The procedure included the analysis of the translation management systems market’s regional penetration. Based on secondary research, the regional spending on Information and Communications Technology (ICT), socio-economic analysis of each country, strategic vendor analysis of major translation management systems providers, and organic and inorganic business development activities of regional and global players were estimated. With the data triangulation procedure and data validation through primary interviews, the exact values of the overall translation management systems market size and segments’ size were determined and confirmed using the study.

Global Translation management systems Market Size: Bottom-Up and Top-Down Approach:
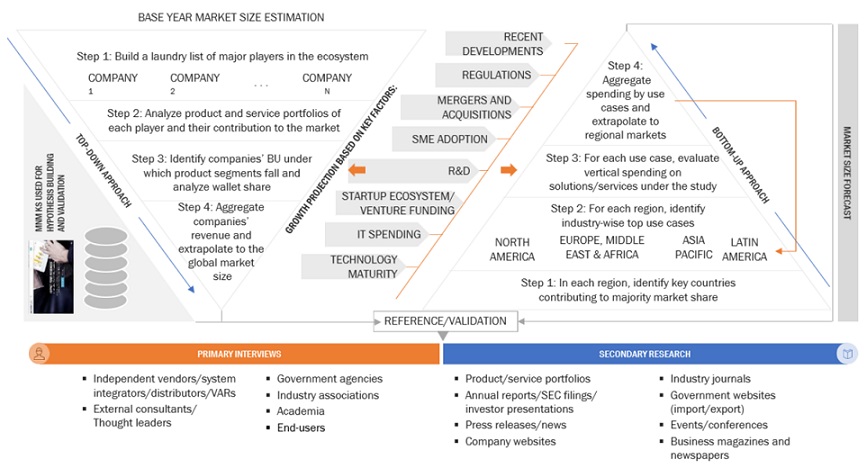
Translation Management Systems  Market Bottom Up Approach

To know about the assumptions considered for the study, Request for Free Sample Report

Data Triangulation

Based on the market numbers, the regional split was determined by primary and secondary sources. The procedure included the analysis of the translation management systems market’s regional penetration. Based on secondary research, the regional spending on Information and Communications Technology (ICT), socio-economic analysis of each country, strategic vendor analysis of major translation management systems providers, and organic and inorganic business development activities of regional and global players were estimated. With the data triangulation procedure and data validation through primaries, the exact values of the overall Translation management systems market size and segments’ size were determined and confirmed using the study.

Market Definition

According to RWS, a translation management system is software for automating human language translation efforts. A TMS’s purpose is to optimize the translation processes in an organization by creating automated workflows for translating repeatable and already previously translated content, freeing time for translators who can now focus on fine-tuning translated content or on translating content that is more nuanced and needs a human touch for a perfect end-result. A TMS centralizes all translation efforts, offering enterprises a single solution for managing all content translation and localization efforts. A TMS comprises tools like translation memory, vocabulary management, collaboration tools, a quality assurance module, or a content translation dashboard for estimating costs. From an integration perspective, most TMSs are based on open standards-based architectures that enable seamless integration with other software from the enterprise suite. Digital asset management (DAM), software configuration management (SCM), databases, and file systems are some content repositories that TMSs integrate, source from, or deliver content to.

Stakeholders

  • Application design and software developers
  • Translation management systems software vendors
  • Business analysts
  • Cloud service providers
  • Consulting service providers
  • Enterprise end-users
  • Distributors and Value-added Resellers (VARs)
  • Government agencies
  • Independent Software Vendors (ISV)
  • Managed service providers
  • Market research and consulting firms
  • Support and maintenance service providers
  • System Integrators (SIs)/migration service providers
  • Language service providers
  • Technology providers

Report Objectives

  • To define, describe, and predict the translation management systems market by offering (software and services), application, content type, business function, vertical, and region
  • To provide detailed information related to major factors (drivers, restraints, opportunities, and industry-specific challenges) influencing the market growth
  • To analyze the micro markets with respect to individual growth trends, prospects, and their contribution to the total market
  • To analyze the opportunities in the market for stakeholders by identifying the high-growth segments of the market
  • To analyze opportunities in the market and provide details of the competitive landscape for stakeholders and market leaders
  • To forecast the market size of segments for five main regions: North America, Europe, Asia Pacific, Middle East Africa, and Latin America
  • To profile key players and comprehensively analyze their market rankings and core competencies.
  • To analyze competitive developments, such as partnerships, new product launches, and mergers and acquisitions, in the market
  • To analyze the impact of recession across all the regions across the translation management systems market

Available Customizations

With the given market data, MarketsandMarkets offers customizations as per your company’s specific needs. The following customization options are available for the report:

Product Analysis

  • Product quadrant, which gives a detailed comparison of the product portfolio of each company.

Geographic Analysis

  • Further breakup of the North American translation management systems market
  • Further breakup of the European market
  • Further breakup of the Asia Pacific market
  • Further breakup of the Middle Eastern & African market
  • Further breakup of the Latin America market

Company Information

  • Detailed analysis and profiling of additional market players (up to five)
Custom Market Research Services

We will customize the research for you, in case the report listed above does not meet with your exact requirements. Our custom research will comprehensively cover the business information you require to help you arrive at strategic and profitable business decisions.

Request Customization
Report Code
TC 8944
Published ON
Feb, 2024
Choose License Type
BUY NOW
  • SHARE
X
Request Customization
Speak to Analyst
Speak to Analyst
OR FACE-TO-FACE MEETING
PERSONALIZE THIS RESEARCH
  • Triangulate with your Own Data
  • Get Data as per your Format and Definition
  • Gain a Deeper Dive on a Specific Application, Geography, Customer or Competitor
  • Any level of Personalization
REQUEST A FREE CUSTOMIZATION
LET US HELP YOU!
  • What are the Known and Unknown Adjacencies Impacting the Translation Management Systems Market
  • What will your New Revenue Sources be?
  • Who will be your Top Customer; what will make them switch?
  • Defend your Market Share or Win Competitors
  • Get a Scorecard for Target Partners
CUSTOMIZED WORKSHOP REQUEST
+1-888-600-6441
  • Call Us
  • +1-888-600-6441 (Corporate office hours)
  • +1-888-600-6441 (US/Can toll free)
  • +44-800-368-9399 (UK office hours)
CONNECT WITH US
ABOUT TRUST ONLINE
©2024 MarketsandMarkets Research Private Ltd. All rights reserved
DMCA.com Protection Status Website Feedback