
Veterinary Software Market Size, Growth, Share & Trends Analysis

Veterinary Software Market by Product (Practice Management, Imaging/PACS, Telehealth, Client Engagement, Herd Management, LIMS), Delivery Mode (Cloud, On-premise), Practice Type (Small Animal, Large Animal), End User & Region - Global Forecast to 2030


OVERVIEW

Source: Secondary Research, Interviews with Experts, MarketsandMarkets Analysis
The veterinary software market is projected to reach USD 2.14 billion by 2030 from USD 1.54 billion in 2025, at a CAGR of 6.9% from 2025 to 2030. Veterinary software comprises specialized computer programs intentionally developed to optimize and augment diverse facets of veterinary practice administration and healthcare delivery. These comprehensive digital solutions integrate patient records management, appointment scheduling, billing, inventory administration, diagnostic imaging, telemedicine capabilities, and laboratory information systems with the overarching goal of enhancing operational effectiveness, data-driven decision-making, and superior animal healthcare provision in veterinary clinics, hospitals, and diagnostic laboratories.
KEY TAKEAWAYS
-
BY PRODUCTThis segment is divided into veterinary practice management software, veterinary PACS, veterinary LIMS, client engagement software, veterinary telehealth software, livestock farm management software, and other software. The veterinary practice management software is adopted widely due to its ability to streamline clinic operations, including appointment scheduling, patient record management, billing, and inventory control, leading to better workflow efficiency and enhanced client satisfaction.
-
BY DELIVERY MODEThe web/ cloud-based segment accounted for the largest share of the global market. This large share is attributed to benefits such as remote accessibility, lower upfront infrastructure costs, automatic software updates, and seamless integration with other digital platforms.
-
BY SOFTWARE TYPEThe integrated software segment dominates due to the rising demand for unified platforms that combine EMR, diagnostics, billing, telehealth, and reporting into a single interface.
-
BY PRACTICE TYPEThe exclusive small animal practices segment leads the market due to the growing companion animal population worldwide, increasing expenditure on pet health and wellness, and rising adoption of preventive care services such as vaccinations and routine check-ups.
-
BY END USERIndependent veterinary clinics held the largest market share in 2024 due to the increasing number of small & mid-sized practices globally and their increasing shift toward digitization to enhance operational efficiency and improve client experience.
-
BY REGIONAsia Pacific is expected to grow fastest with a CAGR of 8.2%, driven by the rapid clinic digitization and increasing pet ownership. North America accounted for the largest share of the veterinary software market, due to well-established veterinary healthcare infrastructure, increasing focus on preventive care, and the presence of key players.
-
COMPETITIVE LANDSCAPEThe major market players have adopted organic and inorganic strategies, including partnerships and collaborations. For instance, Covetrus signed a multi-year strategic alignment with Vetcor, designating Covetrus as the primary partner for in-clinic veterinary products (software) across Vetcor’s 840+ locations in the US and Canada.
The veterinary software market is expected to witness significant growth over the coming years, driven by the rising demand for advanced digital solutions in veterinary care, technological innovation, and the growing need for efficient practice management systems. Veterinary software is increasingly being adopted for its ability to streamline workflows, improve diagnostic accuracy, and enhance client communication, making it essential for managing small, mixed, and large animal practices. The shift toward cloud-based platforms, coupled with the integration of AI, telehealth, and connected care solutions, further strengthens its role in improving operational efficiency and patient outcomes. With an expanding global pet population and greater emphasis on preventive healthcare, veterinary software is poised to become a cornerstone of modern veterinary practice management.
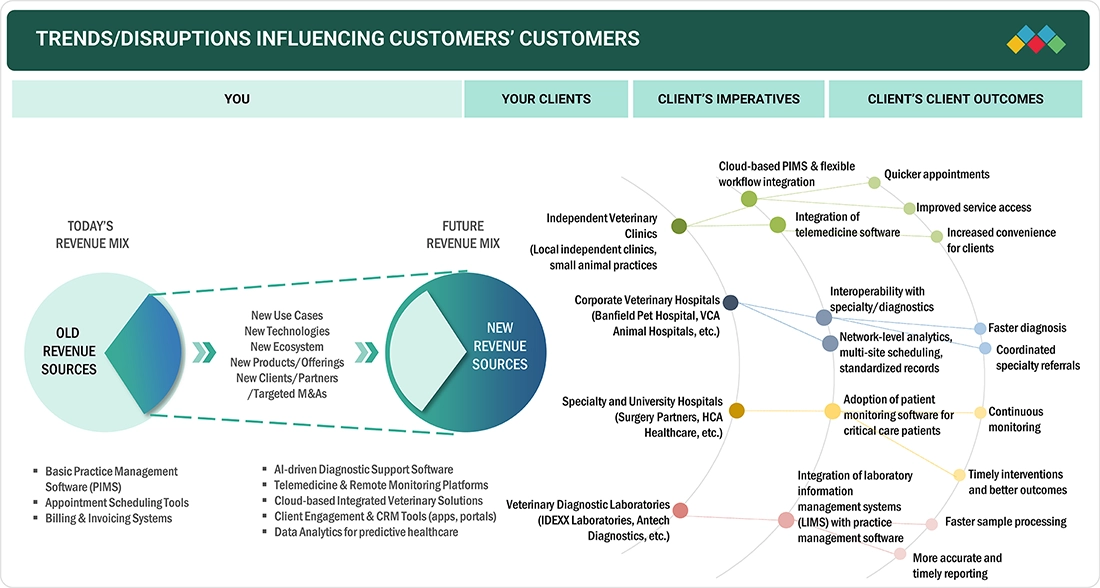
TRENDS & DISRUPTIONS IMPACTING CUSTOMERS' CUSTOMERS
The evolving landscape of the veterinary software market highlights key trends and disruptions that are reshaping revenue sources and impacting end-user dynamics. As industry transitions from systems to more technology-integrated solutions, new high-growth opportunities are emerging, particularly in cloud-based software and AI integration.
Source: Secondary Research, Interviews with Experts, MarketsandMarkets Analysis
MARKET DYNAMICS
Level
-
Growing focus on automation with PIMS integration

-
Rising pet ownership rates and increasing vet expenditure

Level
-
Budget sensitivity in small/independent practices

-
High switching & migration costs

Level
-
Retiring legacy systems to motivate users to adopt PMS/HER/OS platforms

-
Software cross-selling with veterinary diagnostics

Level
-
Increasing cybersecurity threats across veterinary software solutions

Source: Secondary Research, Interviews with Experts, MarketsandMarkets Analysis
Driver: Growing focus on automation with PIMS integration
The veterinary software market is experiencing robust growth due to the increasing demand for efficiency and automation in veterinary practices, particularly through integrated Practice Management Systems (PIMS). Modern PIMS solutions now integrate pharmacy, inventory, and billing modules, minimizing stockouts, preventing revenue leakage, and improving cash flow through automated reconciliation. Adoption has accelerated as clinics and hospital groups prioritize remote access, multi-location consolidation, interoperability with diagnostic partners, and SaaS-based subscription models that reduce IT complexity and costs. Leading players such as IDEXX have added AI-driven clinical decision support into their platforms (e.g., Neo, VetConnect PLUS, DecisionIQ), helping clinicians interpret lab results more effectively. DecisionIQ uses machine learning and proprietary diagnostic data to detect subtle patterns in results and suggest possible diagnoses or next steps, significantly reducing time to diagnosis.
Restraint: Budget sensitivity in small/independent practices
Despite the clear operational benefits, budget sensitivity remains a major barrier to veterinary software adoption, especially among small and mid-sized clinics. Monthly subscription fees for cloud-based PIMS typically range from USD 150 to USD 400, with extra charges for premium modules such as imaging integrations and advanced payment solutions. In addition, migration from legacy, on-premises systems to modern SaaS platforms can be costly and disruptive, involving data transfer risks, staff retraining, and temporary downtime. As a result, many clinics, particularly those with tight budgets or multiple locations, delay switching, even when current systems are outdated. This slows adoption of more advanced, integrated solutions and limits vendors’ ability to scale rapidly.
Opportunity: Retiring legacy systems to motivate users to adopt PMS/HER/OS platforms
A significant market opportunity lies in replacing outdated, on-premise or desktop-based practice management systems. Many clinics continue to rely on legacy software that is expensive to maintain, lacks interoperability with modern diagnostic and payment systems, and poses cybersecurity risks. As these drawbacks become increasingly apparent, clinics are motivated to invest in cloud-native, integrated PIMS/EHR platforms that offer automation, real-time analytics, and seamless integrations. Vendors that can deliver smooth migration pathways, regulatory compliance assurance, and robust customer support are well-positioned to capture this wave of system upgrades.
Challenge: Increasing cybersecurity threats across veterinary software solutions
With the digitization of veterinary workflows, including EMRs, diagnostics, telehealth, payments, and client communications, cybersecurity risks are increasing sharply. The American Veterinary Medical Association (AVMA) estimates that approximately 11,000 veterinary practices face cyberattacks annually, making cybersecurity one of the most pressing concerns for the industry. Smaller practices often lack dedicated IT staff and are particularly vulnerable to phishing, ransomware, and data exfiltration attacks. Breaches can result in direct costs (data recovery, legal liabilities, regulatory fines) and indirect impacts such as client distrust, operational downtime, and reputational damage.
Veterinary Software Market: COMMERCIAL USE CASES ACROSS INDUSTRIES
| COMPANY | USE CASE DESCRIPTION | BENEFITS |
|---|---|---|
 |
AI-enabled diagnostics, cloud-based practice management, integrated patient records, telemedicine | Enhanced diagnostic accuracy, rapid test turnaround, optimized clinical workflows, easier client communications, improved patient care |
 |
Telehealth platforms, client engagement solutions, virtual care services | Improved access to care, higher treatment compliance, streamlined client management, reduced workload for veterinary teams |
 |
Practice management software, prescription/e-commerce solutions, client retention tools | Simplified operations, boosted revenue, better compliance, integrated workflows, effective client communication |
 |
Digital imaging management software for veterinary hospitals | Fast image processing, remote diagnosis capabilities, enhanced reliability, reduced downtime |
 |
Flexible, customizable practice management solutions, digital treatment sheets, inventory management | Streamlined admin tasks, improved clinical documentation, data security, seamless cloud integration, scalable for different practice types |
Logos and trademarks shown above are the property of their respective owners. Their use here is for informational and illustrative purposes only.
MARKET ECOSYSTEM
The veterinary software market ecosystem comprises software developers, technology providers, veterinary practices, regulatory bodies, and end users. Software developers are central to the ecosystem and depend on technology providers for critical components. Veterinary practices are the primary users of these systems. They require solutions that ensure operational efficiency, accurate record-keeping, secure client communication, and streamlined clinical decision-making. Regulatory bodies and regional veterinary associations play a critical role by enforcing compliance standards. These regulations significantly influence software design, approval, and adoption timelines. End users also shape the market by driving demand for user-friendly, integrated, and outcome-focused software solutions.

Logos and trademarks shown above are the property of their respective owners. Their use here is for informational and illustrative purposes only.
MARKET SEGMENTS

Source: Secondary Research, Interviews with Experts, MarketsandMarkets Analysis
Veterinary Software Market, By Product
The veterinary practice management software segment held the largest share of the global market. This dominance is attributed to its extensive adoption by veterinary clinics and hospitals for managing electronic medical records (EMR), automating appointment scheduling, billing, inventory management, and streamlining overall workflows. PIMS has become the backbone of veterinary operations, offering seamless integration with diagnostic equipment, payment gateways, and client communication tools. These capabilities enhance efficiency and improve patient care and client satisfaction, making PIMS an essential software solution for most practices.
Veterinary Software Market, By Delivery Mode
Web/Cloud-based model is the largest and fastest-growing segment in the veterinary software market. This preference is driven by advantages such as reduced upfront IT infrastructure costs, automatic software updates, enhanced scalability, secure remote access to data, and improved business continuity. Cloud deployment is especially advantageous for multi-location practices, allowing them to seamlessly access centralized databases, standardize operations, and generate consolidated performance reports. The growing need for telehealth integration and remote practice management has further accelerated the shift to cloud models. By reducing IT maintenance burdens and enabling superior disaster recovery capabilities, cloud-based solutions are increasingly becoming the default choice for veterinary practices of all sizes, from single-location clinics to corporate veterinary groups.
Veterinary Software Market, By Practice Type
The exclusive small animal practices segment holds the largest share in the veterinary software market by practice type, due to the growing companion animal population worldwide, increasing expenditure on pet health and wellness, and rising adoption of preventive care services such as vaccinations, routine check-ups, and chronic disease management. Additionally, small animal practices are more likely to adopt digital tools such as PIMS and telehealth platforms to streamline operations and improve customer experience.
Veterinary Software Market, By End User
The independent veterinary clinics segment represents the largest share of the veterinary software market in 2024 due to the large number of small and mid-sized practices globally and their increasing shift toward digitization to enhance operational efficiency and improve client experience. Independent clinics are adopting PIMS, imaging software, and cloud-based platforms to streamline scheduling, optimize inventory, and provide better communication with pet owners through email/SMS reminders. The adoption is further supported by competitive pricing models (subscription-based SaaS) that make software accessible even to smaller clinics.
REGION
Asia Pacific to be fastest-growing region in global veterinary software market during forecast period
The Asia Pacific is expected to grow at the highest CAGR globally during the forecast period. This growth is primarily driven by a combination of rising pet ownership, growing awareness of animal health, and rapid digital transformation in veterinary practices. China, India, Japan, and Australia are witnessing increased demand for advanced practice management solutions as the number of companion animals and veterinary professionals expands. Government initiatives to strengthen animal healthcare infrastructure, coupled with rising expenditure on pet insurance and preventive care, are further boosting adoption. Additionally, the surge in cloud-based technologies, telehealth platforms, and mobile-enabled veterinary solutions is accelerating market penetration, particularly among small and mid-sized clinics seeking cost-effective and scalable systems.

Veterinary Software Market: COMPANY EVALUATION MATRIX
In the veterinary software market, IDEXX Laboratories, Inc. (Star) leads with scale, extensive distribution, and a broad solutions portfolio. Antech Diagnostics, Inc. (Emerging Leader) is gaining momentum with innovative Digital imaging management software technologies. While IDEXX Laboratories, Inc. dominates through reach, innovation positions Antech Diagnostics for rapid growth toward the leaders’ quadrant.

Source: Secondary Research, Interviews with Experts, MarketsandMarkets Analysis
KEY MARKET PLAYERS
- • IDEXX Laboratories,Inc. (US)
- • Covetrus (US)
- • Nordhealth (Finland)
- • Carestream Health (US)
- • Cencora Inc(US)
- • DaySmart Software (US)
- • Animal Intelligence Software (US)
- • Chetu, Inc (US)
- • Antech Diagnostics, Inc. (US)
- • OR Technology- Oehm and Rehbein GmbH (Germany)
- • Business Infusions (Canada)
- • Asteris (Valsoft Corporation) (Canada)
- • Clientrax (US)
- • Shepherd Veterinary Solutions (US)
- • Advanced Technology Corp. (US)
MARKET SCOPE
| REPORT METRIC | DETAILS |
|---|---|
| Market Size Value in 2024 (Value) | USD 1,440.68 MN |
| Market Forecast in 2030 (Value) | USD 2,143.08 MN |
| Growth Rate | 6.9% |
| Years Considered | 2023–2030 |
| Base Year | 2024 |
| Forecast Period | 2025–2030 |
| Units Considered | Value (USD million/Million) |
| Report Coverage | Revenue forecast, company ranking, competitive landscape, growth factors, and trends |
| Segments Covered | By Product: Veterinary Practice Management Software, Veterinary PACS, Veterinary LIMS, Client Engagement Software, Veterinary Telehealth Software, Livestock Farm Management Software, and Other Software |
| Regions Covered | North America, Asia Pacific, Europe, Latin America, and the Middle East & Africa |
WHAT IS IN IT FOR YOU: Veterinary Software Market REPORT CONTENT GUIDE

DELIVERED CUSTOMIZATIONS
We have successfully delivered the following deep-dive customizations:
| CLIENT REQUEST | CUSTOMIZATION DELIVERED | VALUE ADDS |
|---|---|---|
| Product Analysis | Comparison of top software products: Veterinary Patient Management Software, Veterinary PACS, Veterinary Telehealth Software, Client Engagement Software, Livestock Farm Management Software, Veterinary LIMS, and Other Software | Identify interconnections, detect customer migration trends across industries |
| Company Information | Key Players: IDEXX Laboratories, Inc. (US), Covetrus (US), Cencora Inc. (US), Nordhealth (Finland), Carestream Health (US) | Insights on revenue shifts toward emerging software technologies |
| Geographic Analysis | A detailed analysis of the Rest of Asia Pacific was provided to one of the top players. Client focused on ASEAN Market country-level analysis for the device market. | Country-level demand mapping for new product launches and localization strategy planning |
RECENT DEVELOPMENTS
- July 2025 : MWI Animal Health (MWI), part of Cencora, launched Furscription, a digital tool intended to help veterinarians and clinic staff?streamline the prescription process. A secure, user-friendly software solution, Furscription offers veterinarians access to an electronic prescription management platform to improve and simplify the prescribing experience and support efficient access to prescription records.
- February 2024 : IDEXX Laboratories, Inc. announced the launch of Vello, a software solution that seamlessly connects veterinary practices and clients through modern, digital tools. As the only pet owner engagement solution purpose-built for IDEXX practice management software, Vello enables veterinary practices using ezyVet, Neo, and Cornerstone software to communicate efficiently with pet owners in a single, easy-to-use system.
- September 2022 : Chetu, a leading provider of world-class software development and support services, announced the opening of its latest software delivery center in Brandon, Florida. The new office, located just outside of the Tampa Bay area, will allow the company to better serve its West Coast Florida clients and meet the software development needs of the growing tech scene in the region.
- March 2022 : First Graphene signed an agreement with global construction chemicals manufacturer Fosroc, Inc. to develop PureGRAPH graphene-enhanced cement additives or grinding aids. The agreement is a key step in First Graphene’s strategy to help the cement and concrete industries, responsible for up to 8% of global carbon dioxide emissions, achieve a 25% emissions reduction by 2030.
- January 2022 : Covetrus announced that NewDay Veterinary Care at Pet Paradise has adopted Pulse, its cloud-based veterinary operating system (vOS), across 30 clinics in the US. The all-in-one integrated system will streamline clinic management, enabling veterinary staff to dedicate more time to patient care.
Table of Contents
 Exclusive indicates content/data unique to MarketsandMarkets and not available with any competitors.
Methodology
This study extensively used both primary and secondary sources. The research involved studying various factors affecting the industry to identify segmentation types, industry trends, key players, competitive landscape, key market dynamics, and key player strategies.
Secondary Research
This research study involved the usage of comprehensive secondary sources, directories, databases such as Bloomberg Business, Factiva, and Dun & Bradstreet, white papers, annual reports, company house documents, investor presentations, and SEC filings of companies. Secondary research was used to identify and collect information useful for an extensive, technical, market-oriented, and commercial study of the infusion pump market. It was also used to identify key players in the market and classify and segment the industry based on trends to the most detailed level. Additionally, significant developments related to market and technology perspectives were noted. A database of the primary industry leaders was also created using secondary research.
Primary Research
In the primary research process, various sources from both the supply and demand sides were interviewed to obtain qualitative and quantitative information for this report. Primary sources from the supply side include project/sales/marketing/business development managers, presidents, CEOs, vice presidents, chairpersons, chief operating officers, chief strategy officers, directors, chief information officers, and chief medical information officers related to the veterinary software market. Primary sources from the demand side include healthcare professionals from veterinary hospitals, veterinary clinics, and veterinary diagnostic centers.
A breakdown of the primary respondents is provided below:

Note 1: C-level executives include CEOs, COOs, CTOs, and VPs.
Note 2: Other designations include sales, marketing, and product managers.
Note 3: Tiers are defined based on a company’s total revenue. As of 2024: Tier 1 = >USD 1 billion, Tier 2 = USD 500 million to USD 1 billion, and Tier 3 = < USD 500 million.
To know about the assumptions considered for the study, download the pdf brochure
Market Size Estimation
The total size of the veterinary software market was determined after data triangulation from three approaches, as mentioned below. After each approach, the weighted average of the three approaches was taken based on the level of assumptions used in each approach.

Data Triangulation
After arriving at the market size, the total market was divided into several segments and subsegments. Data triangulation and market breakdown procedures were employed wherever applicable to complete the overall market engineering process and arrive at the exact statistics for all segments and subsegments.
Market Definition
Veterinary software comprises specialized computer programs intentionally developed to optimize and augment diverse facets of veterinary practice administration and healthcare delivery. These comprehensive digital solutions integrate patient records management, appointment scheduling, billing, inventory administration, diagnostic imaging, telemedicine capabilities, and laboratory information systems with the overarching goal of enhancing operational effectiveness, data-driven decision-making, and superior animal healthcare provision in veterinary clinics, hospitals, and diagnostic laboratories.
Stakeholders
- Software Development Companies
- Veterinary Healthcare Institutions (Hospitals & Outpatient Clinics)
- Distributors and Suppliers of Veterinary software
- Research Institutes
- Health Insurance Payers
- Venture capitalists
- Market Research and Consulting Firms
- World Organization for Animal Health
- Organization for Economic Co-operation and Development (OECD)
Report Objectives
- To define, describe, and forecast the veterinary software market based on product, delivery mode, software type, practice type, end user, and region
- To provide detailed information regarding the major factors influencing market growth (such as drivers, restraints, opportunities, and challenges)
- To strategically analyze the micromarkets with respect to individual growth trends, prospects, and contributions to the total veterinary software market
- To analyze the opportunities in the market for stakeholders and provide details of the competitive landscape for market leaders
- To profile the key market players and comprehensively analyze their market shares and core competencies.
- To forecast the revenue of the market segments with respect to five main regions, namely, North America (US and Canada), Europe (Germany, France, UK, Italy, Spain, Netherlands, and Rest of Europe), the Asia Pacific (China, Japan, India, South Korea, New Zealand, Australia, Thailand, Vietnam, Indonesia and Rest of Asia Pacific), Latin America (Brazil, Mexico, and Rest of Latin America), and the Middle East & Africa [GCC Countries (Kingdom of Saudi Arabia, United Arab Emirates, and Rest Of GCC Countries) and Rest of Middle East & Africa
- To track and analyze competitive developments such as product launches & approvals, agreements, partnerships, expansions, acquisitions, and collaborations in the veterinary software market
Need a Tailored Report?
Customize this report to your needs
Get 10% FREE Customization
Customize This ReportPersonalize This Research
- Triangulate with your Own Data
- Get Data as per your Format and Definition
- Gain a Deeper Dive on a Specific Application, Geography, Customer or Competitor
- Any level of Personalization
Let Us Help You
- What are the Known and Unknown Adjacencies Impacting the Veterinary Software Market
- What will your New Revenue Sources be?
- Who will be your Top Customer; what will make them switch?
- Defend your Market Share or Win Competitors
- Get a Scorecard for Target Partners

Custom Market Research Services
We Will Customise The Research For You, In Case The Report Listed Above Does Not Meet With Your Requirements
Get 10% Free Customisation


Growth opportunities and latent adjacency in Veterinary Software Market