
Fluid Management Systems Market Size, Growth, Share & Trends Analysis

Fluid Management Systems Market by Product Type )Systems (Standalone and Integrated Fluid Management Systems), Accessories), Application (Gastroenterology, General Surgery), End User, Key Stakeholder, Buying Criteria & Unmet Needs - Global Forecast to 2030


OVERVIEW
Source: Secondary Research, Interviews with Experts, MarketsandMarkets Analysis
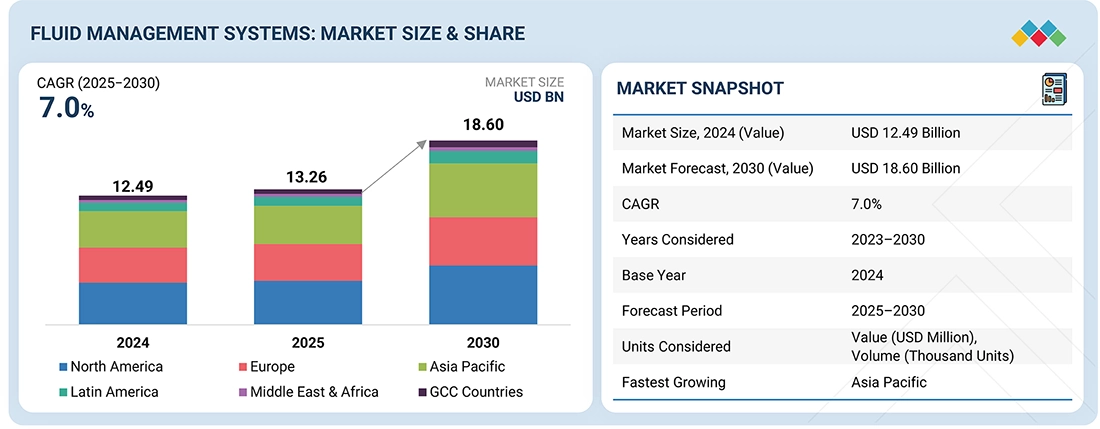
The fluid management systems market is projected to reach USD 18.60 billion by 2030 from USD 13.26 billion in 2025, at a CAGR of 7.0% during the forecast period. The market is primarily driven by the rising prevalence of kidney disorders and urological complications and the growing adoption of minimally invasive surgeries. Increasing healthcare expenditures, technological advancements in suction-irrigation systems, and demand for infection control solutions further accelerate market growth. However, high equipment costs and limited awareness in developing economies act as restraints. On the other hand, emerging markets and digital innovations in surgical fluid management present substantial opportunities for future expansion.
KEY TAKEAWAYS
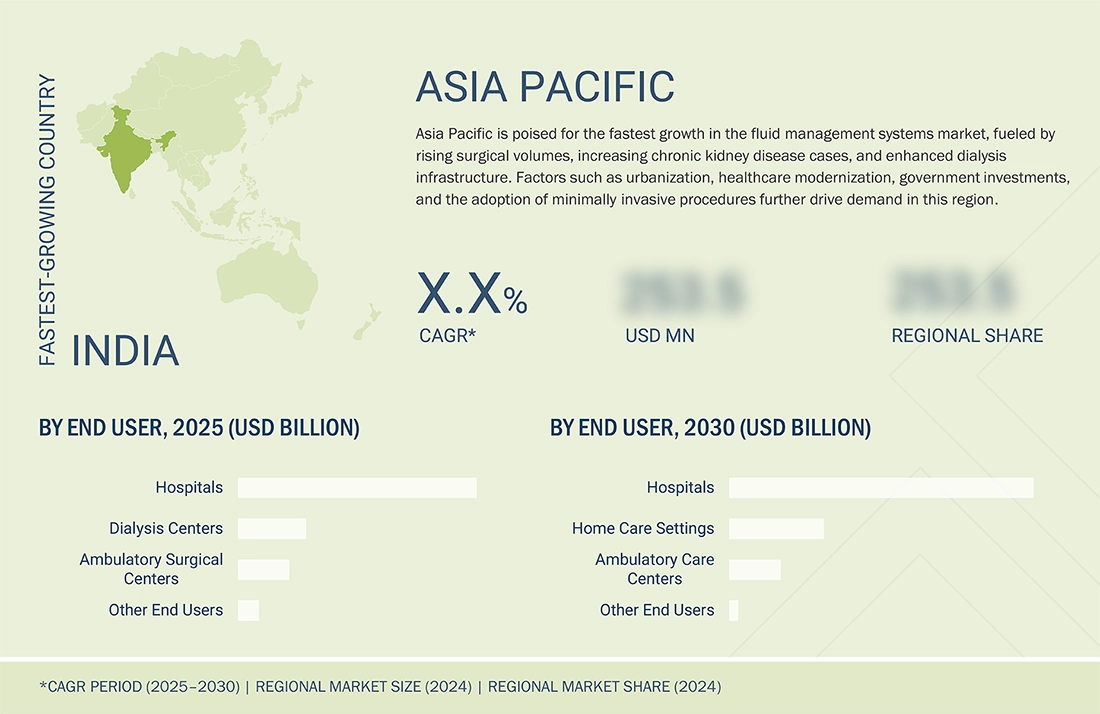
- Asia Pacific is expected to register the highest CAGR of 8.5%.
- By Product, systems segment dominated the market, with a share of 55.0% in 2024
- By Application, Urology and Nephrology segment dominated the market, with a share of 31.0% in 2024
- By End User, hospitals will be the fastest-growing segment in the forecast period.
- Fresenius Medical Care, Cardinal Health, and Olympus Corporation were identified as Star players in the plant-based supplements market, as they have focused on innovation and have broad industry coverage and strong operational & financial strength.
- Acteon Medical, Serenno Medical, and DeRoyal Indutries have distinguished themselves among startups and SMEs due to their strong product portfolio and business strategy
The fluid management systems market is driven by rising demand for precision devices, increasing chronic diseases, and automation adoption for efficiency. Regulatory compliance and high equipment costs act as key restraints, limiting smaller manufacturers. However, opportunities lie in advanced technologies like AI, robotics, and additive manufacturing, enabling faster production, customization, and innovation in complex devices, ensuring long-term growth and competitiveness for equipment providers serving global management system manufacturers.
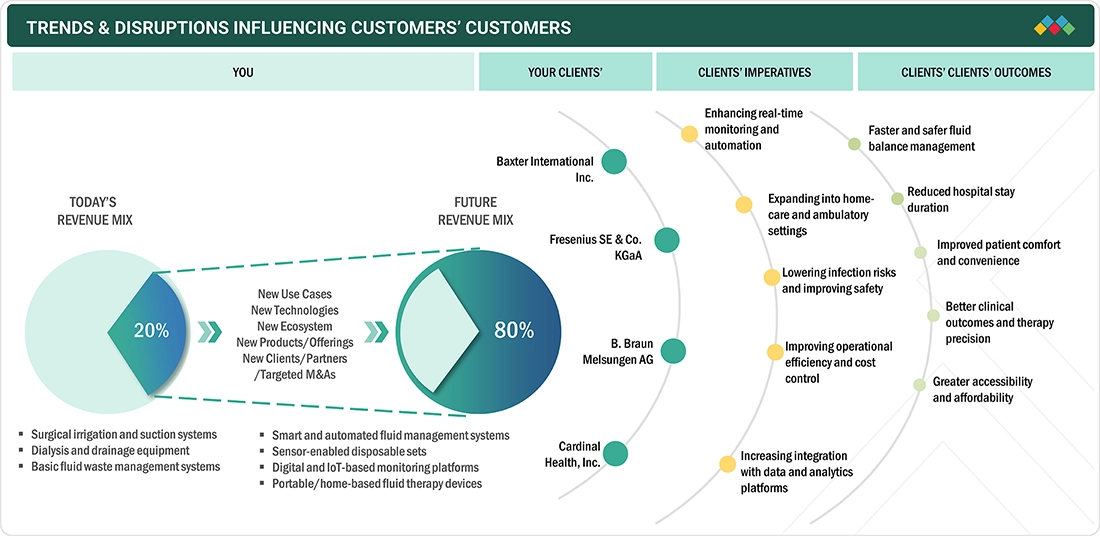
TRENDS & DISRUPTIONS IMPACTING CUSTOMERS' CUSTOMERS
The fluid management systems market is undergoing rapid transformation, driven by increasing surgical volumes, the growing adoption of minimally invasive procedures, and technological advancements aimed at improving patient safety and surgical efficiency. Conventional standalone systems are now being complemented or replaced by integrated platforms, smart disposables, and devices with advanced fluid monitoring capabilities. Emerging opportunities include AI-enabled systems for predictive fluid loss management, automated waste fluid disposal, and cloud-connected devices that streamline data capture for surgical records. These innovations improve precision, reduce infection risks, and enhance workflow efficiency across diverse surgical specialties. End users, including hospitals, ambulatory surgical centers, and dialysis centers, are increasingly seeking connected, interoperable, and scalable solutions that can reduce operating room time, optimize resource utilization, and ensure regulatory compliance. This shift is encouraging manufacturers to invest in automation, digitalization, and smart, environmentally sustainable fluid management solutions to remain competitive.
Source: Secondary Research, Interviews with Experts, MarketsandMarkets Analysis
MARKET DYNAMICS
Level
-
Rise in number of minimally invasive surgeries

-
Increasing ESRD patient base

Level
-
High cost of endosurgical procedures

-
Lack of consumer awareness

Level
-
Untapped potential in emerging markets

-
Single-use disposable devices and accessories

Level
-
Dearth of surgeons worldwide

Source: Secondary Research, Interviews with Experts, MarketsandMarkets Analysis
Driver: Rising number of minimally invasive surgeries
Minimally invasive surgeries (MIS) are driving significant growth in the fluid management systems market due to their rising adoption worldwide. MIS offers shorter recovery times, reduced infection risks, and supports outpatient care, fueling demand for advanced fluid management technologies such as insufflators, suction/irrigation units, and fluid warming systems. Inpatient and ambulatory MIS volumes continue to expand globally, reinforcing the need for precise fluid balance and patient safety. This increasing reliance on MIS directly enhances market potential for fluid management systems across surgical care settings.
Restraint: High cost of endosurgical procedures
High and unpredictable costs of endosurgical procedures significantly limit the adoption of fluid management systems. In the US, procedure reimbursements vary widely, with average costs ranging from USD 713 to USD 6,000 per encounter (Medicare, 2024; Medical News Today, 2023). NHS tariffs restrict capital and consumable spending, while US and EU systems face aggregate budgetary impacts from consumables (CDC, 2023; AHRQ, 2021). In LMICs, constrained budgets and costly surgical approaches perpetuate access gaps, restricting wider usage of advanced FMS technologies (WHO, 2024).
Opportunity: Untapped potential in emerging markets
Emerging markets present untapped growth potential due to low baseline capacity in surgical and renal care. WHO (2024) estimates 143 million additional procedures are required globally, highlighting demand for irrigation, suction, and fluid warming systems. Kidney disease burden in LMICs further increases the need for dialysis consumables and sterile fluid kits (ISN, 2023). Rising per-capita health expenditure (USD 296 in 2022 vs. USD 93.5 in low-income economies) and OECD’s surgical migration trends position Asia, Africa, and Latin America as strong growth frontiers.
Challenge: Shortage of surgeons
A global shortage of surgeons constrains the adoption of fluid management systems. In the US, surgical resident numbers rose 37% since 2007, yet practicing surgeons grew only 10%, underscoring workforce imbalance (ACS, 2025). Globally, LMICs face acute shortages, with 70% of the world’s population lacking access to safe surgery. By 2030, Africa alone will face a deficit of 5.6 million surgical care providers (Operation Smile, 2025; The EastAfrican, 2025). These shortages restrict procedural volumes, limiting deployment of fluid management systems.
Fluid Management Systems Market: COMMERCIAL USE CASES ACROSS INDUSTRIES
| COMPANY | USE CASE DESCRIPTION | BENEFITS |
|---|---|---|
 |
Integrated fluid management systems used in surgical procedures, combining suction, irrigation, and fluid collection functions for minimally invasive surgeries | Improve surgical efficiency, reduce procedure time, minimize cross-contamination risk, and ensure precise control of fluid balance during operations |
 |
Fluid waste management systems for hospitals and surgical centers, designed for closed, automated collection and disposal of surgical waste fluids | Enhance safety by reducing staff exposure to biohazards, lower hospital-acquired infection risks, ensure regulatory compliance, and improve workflow efficiency |
 |
Endoscopic irrigation and suction systems tailored for gastroenterology, urology, and laparoscopy procedures | Maintain clear visualization, reduce procedural complications, improve diagnostic accuracy, and enhance surgeon efficiency during minimally invasive interventions |
 |
Fluid warming systems used in operating rooms, ICUs, and emergency care to deliver warmed IV fluids or blood products to patients | Prevent perioperative hypothermia, improve patient outcomes, reduce infection risks, and support faster recovery in surgical and critical care settings |
 |
Insufflation and distention systems for laparoscopy and gynecology procedures, ensuring safe and controlled cavity expansion with fluid or gas | Enhance surgical visualization, reduce risk of organ injury, support minimally invasive approaches, and improve procedural outcomes |
Logos and trademarks shown above are the property of their respective owners. Their use here is for informational and illustrative purposes only.
MARKET ECOSYSTEM
The fluid management systems market operates within a tightly integrated ecosystem connecting component suppliers, pump and sensor manufacturers, software vendors, sterile consumable producers, contract assemblers, distributors, health systems, and procedure-intensive end users across surgical, dialysis, and critical care settings. Collaboration among medical device firms, hospital engineering teams, and interoperability standards bodies enables reliable integration with OR equipment, dialysis machines, EMRs, and patient monitoring platforms. Upstream, materials and microfluidics innovators drive advances in closed-loop control, leak detection, and infection prevention, while downstream, group purchasing organizations and logistics partners determine scale, pricing, and service coverage. Regulatory authorities and notified bodies shape cybersecurity, biocompatibility, and sterility benchmarks, and payers influence adoption through reimbursement for outcomes like blood conservation and fluid balance optimization. Continuous training, human-factors design, and remote service analytics sustain uptime and safety. Mapping this ecosystem reveals opportunities for interoperable software, single-use set standardization, and data-driven value demonstrations that reduce complications and total cost of care.
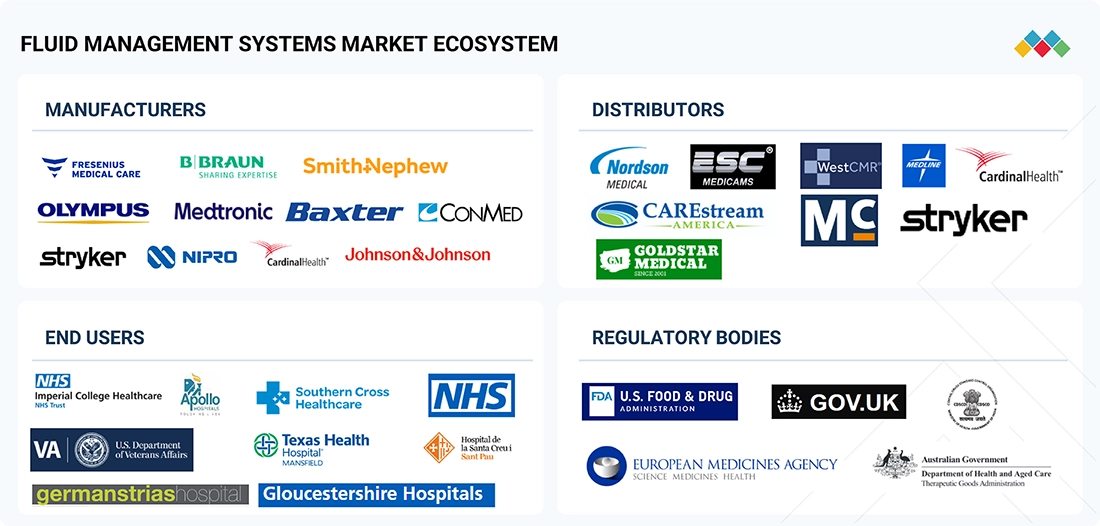
Logos and trademarks shown above are the property of their respective owners. Their use here is for informational and illustrative purposes only.
MARKET SEGMENTS
Source: Secondary Research, Interviews with Experts, MarketsandMarkets Analysis
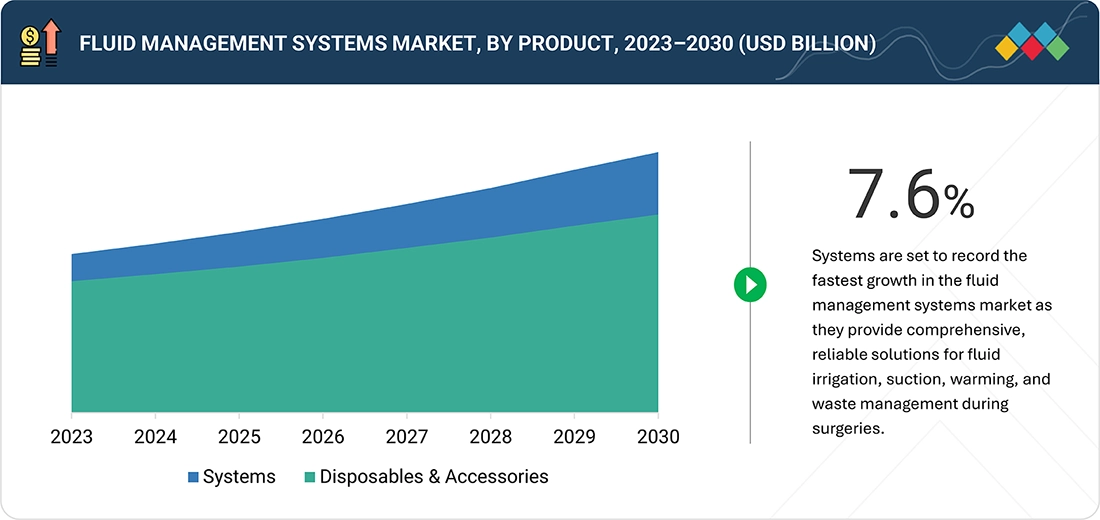
Fluid Management Systems Market, by Product
Products studied include fluid management systems and fluid management disposables & accessories. Systems are estimated to account for the largest market share in the fluid management systems market because they provide comprehensive, reliable solutions for fluid irrigation, suction, warming, and waste management during surgeries. Their high adoption in hospitals and surgical centers, coupled with technological advancements ensuring efficiency and patient safety, drives dominance over disposables and accessories in the market.
Fluid Management Systems Market, by Application
Applications include urology and nephrology, gastroenterology, general surgery, orthopedics, gynecology, cardiovascular surgery, neurosurgery, and ENT. Urology and nephrology are set to be the largest applications of the fluid management systems market due to the high prevalence of kidney disorders, rising dialysis demand, and increasing urological surgeries. Growing cases of chronic kidney disease (CKD), kidney stones, and prostate disorders drive the adoption of dialysis consumables, suction, and irrigation systems globally.
Fluid Management Systems Market, by End User
Ens users include hospitals, dialysis centers, and ambulatory surgical centers. Hospitals hold the largest market share in the Fluid Management Systems (FMS) market as they perform the majority of surgical and dialysis procedures, requiring advanced fluid control technologies. Their higher patient inflow, well-established infrastructure, and ability to invest in costly systems drive adoption, making hospitals the primary end users globally.
REGION
Asia Pacific to be fastest-growing region in global fluid management systems market during forecast period
Asia Pacific is projected to record the fastest growth in the fluid management systems market due to rising surgical volumes, increasing prevalence of chronic kidney disease, and expanding dialysis infrastructure. Rapid urbanization, healthcare modernization, and growing government investments in healthcare access further fuel demand. Additionally, large patient populations, improving affordability, and higher adoption of minimally invasive procedures position Asia Pacific as the fastest-growing regional market for advanced fluid management systems.
Fluid Management Systems Market: COMPANY EVALUATION MATRIX
Players in this category receive high scores for most evaluation criteria. They have strong and established product portfolios and a vast geographic presence. The key star player in the fluid management systems market is Fresenius Medical Care AG (Germany). Emerging leaders are vendors with substantial product innovations compared to their competitors. While they have broad product portfolios, they do not have a strong growth strategy for business development. The key emerging leader in the fluid management systems market is ICU Medical, Inc. (US).

Source: Secondary Research, Interviews with Experts, MarketsandMarkets Analysis
KEY MARKET PLAYERS
MARKET SCOPE
| REPORT METRIC | DETAILS |
|---|---|
| Market Size, 2024 (Value) | USD 12.49 Billion |
| Market Forecast, 2030 (Value) | USD 18.60 Billion |
| Growth Rate | 7.00% |
| Actual data | 2023–2030 |
| Base year | 2024 |
| Forecast period | 2025–2030 |
| Units considered | Value (USD Million), Volume (Thousand Units) |
| Report Coverage | Revenue forecast, company ranking, competitive landscape, growth factors, and trends |
| Segments Covered |
|
| Regional Scope | North America, Asia Pacific, Europe, Latin America, the Middle East & Africa |
WHAT IS IN IT FOR YOU: Fluid Management Systems Market REPORT CONTENT GUIDE
DELIVERED CUSTOMIZATIONS
We have successfully delivered the following deep-dive customizations:
| CLIENT REQUEST | CUSTOMIZATION DELIVERED | VALUE ADDS |
|---|---|---|
| Product Analysis | Comparison of fluid management systems: standalone systems (dialyzers, insufflators, suction & irrigation, fluid waste, fluid warming), integrated systems, and disposables & accessories (catheters, tubing sets, suction canisters, connectors) | Identify critical growth areas within product categories; highlight technology adoption and replacement trends across surgical and critical care settings |
| Company Information |
|
Insights into competitive landscape, global and regional market share, and strategic positioning for partnerships and distribution opportunities |
| Geographic Analysis |
|
Country-level demand mapping for surgical and hospital infrastructure investments; support localization and market entry strategies for new product launches |
RECENT DEVELOPMENTS
- June 2025 : Fresenius Medical Care received the US FDA 510(k) clearance for an upgraded 5008X CAREsystem, enabling the rollout of high-volume hemodiafiltration in US clinics. This development is expected to commence late 2025, with full commercialization slated for 2026.
- August 2025 : Fresenius acquired InterWell Health, a physician organization. This development aims to drive innovation in the kidney care portfolio market in the US.
- March 2025 : NIPRO acquired NxStage Medical, a leading provider of home hemodialysis & continuous renal replacement therapy (CRRT) systems. This acquisition expanded NIPRO’s portfolio of renal products & technologies, thus expanding its presence in the fluid management systems market
Table of Contents
 Exclusive indicates content/data unique to MarketsandMarkets and not available with any competitors.
Methodology
The study involved major activities in estimating the current size of the fluid management systems market. Exhaustive secondary research was done to collect information on the fluid management systems market. The next step was to validate these findings, assumptions, and sizes with industry experts across the value chain using primary research. Different approaches, such as top-down and bottom-up, were employed to estimate the total market size. After that, the market breakup and data triangulation procedures were used to estimate the market size of the segments and subsegments of the fluid management systems market.
Secondary Research
This research study involved the wide use of secondary sources, directories, databases such as Dun & Bradstreet, Bloomberg Businessweek, Factiva, whitepapers, and companies’ house documents. Secondary research was undertaken to identify and collect information for this extensive, technical, market-oriented, and commercial study of the fluid management systems market. It was also used to obtain important information about the top players, market classification, and segmentation according to industry trends to the bottom-most level, geographic markets, and key developments related to the market. A database of the key industry leaders was also prepared using secondary research.
Primary Research
In the primary research process, various supply- and demand-side sources were interviewed to obtain qualitative and quantitative information for this report. Primary sources from the supply side included industry experts such as CEOs, vice presidents, marketing and sales directors, technology & innovation directors, engineers, and related key executives from various companies and organizations operating in the fluid management systems market. Primary sources from the demand side included pediatric hospitals, maternity & birthing centers, clinics, researchers, lab technicians, purchase managers, and stakeholders in corporate & government bodies.
Breakdown of Primary Interviews

Note 1: C-level primaries include CEOs, COOs, and CTOs.
Note 2: Others include sales managers, marketing managers, and product managers.
Note 3: Companies are classified into tiers based on their total revenue. As of 2024: Tier 1=>USD 1 billion, Tier 2 = USD 500 million to USD 1 billion, Tier 3=< USD 500 million
To know about the assumptions considered for the study, download the pdf brochure
Market Size Estimation
Both top-down and bottom-up approaches were used to estimate and validate the total size of the fluid management systems market. These methods were also used extensively to estimate the size of various subsegments in the market. The research methodology used to estimate the market size includes the following:

Data Triangulation
When the market size was determined, the entire market was split into three segments. Data triangulation and market breakdown processes were used where necessary to complete the entire market engineering process and arrive at precise statistics for all segments.
Approach to derive the market size and estimate market growth.
Using secondary data from paid and unpaid sources, the market rankings for the major players were determined following a thorough analysis of their sales of fluid management systems. Due to data restrictions, the revenue share in certain cases was determined after a thorough analysis of the product portfolio of big corporations and their individual sales performance. This information was verified at each stage by in-depth interviews with professionals in the field.
Market Definition
Fluid management systems and accessories are used in surgical procedures to perform various functions, such as irrigating and suctioning irrigation fluid, fluid filtration, fluid warming, distention of the body cavity, and collecting and disposing of body fluids and waste.
Stakeholders
- Fluid management system and accessory manufacturers
- Fluid management system and accessory distributors
- Research and development (R&D) companies
- Medical device procurement agencies
- Government bodies/municipal corporations
- Business research and consulting service providers
- Venture capitalists
Report Objectives
- To describe, analyze, and forecast the fluid management systems market, by product, application, end user, and region
- To describe and forecast the fluid management systems market for key regions: North America, Europe, the Asia Pacific, Latin America, the Middle East & Africa, and GCC Countries
- To provide detailed information regarding drivers, restraints, opportunities, and challenges influencing the growth of the fluid management systems market
- To strategically analyze the ecosystem, regulations, patenting trend, value chain, Porter’s five forces, and prices pertaining to the market under study
- To strategically analyze micromarkets with respect to individual growth trends, prospects, and contributions to the overall market
- To analyze market opportunities for stakeholders and provide details of the competitive landscape for market players
- To profile key players and comprehensively analyze their market shares and core competencies in the fluid management systems market
- To analyze competitive developments such as collaborations, acquisitions, product launches, expansions, and R&D activities in the fluid management systems market
Key Questions Addressed by the Report
Which are the top industry players in the global fluid management systems market?
Prominent players include Fresenius Medical Care AG (Germany), Smith & Nephew Plc (UK), B. Braun SE (Germany), Stryker (US), Ecolab (US), CONMED Corporation (US), Cardinal Health (US), Olympus Corporation (Japan), ICU Medical (US), Zimmer Biomet Holdings, Inc. (US), Medtronic (Ireland), Hologic, Inc. (US), Johnson & Johnson (US), Baxter (Vantive) (US), and Nipro (Japan), among others.
Which segments have been included in this report?
The report includes product, application, end user, and region segments.
Which geographical region dominates the fluid management systems market?
North America dominated the fluid management systems market in 2024, with Europe, Asia Pacific, Latin America, the Middle East & Africa, and GCC countries also covered in the report.
Which is the leading product segment in the fluid management systems market?
The systems segment accounted for the largest share of the fluid management systems market by product.
What is the CAGR of the global fluid management systems market?
The global fluid management systems market is projected to grow at a CAGR of 7.0% from 2025 to 2030.
Need a Tailored Report?
Customize this report to your needs
Get 10% FREE Customization
Customize This ReportPersonalize This Research
- Triangulate with your Own Data
- Get Data as per your Format and Definition
- Gain a Deeper Dive on a Specific Application, Geography, Customer or Competitor
- Any level of Personalization
Let Us Help You
- What are the Known and Unknown Adjacencies Impacting the Fluid Management Systems Market
- What will your New Revenue Sources be?
- Who will be your Top Customer; what will make them switch?
- Defend your Market Share or Win Competitors
- Get a Scorecard for Target Partners

Custom Market Research Services
We Will Customise The Research For You, In Case The Report Listed Above Does Not Meet With Your Requirements
Get 10% Free CustomisationTESTIMONIALS

JAYANT RAJPUROHIT
Director of Market Insights, Data and Analytics
SFI Health,
Leading Pharmaceutical Companywww.sfihealth.com/

We at SFI Health approached MarketsandMarkets for an Opportunity Assessment on "Incidence and Prevalence of Focus Indications" as we wanted to know the most attractive HCPs like Physician, Functional MD, Naturopath and Pharmacist. The project was critical for us to ensure our focus on the right target which would enable sustainable growth and profitability for SFI Health. The business insights provided exceeded our expectations and we were extremely impressed. The team at MarketsandMarkets is highly professional and detail oriented and very well understood our business needs. MarketsandMarkets offers a unique combination of expertise and dedicated engagement model. We identified 2 new products to be launched in coming months, based on the research findings provided by MarketsandMarkets. We are happy with the services and would strongly recommend MarketsandMarkets to my peers in the industry.

BEATRIZ DE LA CALLE
Head of Commercial Analytics
Qualicaps,
Leading Pharmaceutical Companywww.qualicaps.com/

We partnered with MarketsandMarkets for an assessment study on hard empty capsules. The team was extremely professional in understanding our business requirements and we received timely responses to all our queries. The market intelligence and the recommendations has met our business requirements. We were extremely impressed to see the final study results; it really exceeded our expectations. The market intelligence offered by MarketsandMarkets, and clarity on next steps will help us achieve our business objective for the Year 2021. We are happy with the services and would strongly recommend MarketsandMarkets to my peers in the industry.

Bob Williams,
Senior Director Business Development & Innovation
Bracco Diagnostics Inc.,
Italian Multinational in life sciences sector and a World Leader in imaging diagnosticsimaging.bracco.com/us-en
We were pleased with targeted insights that MarketsandMarkets identified from a custom study on the 'Radiation Dose Management Solutions Market'. Your team identified and characterized the market participants as well as underlying trends accurately. This study was useful to Bracco in formulating business strategies for our dose monitoring product lines and we thank MarketsandMarkets for the job well done.
Cody Coonradt,
Market Development and Strategy Manager
3M Health Information Systems,
Leader in Health care Coding, Payment & Analytics Solutions.www.3m.com/3M/en_US/health-information-systems-us
The value for our organization comes from three things: depth of research, specificity of segments and being easy to work with. As important as the first two are, the third can't be underestimated. MarketsandMarkets, maybe more than any other research vendor, wants to know what is top of mind for our team and what big questions we are grappling to answer.
Their customer first approach and high value engagement model, have given us great analysis and excellent value for money
Growth opportunities and latent adjacency in Fluid Management Systems Market

Still Researching the
Fluid Management Systems Ecosystem?
See the competitors, opportunities, and growth signals shaping it - instantly.
Generate 15+ consulting-grade strategic insights tailored to your growth question.


Alfie
Oct, 2022
What are the growth estimates for the Fluid Management Systems Market by the year 2028?.
Theo
Oct, 2022
I want more detailed information on the geographical segmentation of the Fluid Management Systems Market.
William
Oct, 2022
Which of the segment holds the major share of the Fluid Management Systems Market?.