Motion Sensor Market by Motion Technology (IR, Ultrasonic, Microwave, Dual Technology, & Tomographic), Application (Consumer Electronics, Automotive, Aerospace & Defense, Healthcare, & Industrial), and Geography - Global Forecast to 2025-2031


The global motion sensor market was valued at USD 1.11 billion in 2023 and is estimated to reach USD 1.93 billion by 2031, at a CAGR of 7.2% between 2025 and 2031.
The growing adoption of automation and smart technologies across industrial, automotive, and consumer electronics sectors is a major driver for the motion sensor market. In industrial automation, motion sensor enable precision control, predictive maintenance, and safety in robotic and production systems. In the automotive sector, advanced driver-assistance systems (ADAS), autonomous driving features, and vehicle stability controls rely heavily on motion sensing technologies. Additionally, the increasing integration of motion sensor in smartphones, wearables, and gaming devices for enhanced user experience and energy efficiency is boosting market growth. The continuous miniaturization and performance improvements of MEMS-based motion sensor further accelerate adoption.

Rising demand for security and surveillance solutions is another significant factor propelling the motion sensor market. These sensors are vital in smart home systems, commercial buildings, and defense applications for intrusion detection and motion-based automation. The expansion of smart cities and connected infrastructure initiatives globally is fostering greater deployment of motion detection systems for energy management and public safety. Moreover, advancements in sensor fusion, IoT connectivity, and wireless communication technologies are enhancing motion sensor capabilities, enabling real-time data collection and analytics. The growing emphasis on energy-efficient, contactless, and intelligent sensing systems continues to create new market opportunities worldwide.
Market by Motion Technology
Dual Technology
The dual technology segment is projected to witness the highest CAGR in the motion sensor market, driven by its superior accuracy and reduced false alarm rates. Combining infrared and microwave sensing principles, dual technology sensors offer enhanced reliability for industrial automation, security, and smart building applications. Their ability to operate effectively in diverse environmental conditions makes them ideal for advanced motion detection systems, boosting adoption across residential, commercial, and industrial infrastructure globally.
Infrared Technology
Infrared technology holds the largest market share owing to its wide use in consumer electronics, smart homes, and security systems. These sensors detect motion through heat signatures, offering cost-effective and energy-efficient operation. Infrared motion sensor are extensively integrated into lighting automation, surveillance, and portable devices. Their simplicity, affordability, and compatibility with various IoT-enabled applications ensure their continued dominance in the motion sensor market, particularly in residential and commercial applications.
Market by Application
Industrial
The industrial segment is expected to record the highest CAGR due to the growing integration of motion sensor in robotics, machine automation, and predictive maintenance systems. Industries increasingly rely on motion sensing technologies to enhance safety, operational efficiency, and precision in automated equipment. With the rapid adoption of Industry 4.0 and IIoT ecosystems, motion sensor are becoming essential components in smart factories, driving their accelerated deployment across manufacturing and process industries.
Consumer Electronics
Consumer electronics represent the largest share of the motion sensor market, primarily due to their widespread integration in smartphones, gaming consoles, and wearable devices. Motion sensor enhance user interaction through gesture recognition, screen orientation, and activity tracking features. The constant innovation in MEMS technology and miniaturization enables compact sensor integration in portable devices. Rising consumer demand for smart and connected gadgets continues to strengthen the dominance of this segment globally.
Market by Geography
Geographically, the motion sensor market is experiencing widespread adoption across North America, Europe, Asia Pacific, and the Middle East & Africa. The Asia Pacific region is poised to register the highest CAGR, driven by rapid industrialization, growing consumer electronics production, and expanding automotive manufacturing. Countries such as China, Japan, South Korea, and India are leading adopters of motion sensor in automation and smart device applications. Government initiatives supporting smart city development and local manufacturing expansion under “Make in India” and similar programs are further fueling regional market growth.
Market Dynamics
Driver: Growing Adoption of Automation in Industries and the Home
The increasing adoption of automation across industrial and residential environments is a key driver for the motion sensor market. In industries, motion sensor enhance process efficiency, equipment safety, and robotic precision. In smart homes, they enable intelligent lighting, energy management, and security systems. The growing preference for contactless operation and real-time monitoring is further accelerating demand, as motion sensor form the backbone of automated control systems across diverse applications.
Restraint: Demanding Cycle Time
One of the major restraints for the motion sensor market is the demanding cycle time required for sensor calibration, signal processing, and integration. High-speed applications, such as robotics and automotive systems, require ultra-fast response rates, which can challenge sensor performance and system synchronization. The need for real-time accuracy often increases design complexity and production costs, limiting widespread deployment in cost-sensitive applications and creating barriers for smaller manufacturers entering the market.
Opportunity: Growing Demand for Wearable Electronics
The expanding wearable electronics market presents a significant growth opportunity for motion sensor. Fitness bands, smartwatches, and health-monitoring devices rely heavily on accelerometers and gyroscopes for activity tracking, gesture recognition, and biometric monitoring. Advancements in MEMS miniaturization and ultra-low-power sensor designs have made integration into compact devices more feasible. As consumers increasingly adopt health-focused and connected wearables, motion sensor manufacturers are poised to benefit from surging demand across the global consumer electronics landscape.
Challenge: Return on Investment
A key challenge in the motion sensor market lies in achieving a favorable return on investment, particularly for large-scale industrial and automation projects. While motion sensor enhance productivity and safety, the initial setup, calibration, and maintenance costs can be substantial. Companies often face long payback periods before realizing tangible benefits, especially in industries with budget constraints. Ensuring long-term cost efficiency, scalability, and compatibility with existing infrastructure remains essential for improving ROI and sustaining adoption.
Future Outlook
Between 2023 and 2031, the motion sensor market is projected to experience significant expansion driven by advancements in automation, IoT integration, and smart device adoption. Motion sensor will increasingly power intelligent systems across industrial, automotive, and consumer applications, enabling enhanced safety, precision, and energy efficiency. The proliferation of autonomous vehicles, smart homes, and Industry 4.0 initiatives will further accelerate demand. Additionally, miniaturized MEMS-based sensors and AI-enabled motion detection technologies will open new avenues for innovation. As industries and consumers shift toward connected, data-driven ecosystems, motion sensor will become essential components for enabling intelligent interaction, automation, and real-time analytics across multiple sectors worldwide.
Key Market Players
Top motion sensor companies Analog Devices Inc (US), NXP Semiconductor NV (Netherlands), STMicroelectronics NV (Switzerland), TE Connectivity Ltd (Switzerland), and Panasonic Corporation (Japan).
Key Questions addressed in this report:
- What are the global trends in demand for the market?
- What are the upcoming technologies/product areas that will have a significant impact on the market in the future?
- What will be the revenue pockets for the market players in the next 6 years?
- What are the prime strategies followed by key players in the market?
 Exclusive indicates content/data unique to MarketsandMarkets and not available with any competitors.
Table of Contents
1 Introduction
1.1 Study Objectives
1.2 Market Definition
1.3 Scope Of The Study
1.3.1 Markets Covered
1.3.2 Geographic Scope
1.3.3 Years Considered For The Study
1.4 Currency
1.5 Limitations
1.6 Stakeholders
2 Research Methodology
2.1 Introduction
2.1.1 Secondary And Primary Research
2.1.1.1 Key Industry Insights
2.1.2 Secondary Data
2.1.2.1 List Of Major Secondary Sources
2.1.2.2 Key Data From Secondary Sources
2.1.3 Primary Data
2.1.3.1 Primary Interviews With Experts
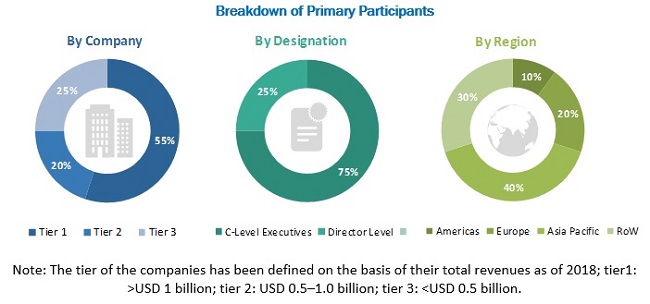
2.1.3.2 Breakdown Of Primaries
2.1.3.3 Key Data From Primary Sources
2.2 Market Size Estimation
2.2.1 Bottom-Up Approach
2.2.2 Top-Down Approach
2.3 Market Breakdown And Data Triangulation
2.4 Research Assumptions
3 Executive Summary
4 Premium Insights
4.1 Attractive Opportunities In Motion Sensor Market
4.2 Motion Sensor Market, By Motion Technology
4.3 Motion Sensor Market, By Embedded Sensor
4.4 Motion Sensor Market, By Function
4.5 Motion Sensor Market, By Application
4.6 Motion Sensor Market, By Geography
5 Market Overview
5.1 Introduction
5.2 Market Dynamics
5.2.1 Drivers
5.2.1.1 Growing Demand Of Smartphones, Tablets, And Notebooks
5.2.1.2 Advancement In Micro-Electro-Mechanical Systems (Mems)
5.2.1.3 Rapidly Growing Interactive Motion Gaming Industry
5.2.2 Restraints
5.2.2.1 Availability Of Alternatives In Low Cost
5.2.2.2 Limitations Of Accelerometer
5.2.3 Opportunities
5.2.3.1 Growing Application In Consumer Electronic Industry
5.2.4 Challenges
5.2.4.1 Technological Concerns
5.3 Value Chain Analysis
5.4 Porter’s Five Forces Analysis
5.4.1 Intensity Of Competitive Rivalry
5.4.2 Threat Of Substitutes
5.4.3 Bargaining Power Of Buyers
5.4.4 Bargaining Power Of Suppliers
5.4.5 Threat Of New Entrants
6 Motion Sensor Market, By Motion Technology
6.1 Introduction
6.2 Active
6.2.1 Ultrasonic Sensor
6.2.2 Microwave Sensor
6.2.3 Tomographic Sensor
6.3 Passive
6.3.1 Infrared Motion Sensor
6.3.2 Dual Or Hybrid Technology
6.4 Other Motion Sensor Technology (Temperature, Vibration, Area Reflective And Others)
7 Motion Sensor Market, By Embedded Sensor
7.1 Mems Accelerometer
7.2 Mems Gyroscope
7.3 Mems Magnetometer
7.4 Sensor Combos
8 Motion Sensor Market, By Function
8.1 Fully−Automatic
8.2 Semi−Automatic
9 Motion Sensor Market, By Application
9.1 Introduction
9.2 Consumer Electronics
9.2.1 Smartphones
9.2.2 Tablets
9.2.3 Gaming Consoles
9.2.4 Gaming Ar & Vr Applications
9.2.5 Wearable Devices
9.2.6 Others
9.3 Automotive Application
9.3.1 Airbag Deployment System
9.3.2 Advanced Driver Assistance System (Adas)
9.3.3 Suspension & Levelling
9.3.4 Vibration Monitoring
9.3.5 Electronic Stability Control
9.4 Industrial Application
9.4.1 Fire Alarms & Smoke Detectors
9.4.2 Lighting Controls (Outdoor/Indoor)
9.4.3 Service Robotics
9.4.4 Automation (Doors, Elevators, Lighting, And Others)
9.4.5 Others (Lane Assistance, Access & Parking)
9.5 Healthcare
9.5.1 Fall Detection
9.5.2 Wellness And Fitness Tracking
9.5.3 Clinical Monitoring
9.5.4 Others
9.6 Commercial
9.6.1 Automation (Doors, Lighting, Elevators And Others)
9.6.2 Security & Surveillance
9.6.3 Others (Lane Assistance, Access & Parking)
9.7 Residential
9.7.1 Security & Surveillance
9.7.2 Home Automation
9.7.3 Safety
9.7.4 Hvac
9.8 Aerospace & Defense
9.9 Others
10 Geographic Analysis
10.1 Introduction
10.2 North America
10.2.1 Us
10.2.2 Canada
10.2.3 Mexico
10.3 Europe
10.3.1 Germany
10.3.2 Uk
10.3.3 France
10.3.4 Russia
10.3.5 Rest Of Europe
10.4 Asia Pacific
10.4.1 China
10.4.2 India
10.4.3 Japan
10.4.4 South Korea
10.4.5 Rest Of Asia Pacific
10.5 Rest Of The World
10.5.1 South America
10.5.2 Middle East And Africa
11 Competitve Landscape
11.1 Market Ranking Analysis: Motion Sensor Market
11.2 Competitive Leadership Mapping
11.2.1 Visionary Leaders
11.2.2 Dynamic Differentiators
11.2.3 Innovators
11.2.4 Emerging Companies
11.3 Competitive Benchmarking
11.3.1 Strength Of Product Portfolio (25 Companies)
11.3.2 Business Strategy Excellence (25) Companies
11.4 Competitive Scenario
11.4.1 Expansions
11.4.2 Product Launches And Developments
11.4.3 Acquisitions
11.4.4 Partnerships, Collaborations, Alliances, And Joint Ventures
12 Company Profiles
12.1 Key Players
12.1.1 Stmicroelectronics
12.1.2 Murata Manufacturing Co. Ltd.
12.1.3 Honeywell International, Inc.
12.1.4 Freescale Semiconductor, Ltd.
12.1.5 Analog Devices, Inc
12.1.6 Microchip Technology, Inc.
12.1.7 Invensense, Inc.
12.1.8 Bosch Sensortec Gmbh
12.1.9 Memsic Inc.
12.1.10 Kionix Inc.
12.2 Other Key Players
12.2.1 Panasonic
12.2.2 NXP
12.2.3 Colibrys SA
12.2.4 Sensinova
12.2.5 Fibar Group S.A.
12.2.6 Vernier Software & Technology, Llc.
12.2.7 Climax Technology Co., Ltd.
12.2.8 Adt
12.2.9 Theben
12.2.10 D-Link
13 Appendix
13.1 Insights Of Industry Experts
13.2 Knowledge Store: Marketsandmarkets’ Subscription Portal
13.3 Available Customizations
13.4 Related Reports
13.5 Author Details
Note1: This TOC Is Tentative And Is Subject To Change As The Study Progresses.
List Of Tables (108 Tables)
Table 1 Porter’s Five Forces Analysis With Their Weightage Impact
Table 2 Motion Sensor Market, By Motion Technology, 2016–2025 (USD Million)
Table 3 Motion Sensor Market, By Motion Technology, 2016–2025 (Million Units)
Table 4 Motion Sensor Market For Infrared, By Embedded Sensor, 2016–2025 (USD Million)
Table 5 Motion Sensor Market For Infrared, By Application, 2016–2025 (USD Million)
Table 6 Motion Sensor Market For Infrared, By Region, 2016–2025 (USD Million)
Table 7 Motion Sensor Market For Infrared, By Function, 2016–2025 (USD Million)
Table 8 Motion Sensor Market For Ultrasonic, By Embedded Sensor, 2016–2025 (USD Million)
Table 9 Motion Sensor Market For Ultrasonic, By Application, 2016–2025 (USD Million)
Table 10 Motion Sensor Market For Ultrasonic, By Region, 2016–2025 (USD Million)
Table 11 Motion Sensor Market For Ultrasonic, By Function, 2016–2025 (USD Million)
Table 12 Motion Sensor Market For Microwave, By Embedded Sensor, 2016–2025 (USD Million)
Table 13 Motion Sensor Market For Microwave, By Application, 2016–2025 (USD Million)
Table 14 Motion Sensor Market For Microwave, By Region, 2016–2025 (USD Million)
Table 15 Motion Sensor Market For Microwave, By Function, 2016–2025 (USD Million)
Table 16 Motion Sensor Market For Dual Technology, By Embedded Sensor, 2016–2025 (USD Million)
Table 17 Motion Sensor Market For Dual Technology, By Application, 2016–2025 (USD Million)
Table 18 Motion Sensor Market For Dual Technology, By Region, 2016–2025 (USD Million)
Table 19 Motion Sensor Market For Dual Technology, By Function, 2016–2025 (USD Million)
Table 20 Motion Sensor Market For Tomographic Motion Technology, By Embedded Sensor, 2016–2025 (USD Million)
Table 21 Motion Sensor Market For Tomographic Motion Technology, By Application, 2016–2025 (USD Million)
Table 22 Motion Sensor Market For Tomographic Motion Technology, By Region, 2016–2025 (USD Million)
Table 23 Motion Sensor Market For Tomographic Motion Technology, By Function, 2016–2025 (USD Million)
Table 24 Motion Sensor Market For Other Motion Technologies, By Embedded Sensor, 2016–2025 (USD Million)
Table 25 Motion Sensor Market For Other Motion Technologies, By Application, 2016–2025 (USD Million)
Table 26 Motion Sensor Market For Other Motion Technologies, By Region, 2016–2025 (USD Million)
Table 27 Motion Sensor Market For Other Motion Technologies, By Function, 2016–2025 (USD Million)
Table 28 Motion Sensor Market, By Embedded Sensor, 2016–2025 (USD Million)
Table 29 Motion Sensor Market, By Embedded Sensor, 2016–2025 (Million Units)
Table 30 Motion Sensor Market For Mems Accelerometers, By Motion Technology, 2016–2025 (USD Million)
Table 31 Motion Sensor Market For Mems Accelerometers, By Region, 2016–2025 (USD Million)
Table 32 Motion Sensor Market For Mems Accelerometers, By Application, 2016–2025 (USD Million)
Table 33 Motion Sensor Market For Mems Gyroscopes, By Motion Technology, 2016–2025 (USD Million)
Table 34 Motion Sensor Market For Mems Gyroscopes, By Region, 2016–2025 (USD Million)
Table 34 Motion Sensor Market For Mems Gyroscopes, By Application, 2016–2025 (USD Million)
Table 36 Motion Sensor Market For Mems Magnetometers, By Motion Technology, 2016–2025 (USD Million)
Table 37 Motion Sensor Market For Mems Magnetometers, By Region, 2016–2025 (USD Million)
Table 38 Motion Sensor Market For Mems Magnetometers, By Application, 2016–2025 (USD Million)
Table 39 Motion Sensor Market For Sensor Combos, By Motion Technology, 2016–2025 (USD Million)
Table 40 Motion Sensor Market For Sensor Combos, By Region, 2016–2025 (USD Million)
Table 41 Motion Sensor Market For Sensor Combos, By Application, 2016–2025 (USD Million)
Table 42 Motion Sensor Market, By Function, 2016–2025 (USD Million)
Table 43 Motion Sensor Market For Fully−Automatic, By Motion Technology, 2016–2025 (USD Million)
Table 44 Motion Sensor Market For Fully−Automatic, By Application, 2016–2025 (USD Million)
Table 45 Motion Sensor Market For Semi-Automatic, By Motion Technology, 2016–2025 (USD Million)
Table 46 Motion Sensor Market For Semi−Automatic, By Application, 2016–2025 (USD Million)
Table 47 Motion Sensor Market, By Application, 2016–2025 (USD Million)
Table 48 Motion Sensor Market, By Application, 2016–2025 (Million Units)
Table 49 Motion Sensor Market For Consumer Electronics Applications, By Motion Technology, 2016–2025 (USD Million)
Table 50 Motion Sensor Market For Consumer Electronics Applications, By Region, 2016–2025 (USD Million)
Table 51 Motion Sensor Market For Consumer Electronics Applications, By Function, 2016–2025 (USD Million)
Table 52 Motion Sensor Market For Consumer Electronics Applications, By Embedded Sensor, 2016–2025 (USD Million)
Table 53 Motion Sensor Market, By Consumer Electronics Applications, 2016–2025 (USD Million)
Table 54 Motion Sensor Market For Automotive Applications, By Motion Technology, 2016–2025 (USD Million)
Table 55 Motion Sensor Market For Automotive Applications, By Region, 2016–2025 (USD Million)
Table 56 Motion Sensor Market For Automotive Applications, By Function, 2016–2025 (USD Million)
Table 57 Motion Sensor Market For Automotive Applications, By Embedded Sensor, 2016–2025 (USD Million)
Table 58 Motion Sensor Market, By Automotive Application, 2016–2025 (USD Million)
Table 59 Motion Sensor Market For Aerospace & Defense, By Motion Technology, 2016–2025 (USD Million)
Table 60 Motion Sensor Market For Aerospace & Defense, By Region, 2016–2025 (USD Million)
Table 61 Motion Sensor Market For Aerospace & Defense Applications, By Function, 2016–2025 (USD Million)
Table 62 Motion Sensor Market For Aerospace & Defense Applications, By Embedded Sensor, 2016–2025 (USD Million)
Table 63 Motion Sensor Market For Healthcare Applications, By Motion Technology, 2016–2025 (USD Million)
Table 64 Motion Sensor Market For Healthcare, By Region, 2016–2025 (USD Million)
Table 65 Motion Sensor Market For Healthcare Applications, By Function, 2016–2025 (USD Million)
Table 66 Motion Sensor Market For Healthcare Applications, By Embedded Sensor, 2016–2025 (USD Million)
Table 67 Motion Sensor Market For Healthcare Applications, 2016–2025 (USD Million)
Table 68 Motion Sensor Market For Industrial Applications, By Motion Technology, 2016–2025 (USD Million)
Table 69 Motion Sensor Market For Industrial Applications, By Region, 2016–2025 (USD Million)
Table 70 Motion Sensor Market For Industrial Applications, By Function, 2016–2025 (USD Million)
Table 71 Motion Sensor Market For Industrial Applications, By Embedded Sensor, 2016–2025 (USD Million)
Table 72 Motion Sensor Market, By Industrial Application, 2016–2025 (USD Million)
Table 73 Motion Sensor Market For Commercial Applications, By Motion Technology, 2016–2025 (USD Million)
Table 74 Motion Sensor Market For Commercial Applications, By Region, 2016–2025 (USD Million)
Table 75 Motion Sensor Market For Commercial Applications, By Function, 2016–2025 (USD Million)
Table 76 Motion Sensor Market For Commecrial Applications, By Embedded Sensor, 2016–2025 (USD Million)
Table 77 Motion Sensor Market, By Commercial Application, 2016–2025 (USD Million)
Table 78 Motion Sensor Market For Residential Applications, By Motion Technology, 2016–2025 (USD Million)
Table 79 Motion Sensor Market For Residential Applications, By Region, 2016–2025 (USD Million)
Table 80 Motion Sensor Market For Residential Applications, By Function, 2016–2025 (USD Million)
Table 81 Motion Sensor Market For Residential Applications, By Embedded Sensor, 2016–2025 (USD Million)
Table 82 Motion Sensor Market, By Residential Application, 2016–2025 (USD Million)
Table 83 Motion Sensor Market For Other Applications, By Motion Technology, 2016–2025 (USD Million)
Table 84 Motion Sensor Market For Other Applications, By Region, 2016–2025 (USD Million)
Table 85 Motion Sensor Market For Other Applications, By Function, 2016–2025 (USD Million)
Table 86 Motion Sensor Market For Other Applications, By Embedded Sensor, 2016–2025 (USD Million)
Table 87 Motion Sensor Market, By Region, 2016–2025 (USD Million)
Table 88 Motion Sensor Market, By Region, 2016–2025 (Million Units)
Table 89 Motion Sensor Market In North America, By Motion Technology, 2016–2025 (USD Million)
Table 90 Motion Sensor Market In North America, By Application, 2016–2025 (USD Million)
Table 91 Motion Sensor Market In North America, By Country, 2016–2025 (USD Million)
Table 92 Motion Sensor Market In North America, By Country, 2016–2025 (Million Units)
Table 93 Motion Sensor Market In Europe, By Motion Technology, 2016–2025 (USD Million)
Table 94 Motion Sensor Market In Europe, By Application, 2016–2025 (USD Million)
Table 95 Motion Sensor Market In Europe, By Country, 2016–2025 (USD Million)
Table 96 Motion Sensor Market In Europe, By Country, 2016–2025 (Million Units)
Table 97 Motion Sensor Market In APAC, By Motion Technology, 2016–2025 (USD Million)
Table 98 Motion Sensor Market In APAC, By Application, 2016–2025 (USD Million)
Table 99 Motion Sensor Market In APAC, By Country, 2016–2025 (USD Million)
Table 100 Motion Sensor Market In APAC,By Country, 2016–2025 (Million Units)
Table 101 Motion Sensor Market In Row, By Motion Technology, 2016–2025 (USD Million)
Table 102 Motion Sensor Market In Row, By Application, 2016–2025 (USD Million)
Table 103 Motion Sensor Market In Row, By Country, 2016–2025 (USD Million)
Table 104 Motion Sensor Market In Row, By Country, 2016–2025 (Million Units)
Table 105 Top 5 Players In Motion Sensor Market, 2018
Table 106 Product Launches In Motion Sensor Market
Table 107 Acquisition And Expansion In Motion Sensor Market
Table 108 Collaboration And Partnership In Motion Sensor Market
The study involved 4 major activities in estimating the current size of the motion sensor market. Exhaustive secondary research was done to collect information on the market, peer market, and parent market. The next step was to validate these findings, assumptions, and sizing with industry experts across value chain through primary research. Both top-down and bottom-up approaches were employed to estimate the complete market size. After that, market breakdown and data triangulation methods were used to estimate the market size of segments and subsegments.
Secondary Research
The research methodology used to estimate and forecast the market begins with capturing data on revenues of key vendors in the market through secondary research. This study incorporates the use of extensive secondary sources, directories, and databases such as Hoovers, Bloomberg Businessweek, Factiva, and OneSource to identify and collect information useful for the technical, market-oriented, and commercial study of market. Vendor offerings have also been considered to determine the market segmentation. This entire research methodology includes the study of annual and financial reports of top players, presentations, press releases, journals, paid databases, trade directories, regulatory bodies, and safety standard organizations.
Primary Research
The motion sensor market comprises several stakeholders, such as vendors of motion sensor; research and development (R&D) organizations; technology, service, and solution providers; intellectual property (IP) core and licensing providers; solutions providers, and system integrators in the supply chain. The supply side is characterized by advancements in motion sensors, their end users, and their growing number of applications. Various primary sources from both the supply and demand sides of the market were interviewed to obtain qualitative and quantitative information. Following is the breakdown of primary respondents.
To know about the assumptions considered for the study, download the pdf brochure
Market Size Estimation
Both top-down and bottom-up approaches have been used to estimate and validate the total size of the motion sensor market. These methods have also been used extensively to estimate the size of various market subsegments. The research methodology used to estimate the market size includes:
- Key players in major end user segments and markets were identified through extensive secondary research.
- The industry’s supply chain and market size, in terms of value, were determined through primary and secondary research processes.
- All percentage shares, splits, and breakdowns were determined using secondary sources and verified through primary sources.
Data Triangulation
After arriving at the overall market size using the estimation processes as explained above—the market was split into several segments and subsegments. To complete the overall market engineering process and arrive at the exact statistics of each market segment and subsegment, data triangulation and market breakdown procedures were employed, wherever applicable. The data was triangulated by studying various factors and trends from both the demand and supply sides in the areas of motion sensor.
Research Objective
- To describe and forecast the market, in terms of value and volume, by motion technology and application
- To describe and forecast market, in terms of value and volume, by region—North America, Europe, Asia Pacific (APAC), and Rest of the World (RoW)
- To provide detailed information regarding major factors influencing market growth (drivers, restraints, opportunities, and challenges)
- To use the Porter’s five forces model to gauge the entry barriers to market, along with the value chain analysis to study each elemental block of the market
- To strategically analyze the micromarkets with regard to individual growth trends, prospects, and contributions to the overall market
- To analyze opportunities in market for stakeholders and the details of competitive leadership mapping for leaders in the market
- To analyze competitive developments such as expansion, mergers and acquisitions, and product launches, along with research and development (R&D) in market
- To profile key players and comprehensively analyze their market positions in terms of ranking and core competencies, along with detailing the competitive landscape for market leaders
Available Customizations:
Along with the market data, MarketsandMarkets offers customizations according to a company’s specific needs. The following customization options are available for the report:
Company Information
- Detailed analysis and profiling of additional market players (Up to 5)
Critical Questions
- What are new end-user areas being explored by the motion sensor solution providers?
- Which are the key players in the market, and how intense is the competition?


Growth opportunities and latent adjacency in Motion Sensor Market
Looking for market data on motion sensors for industrial, automotive and aerospace markets.
I want a complete analysis of motion sensor market includes margin, current market competition , consumer segment , and product positioning. What would be the future of this market, if I will start this business. ....please help me.
To understand in detail the motion sensor market in the following: - major players in the market - major industries and markets and their respective sizes, their main technology used, and why - main users, which industries they are in, and geographical locations - types of uses, environment, application of the sensors
I am researcher and conducting an industry analysis on motion sensors. We have a Ohio University's purchased databases that do not provide the necessary information to complete my analysis. It would be extremely beneficial if I could receive a free sample for better understanding.