Acute Lymphocytic/Lymphoblastic Leukemia Therapeutics Market � (Pipeline Forecast & Market Forecast in G8 Countries) (2011 � 2020)


The acute lymphocytic leukemia (ALL) therapeutics market has growth potential as the incidence rate of the disease is increasing all over the globe. The incidence of acute lymphoblastic leukemia is higher in children from 0 to 14 years than in those aged 15 years and above. However, acute lymphoblastic leukemia may also occur in adults. The acute lymphocytic leukemia market is segmented into two types�childhood acute lymphocytic/lymphoblastic leukemia and adult acute lymphocytic/lymphoblastic leukemia.
The market primarily covers regimens and drugs (patented, off-patent, and pipeline). The growing acute lymphocytic leukemia population is an impetus for the growth of the market. This market is expected to grow at a CAGR of 4.0% from 2015 to 2020. In 2012, the overall ALL therapeutics market was dominated by Linker regimen, Hyper-CVAD regimen, and Nucleoside metabolic inhibitors treatments. However, by 2020, the overall share of these drugs and regimens will be largely impacted by the launch of Graspa (ERYtechPharma), an innovative form of L-Asparaginase, followed by Marqibo (Talon Therapeutics) and Inotuzumab Ozogamicin (Pfizer, Inc.).
In contrast to the growth of the market, the cost of the therapies is majorly restraining the acute lymphocytic leukemia therapeutics market. In addition, patent expirations of some of the existing drugs in the market are also expected to limit the market growth during 2013 to 2020.
Market players are implementing various growth strategies in the market to gain a competitive edge. New product launches, product pipelines, agreements and collaborations, clinical trials, and acquisitions were some of the major strategies adopted by the players from January 2008 to November 2013.
Scope of the report:
This research report categorizes the market in G8 countries into the following segments:
Acute Lymphocytic Leukemia Therapeutics Market, by Drug
- Existing Regimens/Drugs
- Hyper-CVAD Regimen
- CALGB 8811 Regimen
- Linker Regimen
- Nucleoside Metabolic Inhibitors (Clolar and Nelarabine)
- Oncaspar
- Pipeline Drugs (Phase III)
- Graspa
- Marqibo
- Inotuzumab Ozogamicin
Acute Lymphoblastic Leukemia Therapeutics Market, by Geography
- North America
- U.S.
- Canada
- Europe
- Germany
- France
- Italy
- Spain
- U.K.
- Japan
The acute lymphoblastic leukemia therapeutics market is segmented based on the existing regimens and drugs, pipeline drugs, and geography. The existing regimes and drugs market currently includes three regimens (Hyper-CVAD, Linker, and CALGB 8811) and three monotherapy drugs (Oncaspar, Clolar, and Arranon). In addition, three drugs, namely, Graspa (ERYtech Pharma), Marqibo (Talon Therapeutics), and Inotuzumab Ozogamicin (Pfizer, Inc.) are in the pipeline (Phase III clinical trials).
The acute market is valued at an estimated $2,777.2 million in 2013 and is expected to reach $3,780.3 million by 2020, at a CAGR of 4.0% from 2015 to 2020.
Presently, the market is driven by factors such as the increasing incidence rate of ALL cases, development of innovative therapies such as multi-drug regimens, and continuous efforts of pharmaceutical companies to offer superior-quality drugs. Such improved regimens and drugs have shown significant results in the overall survival rate.
The overall growth of the acute lymphocytic leukemia therapeutics market is largely challenged by the patent expiration of existing drugs. Arranon (nelarabine), a monotherapy drug, lost its patent in February 2013, whereas, Clolar (clofarabine) is due for patent expiration in 2018.
Some of the major players in this market include ERYtech Pharma (France), Talon Therapeutic, Inc. (U.S.), GlaxoSmithKline plc (U.K.), Sigma-Tau Pharmaceuticals, Inc. (U.S.), Pfizer, Inc. (U.S.), and Genzyme Corporation (U.S.).
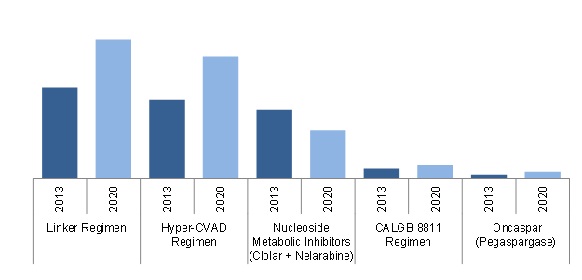
Acute Lymphocytic/Lymphoblastic Leukemia Market in G8 Countries, By Existing Regimen/Drugs ($Million)
Source: SEER U.S. Cancer Portal, Globocan Database, ZenRx Research, Rx USA, Orange Book, Blood Journal, American Medical Association, New England Journal of Medicine (NEJM), Nature Magazines, PubMed, BMJ Clinical Trials Articles, Annual Reports, Sec Filings, clinical trials.gov, Press Releases & MarketsandMarkets Analysis
 Exclusive indicates content/data unique to MarketsandMarkets and not available with any competitors.
Table Of Contents
1 Introduction (Page No. - 16)
1.1 Objectives of The Study
1.2 Report Description
1.3 Markets Covered
1.4 Stakeholders
1.5 Research Methodology
1.5.1 Market Size Estimation and Data Triangulation
1.5.2 Market Estimation Model
1.5.3 Key Data Points Taken From Secondary Sources
1.5.4 Assumptions Made For This Report
2 Executive Summary (Page No. - 31)
3 Market Overview (Page No. - 36)
3.1 Defining Leukemia
3.2 Acute Lymphocytic Leukemia
3.2.1 Risk Factors
3.2.2 Stages/Risk Groups of Acute Lymphocytic Leukemia
3.2.2.1 Childhood All
3.2.2.1.1 Standard (LOW) Risk
3.2.2.1.2 High Risk
3.2.2.1.3 Recurrent
3.2.2.2 Adult All
3.2.2.2.1 Untreated Adult All
3.2.2.2.2 Adult All in Remission
3.2.2.2.3 Recurrent Adult All
3.2.3 Diagnosis
3.2.3.1 Biopsy and Bone Marrow Aspiration
3.2.3.2 Complete Blood Count (CBC) and Differential
3.2.3.3 Presence of Philadelphia Chromosome
3.2.3.4 Spinal Tap (Lumbar Puncture) and Cerebrospinal Fluid (CSF) Analysis
3.2.3.5 Immunophenotyping Or Phenotyping By Flow Cytometry
3.2.3.6 Polymerase Chain Reaction (PCR)
3.2.4 Leukemia Prevalence
3.2.5 Incidence & Mortality
3.3 Market Structure
3.3.1 Key Therapies
3.3.1.1 Chemotherapy
3.3.1.2 Stem Cell/Bone Marrow Transplant
3.3.1.3 Radiation Therapy
4 Acute Lymphocytic Leukemia Therapeutics Market Dynamics (Page No. - 49)
4.1 Market Overview
4.2 Market Dynamics
4.2.1 Market Drivers
4.2.1.1 Innovative Therapies to Drive The Market For Acute Lymphocytic Leukemia
4.2.1.2 Oncology Is The Largest Therapeutic Market With High Unmet Needs
4.2.2 Market Restraints
4.2.2.1 Costs Associated With The Treatment
4.2.2.2 Adverse Events of Treatment
4.2.2.3 Low Production Capability of Drugs
4.2.2.4 Genericiazation of The Major Drugs
4.2.3 Market Opportunities
4.2.3.1 Limited Players in The Market
4.2.3.2 Leukemia�s Underserved Patient Populations offer Potential For Market Growth
4.3 Burning Issues
4.4 Winning Imperatives
4.4.1 Market Expansion Through Multiple Therapeutic Approaches
5 Leukemia Product Market (Page No. - 59)
5.1 Market Overview
5.1.1 Hyper-Cvad Regimen
5.1.2 Calgb 8811 Regimen
5.1.3 Linker Regimen
5.1.4 Nucleoside Metabolic Inhibitors (Clolar + Arranon)
5.1.5 Oncaspar
6 Acute Lymphocytic Leukemia Pipeline Molecules (Phase Iii)(Page No. - 73)
6.1 Introduction
6.1.1 Graspa
6.1.2 Marqibo
6.1.3 Inotuzumab Ozogamicin
7 Geographic Analysis (Page No. - 81)
7.1 Introduction
7.2 U.S.
7.3 Canada
7.4 U.K.
7.5 Germany
7.6 France
7.7 Italy
7.8 Spain
7.9 Japan
8 Company Profiles (Overview, Financials, Products Portfolio, Growth Strategy, and Developments)* (Page No. - 126)
8.1 Erytech Pharma
8.2 Genzyme Corporation
8.3 Talon Therapeutics, Inc. (Spectrum Pharmaceuticals, Inc.)
8.4 Sigma-Tau Pharmaceuticals, Inc.
8.5 Pfizer Inc
8.6 Glaxosmithkline Plc
*Details On Financials, Products Portfolio, Growth Strategy, and Developments Might Not Be Captured in Case of Unlisted Companies.
Competetive Developments (2008 � 2013) (Page No. - 148)
Acquisitions/Collaborations/Partnerships/ Agreements/Joint Ventures, 2008 � 2013
New Product Launches, 2008 � 2013
Expansions/New Facilities/investments, 2008 � 2013 152
Approvals, 2008 � 2013
Developments Related to Clinical Trials, 2008 � 2013 154
Other Developments, 2008 � 2013
List Of Tables (50 Tables)
Table 1 Yearly Cost of Drugs in North America & Japan, 2013 ($)
Table 2 Yearly Cost of Drugs in European Countries, 2013 ($)
Table 3 Dosage Pattern of All Drugs
Table 4 Acute Lymphocytic Leukemia Drugs: Patent Status
Table 5 Acute Lymphocytic Leukemia Drugs: Market Revenue, By Type, 2011 � 2020 ($Million)
Table 6 Acute Lymphocytic Leukemia Drugs/Regimens Market Revenue, 2011 � 2020 ($Million)
Table 7 Acute Lymphocytic Leukemia Regimen (Hyper-Cvad) Market Revenue, By Country, 2011 � 2020 ($Million)
Table 8 Acute Lymphocytic Leukemia Regimen (Calgb 8811) Market Revenue, By Country, 2011 � 2020 ($Million)
Table 9 Acute Lymphocyitc Leukemia Drugs (Linker Regimen) Market Revenue, By Country, 2011 � 2020 ($Million)
Table 10 Acute Lymphocytic Leukemia Drug Class (Nucleoside Metabolic Inhibitors) Market Revenue, By Country, 2011 � 2020($Million)
Table 11 Acute Lymphocytic Leukemia Drugs (Oncaspar) Market Revenue, By Country, 2011 � 2020 ($Million)
Table 12 Product Pipeline Molecules: Phase Iii For Acute Lymphocytic Leukemia
Table 13 Acute Lymphocytic Leukemia Drugs � Pipeline (Graspa): Market Revenue, By Country, 2015 � 2020 ($Million)
Table 14 Acute Lymphocytic Leukemia Drugs � Pipeline (Marqibo): Market Revenue, By Country, 2013 � 2020 ($Million)
Table 15 Acute Lymphocytic Leukemia Drugs � Pipeline (Inotuzumab Ozogamicin): Market Revenue, By Country, 2015 � 2020 ($Million)
Table 16 Acute Lymphocytic Leukemia Therapeutics Market in G8 Countries, By Geography, 2011 � 2020 ($Million)
Table 17 U.S.: Acute Lymphocytic Leukemia Epidemiology, 2011 � 2020
Table 18 U.S.: Existing Regimens/Drugs Market Revenue, 2011 � 2020 ($Million)
Table 19 U.S.: Pipeline Drugs Market Revenue, 2012 � 2020 ($Million)
Table 20 Canada: Acute Lymphocytic Leukemia Epidemiology, 2011 � 2020
Table 21 Canada: Existing Regimens/Drugs Market Revenue, 2011 � 2020 ($Million)
Table 22 Canada: Pipeline Drugs Market Revenue, 2012 � 2020 ($Million)
Table 23 U.K.: Acute Lymphocytic Leukemia Epidemiology, 2011 � 2020
Table 24 U.K.: Existing Regimens/Drugs Market Revenue, 2011 � 2020 ($Million)
Table 25 U.K.: Pipeline Drugs Market Revenue, 2012 � 2020 ($Million)
Table 26 Germany: Acute Lymphocytic Leukemia Epidemiology, 2011 � 2020
Table 27 Germany: Existing Regimens/ Drugs Market Revenue, 2011 � 2020 ($Million)
Table 28 Germany: Pipeline Drugs Market Revenue, 2012 � 2020 ($Million)
Table 29 France: Acute Lymphocytic Leukemia Epidemiology, 2011 � 2020
Table 30 France: Existing Regimen/ Drugs Market Revenue, 2011 � 2020 ($Million)
Table 31 France: Pipeline Drugs Market Revenue, 2012 � 2020 ($Million)
Table 32 Italy: Acute Lymphocytic Leukemia Epidemiology, 2011 � 2020
Table 33 Italy: Existing Regimens/Drugs Market Revenue, 2011 � 2020 ($Million)
Table 34 Italy: Pipeline Drugs Market Revenue, 2011 � 2020 ($Million)
Table 35 Italy: Pipeline Drugs Market Share, 2015 Vs. 2020
Table 36 Spain: Acute Lymphocytic Leukemia Epidemiology, 2011 � 2020
Table 37 Spain: Existing Regimens/ Drugs Market Revenue, 2011 � 2020 ($Million)
Table 38 Spain: Pipeline Drugs Market Revenue, 2012 � 2020 ($Million)
Table 39 Japan: Acute Lymphocytic Leukemia Epidemiology, 2011 � 2020
Table 40 Japan: Existing Regimens/ Drugs Market Revenue, 2011 � 2020 ($Million)
Table 41 Japan: Pipeline Drugs Market Revenue, 2011 � 2020 ($Million)
Table 42 Erytech Pharma: Product Pipeline
Table 43 Erytech: Total Operating Revenue and R&D Expenditure, 2010 � 2012 ($Million)
Table 44 Genzyme Corporation: Product Portfolio
Table 45 Genzyme Corporation: Total Revenue and R&D Expenditure, 2008 � 2010 ($Million)
Table 46 Talon Therapeutics, inc.: Pipeline Product Portfolio
Table 47 Talon Therapeutics, inc.: Total R&D Expenditure, 2008 � 2012 ($Million)
Table 48 Sigma � Tau Group: Total Revenue, 2008 � 2012 ($Million)
Table 49 Pfizer, inc.: Total Revenue and R&D Expenditure, 2008 � 2012 ($Million)
Table 50 Galxosmithkline PLC: Total Revenue & R&D Expenses, 2008 � 2012 ($Million)
List Of Figures (28 Figures)
Figure 1 Acute Lymphocytic Leukemia Therapeutics Market in G8 Countries, By Existing Regimens/Drugs ($Million)
Figure 2 Market in G8 Countries, By Product Pipeline ($Million)
Figure 3 Status of Acute Lymphoblastic Leukemia Therapeutics Product Pipeline
Figure 4 Acute Lymphoblastic Leukemia Therapeutics Market, By Country
Figure 5 Most Common Types of Leukemia
Figure 6 Total Leukemia Population, By Country, 2008 � 2020
Figure 7 Acute Lymphocytic Leukemia: Age At Diagnosis
Figure 8 Stages and Phases of Acute Lymphocytic Leukemia
Figure 9 Acute Lymphocytic Leukemia: Population, By Country, 2008 � 2020
Figure 10 Market Revenue, By Top 10 Therapeutic Class ($Billion)
Figure 11 Erytech and Talon: Product Pipeline
Figure 12 Acute Lymphoblastic Leukemia Existing Regimens/Drugs Market Share, By Types, 2013 Vs 2015 Vs 2020
Figure 13 Acute Lymphocytic Leukemia Pipeline Regimens/Drugs Market Share, By Types, 2015 Vs 2020
Figure 14 U.S.: Acute Lymphocytic Leukemia Therapeutics � Existing Regimens/Drugs Market Share, 2013 Vs. 2015 Vs. 2020 ($Million)
Figure 15 U.S: Acute Lymphoblastic Leukemia Therapeutics � Pipeline Drugs Market Share, 2015 Vs. 2020
Figure 16 Canada: Acute Lymphocytic Leukemia Therapeutics � Existing Regimens/ Drugs Market Share, 2013 Vs. 2015 Vs. 2020
Figure 17 Canada: Acute Lymphoblastic Leukemia Therapeutics � Pipeline Drugs Market Share, 2015 Vs. 2020
Figure 18 U.K.: Acute Lymphocytic Leukemia Therapeutics � Existing Regimens/ Drugs Market Share, 2013 Vs. 2015 Vs. 2020
Figure 19 U.K.: Acute Lymphoblastic Leukemia Therapeutics � Pipeline Drugs Market Share, 2015 Vs. 2020
Figure 20 Germany: Acute Lymphocytic Leukemia Therapeutics � Existing Regimens/Drugs Market Share, 2013 Vs. 2015 Vs. 2020
Figure 21 Germany: Acute Lymphoblastic Leukemia Therapeutics � Pipeline Drugs Market Share, 2015 Vs. 2020
Figure 22 France: Acute Lymphocytic Leukemia Therapeutics � Existing Regimens/Drugs Market Share, 2013 Vs. 2015 Vs. 2020
Figure 23 France: Acute Lymphoblastic Leukemia Therapeutics � Pipeline Drugs Market Share, 2015 Vs. 2020
Figure 24 Italy: Acute Lymphocytic Leukemia Therapeutics � Existing Regimens/ Drugs Market Share, 2013 Vs. 2015 Vs. 2020
Figure 25 Spain: Acute Lymphoblastic Leukemia Therapeutics � Existing Regimens/ Drugs Market Share, 2013 Vs. 2015 Vs. 2020
Figure 26 Spain: Acute Lymphocytic Leukemia Therapeutics � Pipeline Drugs Market Share, 2015 Vs. 2020
Figure 27 Japan: Acute Lymphoblastic Leukemia Therapeutics � Existing Regimens/Drugs Market Share, 2013 Vs. 2015 Vs. 2020
Figure 28 Japan: Acute Lymphocytic Leukemia Therapeutics � Pipeline Drugs Market Share, 2015 Vs. 2020

 Generating Response ...


Growth opportunities and latent adjacency in Acute Lymphocytic/Lymphoblastic Leukemia Therapeutics Market