Epoxy Market by Type (Liquid, Solid & Solution), Application (Construction, Automotive & transportation, Electrical & electronics, General industrial, Wind, Marine, Aerospace, Consumer goods & Others), and Region - Global Forecasts to 2020


[218 Pages] The Epoxy market is estimated to grow from USD 7.52 billion in 2015 to USD 9.96 billion by 2020, at a CAGR of 5.8% between 2015 and 2020. Huge investments by end-use industries such as wind energy, transportation, and increasing infrastructural development projects in the emerging economies are also driving the market. The emerging middle class population of China, India, and Brazil; changing life style; and improving standard of living of consumers depict the increasing demand for high quality epoxy products.
Also, the demand for lightweight materials in automotives is pulling the demand for adhesives, coatings, and composites based on epoxy.
Years considered for this report
2014 � Base Year
2015 � Estimated Year
2020 � Projected Year
Research Methodology
This study aims to estimate the Epoxy market size for 2015 and projects its demand till 2020. It also provides a detailed qualitative and quantitative analysis of the Epoxy market. Various secondary sources such as directories, industry journals, and databases have been used to identify and collect information useful for this extensive commercial study of the Epoxy market. Primary sources such as experts from related industries and suppliers have been interviewed to obtain and verify critical information as well as to assess prospects of the Epoxy market. The breakdown of profiles of primaries is shown in the figure below:
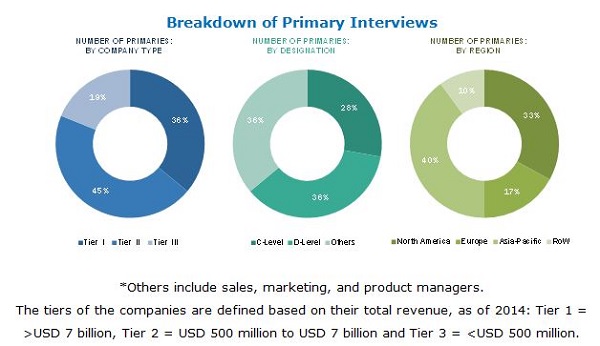
To know about the assumptions considered for the study, download the pdf brochure
The Epoxy value chain includes raw material manufacturers such as Hanwha Chemical (South Korea), Aditya Birla Chemicals (India), Sumitomo Chemical (Japan), Air Products & Chemicals, Inc. (U.S.), Evonik Industries (Germany) among others, Epoxy manufacturers such as Olin corporation (U.S.), Kukdo Chemical Co. Ltd (South Korea), Nan Ya Plastics Corporation (Taiwan), epoxy based product manufacturers include Henkel (Germany), Akzo Nobel (Netherlands), Sherwin Williams (U.S.), SIKA A.G. (Switzerland) among others. Further the products manufactured by these companies are used by automotive, aerospace, construction, wind energy related companies such as BMW (Germany), Daimler (Germany), Volvo (Sweden), Boeing (U.S.), Siemens (Germany), and Vestas (Denmark), among others.
Target audience: Epoxy and other raw material manufacturers
- Converters of Epoxy for coatings, composites, adhesives and other applications. Traders, distributors, and suppliers of Epoxy
- Regional manufacturers' associations and general Epoxy associations
- Raw material manufacturers
- Government and regional agencies and research organizations
�The study answers several questions for the stakeholders, primarily which market segments to focus in the next two-to-five years for prioritizing efforts and investments and competitive landscape of the market.�
Scope of the Report:
The Epoxy market has been covered in detail in this report. To provide an all-round picture, the current market demand and forecasts have also been included. The Epoxy is segmented as follows:
On the basis of Type:
- Liquid
- Solid
- Solution
On the basis of Application:
- Coatings
- Construction
- Automotive & transportation
- Electrical & electronics
- General industrial
- Others
- Composites
- Construction
- Automotive & transportation
- Electrical & electronics
- Consumer goods
- Wind energy
- Marine
- Aerospace
- Others
- Adhesives
- Construction
- Automotive & transportation
- Aerospace
- Wind energy
- Marine
- Others
- Others
On the basis of Region:
- Asia-Pacific
- Europe
- North America
- RoW
The market is further analyzed for key countries in each of these regions.
Available Customizations
With the given market data, MarketsandMarkets offers customizations as per the company�s specific needs. The following customization options are available for the report:
Product Analysis
- Product matrix which gives a detailed comparison of product portfolio of each company
Regional Analysis
- Further breakdown of the rest of the Epoxy market in Asia-Pacific into Vietnam, Thailand, Taiwan, Singapore, and other Asian countries
- Further breakdown of the Epoxy market in RoW into the Middle East & Africa and Latin America
The epoxy market size is estimated to reach USD 9.96 Billion by 2020, signifying a CAGR of over 5.8% between 2015 and 2020. The emerging middle class population of China, India, and Brazil; changing life style; and improving standard of living of consumers depict the increasing demand for high quality products. These are the important factors responsible for growth of end-use industries such as automotive, transport, aerospace, marine, electronics, and others.
Epoxy comes in three types solid, liquid, and solution. Solid is the fastest-growing segment, in terms of both value and volume. Solid and solution epoxy majorly serve the coatings market, while liquid epoxy serve diverse applications across various industries.
Adhesive, composite, and coating epoxies find applications majorly in automotive & transportation, construction, wind energy, aerospace, and others industries. The growth of building & construction application is driven by increasing urbanization in Asia-Pacific and RoW, which resulted into increased demand for residential, commercial, and industrial infrastructure. Low interest rates on housing loans are also responsible for increase in the demand for new houses, eventually driving the market.
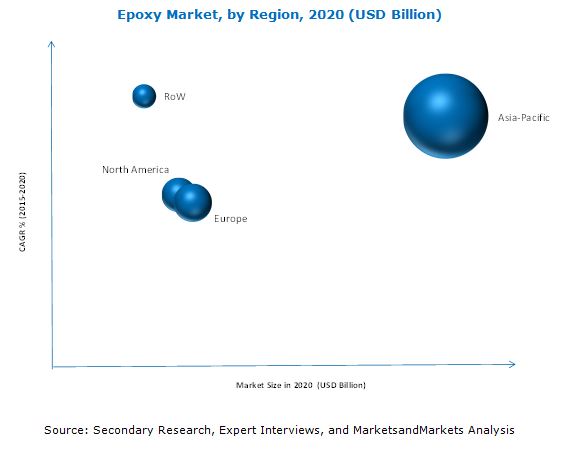
Currently, the Asia-Pacific region is the largest market of epoxy and is estimated to witness the high growth rate during the forecast period. Countries such as China, Japan, South Korea, and India are expected to lead the Asia-Pacific epoxy market, with China accounting for the largest share in the regional demand for epoxy. Currently, the market size, in terms of volume, for epoxy is comparatively low in Mexico. However, Mexico is expected to grow at the highest rate in the North American region.
The epoxy market is highly competitive, with key market players, such as Olin Corporation (U.S.), Nan Ya Plastics Corporations (Taiwan), Kukdo Chemical Co. Ltd. (Korea), Hexion Inc. (U.S.), Chang Chun Plastics Ltd. (Taiwan), Huntsman Corporation (U.S.), BASF SE (Germany), 3M (U.S.), Mitsubishi Chemical Corp. (Japan), Atul Ltd. (India), Sinopec Corp. (China), and Aditya Birla Chemical (Thailand).
Fluctuating price and availability of raw materials are key factors for epoxy manufacturers for determining the cost structure of their products. Most of the raw materials for preparing epoxy are petroleum-based derivatives and are vulnerable to fluctuations in commodity prices.
The major turnaround in the epoxy market was acquisition of Dow Chemical Epoxy division by Olin Corporation. Olin Corporation is currently the leading player in the epoxy market. It continues to expand its epoxy business through new innovations in products and increasing its market reach. The company has diversified product portfolio of epoxy and has strong operational network in North-America.
To speak to our analyst for a discussion on the above findings, click Speak to Analyst
 Exclusive indicates content/data unique to MarketsandMarkets and not available with any competitors.
Table of Contents
1 Introduction (Page No. - 20)
1.1 Objectives of the Study
1.2 Market Definition
1.3 Market Scope
1.3.1 Markets Covered
1.3.2 Years Considered for the Study
1.4 Currency
1.5 Package Size
1.6 Stakeholders
2 Research Methodology (Page No. - 23)
2.1 Research Data
2.1.1 Secondary Data
2.1.1.1 Key Data From Secondary Sources
2.1.2 Primary Data
2.1.2.1 Key Data From Primary Sources
2.1.2.2 Key Industry Insights
2.2 Market Size Estimation
2.2.1 Bottom-Up Approach
2.2.2 Top-Down Approach
2.3 Market Breakdown and Data Triangulation
2.4 Assumptions and Limitations
2.4.1 Assumptions
2.4.2 Limitations
3 Executive Summary (Page No. - 32)
4 Premium Insights (Page No. - 37)
4.1 Attractive Opportunities for Market Players
4.2 Epoxy Market � Major Types
4.3 Epoxy Market: Developed vs Developing Nations
4.4 Life Cycle Analysis, By Region
4.5 Epoxy Market
4.6 China Dominated the Global Epoxy Market
5 Market Overview (Page No. - 42)
5.1 Introduction
5.2 Market Segmentation
5.2.1 By Type
5.2.2 By Application
5.2.3 By Region
5.3 Market Dynamics
5.3.1 Drivers
5.3.1.1 High Growth in End-Use Industry
5.3.1.2 Increasing Use of Composites
5.3.1.3 Emergent Demand From Developing Countries
5.3.1.3.1 Huge Investments in Emerging Economies of Asia-Pacific
5.3.1.4 Revolutionary Advancements in Weight Reduction, Safety, and Ease-Of-Application
5.3.2 Restraints
5.3.2.1 Volatility in Raw Material Prices
5.3.2.2 Unstable Economic Cycles
5.3.3 Opportunities
5.3.3.1 Growing Opportunities Across Asia-Pacific Market
5.3.3.2 Emergence of Need for Lightweight and Fuel-Efficient Vehicles
5.3.4 Challenges
5.3.4.1 Stringent Regulatory Approvals Required for Production
5.3.4.2 Limited Market Opportunities in Developed Countries
6 Industry Trends (Page No. - 51)
6.1 Introduction
6.2 Value-Chain Analysis
6.3 Porter�s Five Forces Analysis
6.3.1 Intensity of Competitive Rivalry
6.3.2 Bargaining Power of Buyers
6.3.3 Bargaining Power of Suppliers
6.3.4 Threat of Substitutes
6.3.5 Threat of New Entrants
6.4 Cost Analysis
7 Epoxy Market, By Type (Page No. - 56)
7.1 Introduction
7.2 Solid Epoxy
7.3 Liquid Epoxys
7.4 Solution Epoxy
8 Epoxy Market, By Application (Page No. - 62)
8.1 Introduction
8.2 Coatings Segment
8.2.1 Construction
8.2.2 Automotive & Transportation
8.2.3 Electrical & Electronics
8.2.4 General Industrial
8.2.5 Others
8.3 Adhesives Segment
8.3.1 Construction
8.3.2 Automotive & Transportation
8.3.3 Wind Energy
8.3.4 Marine
8.3.5 Aerospace
8.3.6 Others
8.4 Composites Segment
8.4.1 Construction
8.4.2 Automotive & Transportation
8.4.3 Electrical & Electronics
8.4.4 Consumer Goods
8.4.5 Wind Energy
8.4.6 Marine
8.4.7 Aerospace
8.4.8 Others
8.5 Others
9 Epoxy Market, By Region (Page No. - 84)
9.1 Introduction
9.2 Asia-Pacific
9.2.1 Type Market Size
9.2.2 Application Market Size
9.2.3 Sub-Application Market Size
9.2.4 Application By Type Market Size
9.2.5 Sub-Application By Type Market Size
9.2.6 Country Market Size
9.2.6.1 China
9.2.6.2 Japan
9.2.6.3 India
9.2.6.4 Rest of Asia-Pacific
9.3 North America
9.3.1 Type Market Size
9.3.2 Application Market Size
9.3.3 Sub-Application Market Size
9.3.4 Application By Type Market Size
9.3.5 Sub-Application By Type Market Size
9.3.6 Country Market Size
9.3.6.1 U.S.
9.3.6.2 Canada
9.3.6.3 Mexico
9.4 Europe
9.4.1 Type Market Size
9.4.2 Application Market Size
9.4.3 Sub-Application Market Size
9.4.4 Application By Type Market Size
9.4.5 Sub-Application By Type Market Size
9.4.6 Country Market Size
9.4.6.1 Germany
9.4.6.2 France
9.4.6.3 U.K.
9.4.6.4 Italy
9.4.6.5 Rest of Europe
9.5 Rest of the World (RoW)
9.5.1 Type Market Size
9.5.2 Application Market Size
9.5.3 Sub-Application Market Size
9.5.4 Application By Type Market Size
9.5.5 Sub-Application By Type Market Size
9.5.6 Country Market Size
9.5.6.1 Brazil
9.5.6.2 Russia
9.5.6.3 Middle Eastern Countries
9.5.6.4 Rest of the Countries
10 Competitive Landscape (Page No. - 155)
10.1 Overview
10.2 Competitive Situation and Trends
10.3 Investments & Expansions
10.4 New Product Launches
10.5 Partnerships
10.6 Mergers & Acquisitions
11 Company Profiles (Page No. - 160)
(Overview, Financial*, Products & Services, Strategy, and Developments)
11.1 Olin Corporation
11.2 Nan Ya Plastics Corporation
11.3 MnM View.
11.4 Hexion Inc.
11.5 Kukdo Chemical Co. Ltd.
11.6 Chang Chun Plastics Co. Ltd.
11.7 3M Company
11.8 Aditya Birla Chemicals
11.9 BASF SE
11.10 Huntsman Corporation
11.11 Sinopec Corporation
11.12 Mitsubishi Chemical Corporation
11.13 Atul Ltd.
*Details Might Not Be Captured in Case of Unlisted Companies.
12 Appendix (Page No. - 212)
12.1 Insights From Industry Experts
12.2 Discussion Guide
12.3 Knowledge Store: Marketsandmarkets� Subscription Portal
12.4 Introducing RT: Real Time Market Intelligence
12.5 Related Reports
List of Tables (228 Tables)
Table 1 Epoxy Market Snapshot, 2015 vs 2020
Table 2 Epoxys Market Size, By Type, 2013�2020 (USD Million)
Table 3 Epoxys Market Size, By Type, 2013�2020 (Kiloton)
Table 4 Solid Epoxys Market Size, By Region, 2013�2020 (USD Million)
Table 5 Solid Epoxys Market Size, By Region, 2013�2020 (Kiloton)
Table 6 Liquid Epoxys Market Size, By Region, 2013�2020 (USD Million)
Table 7 Liquid Epoxys Market Size, By Region, 2013�2020 (Kiloton)
Table 8 Solution Epoxys Market Size, By Region, 2014�2020 (USD Million)
Table 9 Solution Epoxys Market Size, By Region, 2015�2020 (Kiloton)
Table 10 Epoxy Market Size, By Application, 2013�2020 (USD Million)
Table 11 Epoxy Market Size, By Application, 2013�2020 (Kiloton)
Table 12 Coatings Epoxy Market Size, By Region, 2013�2020 (USD Million)
Table 13 Coatings Epoxy Market Size, By Region, 2013�2020 (Kiloton)
Table 14 Coatings Epoxy Market Size, By Sub- Application, 2013�2020 (USD Million)
Table 15 Coatings Epoxy Market Size, By Sub- Application, 2013�2020 (Kiloton)
Table 16 Construction Coatings Market Size, By Region, 2013�2020 (USD Million)
Table 17 Construction Coatings Market Size, By Region, 2013�2020 (Kiloton)
Table 18 Automotive & Transportation Coatings Market Size, By Region, 2013�2020 (USD Million)
Table 19 Automotive & Transportation Coatings Market Size, By Region, 2013�2020 (Kiloton)
Table 20 Electrical & Electronics Coatings Market Size, By Region, 2013�2020 (USD Million)
Table 21 Electrical & Electronics Coatings Market Size, By Region, 2013�2020 (Kiloton)
Table 22 General Industrial Coatings Market Size, By Region, 2013�2020 (USD Million)
Table 23 General Industrial Coatings Market Size, By Region, 2013�2020 (Kiloton)
Table 24 Other Coatings Market Size, By Region, 2013�2020 (USD Million)
Table 25 Other Coatings Market Size, By Region, 2013�2020 (Kiloton)
Table 26 Adhesives Epoxy Market Size, By Region, 2013�2020 (USD Million)
Table 27 Adhesives Epoxy Market Size, By Region, 2013�2020 (Kiloton)
Table 28 Adhesives Epoxy Market Size, By Sub-Application, 2013�2020 (USD Million)
Table 29 Adhesives Epoxy Market Size, By Sub-Application, 2013�2020 (Kiloton)
Table 30 Construction Adhesives Market Size, By Region, 2013�2020 (USD Million)
Table 31 Construction Adhesives Market Size, By Region, 2013�2020 (Kiloton)
Table 32 Automotive & Transportation Adhesives Market Size, By Region, 2013�2020 (USD Million)
Table 33 Automotive & Transportation Adhesives Market Size, By Region, 2013�2020 (Kiloton)
Table 34 Wind Energy Adhesives Market Size, By Region, 2013�2020 (USD Million)
Table 35 Wind Energy Adhesives Market Size, By Region, 2013�2020 (Kiloton)
Table 36 Marine Adhesives Market Size, By Region, 2013�2020 (USD Million)
Table 37 Marine Adhesives Market Size, By Region, 2013�2020 (Kiloton)
Table 38 Aerospace Adhesives Market Size, By Region, 2013�2020 (USD Million)
Table 39 Aerospace Adhesives Market Size, By Region, 2013�2020 (Kiloton)
Table 40 Other Adhesives Market Size, By Region, 2013�2020 (USD Million)
Table 41 Other Adhesives Market Size, By Region, 2013�2020 (Kiloton)
Table 42 Composites Epoxy Market Size, By Region, 2013�2020 (USD Million)
Table 43 Composites Epoxy Market Size, By Region, 2013�2020 (Kiloton)
Table 44 Composites Epoxy Market Size, By Sub-Application, 2013�2020 (USD Million)
Table 45 Composites Epoxy Market Size, By Sub-Application, 2013�2020 (Kiloton)
Table 46 Construction Composites Market Size, By Region, 2013�2020 (USD Million)
Table 47 Construction Composites Market Size, By Region, 2013�2020 (Kiloton)
Table 48 Automotive & Transportation Composites Market Size, By Region, 2013�2020 (USD Million)
Table 49 Automotive & Transportation Composites Market Size, By Region, 2013�2020 (Kiloton)
Table 50 Electrical & Electronics Composites Market Size, By Region, 2013�2020 (USD Million)
Table 51 Electrical & Electronics Composites Market Size, By Region, 2013�2020 (Kiloton)
Table 52 Consumer Goods Composites Market Size, By Region, 2013�2020 (USD Million)
Table 53 Consumer Goods Composites Market Size, By Region, 2013�2020 (Kiloton)
Table 54 Wind Energy Composites Market Size, By Region, 2013�2020 (USD Million)
Table 55 Wind Energy Composites Market Size, By Region, 2013�2020 (Kiloton)
Table 56 Marine Composites Market Size, By Region, 2013�2020 (USD Million)
Table 57 Marine Composites Market Size, By Region, 2013�2020 (Kiloton)
Table 58 Aerospace Composites Market Size, By Region, 2013�2020 (USD Million)
Table 59 Aerospace Composites Market Size, By Region, 2013�2020 (Kiloton)
Table 60 Other Composites Market Size, By Region, 2013�2020 (USD Million)
Table 61 Other Composites Market Size, By Region, 2013�2020 (Kiloton)
Table 62 Other Epoxy Market Size, By Region, 2013�2020 (USD Million)
Table 63 Other Epoxy Market Size, By Region, 2013�2020 (Kiloton)
Table 64 Epoxy Market Size, By Region, 2013�2020 (USD Million)
Table 65 Epoxy Market Size, By Region, 2013�2020 (Kiloton)
Table 66 Asia-Pacific: Epoxy Market Size, By Country, 2013�2020 (USD Million)
Table 67 Asia-Pacific: Market Size, By Country, 2013�2020 (Kiloton)
Table 68 Asia-Pacific: Market Size, By Type, 2013�2020 (USD Million)
Table 69 Asia-Pacific: Market Size, By Type, 2013�2020 (Kiloton)
Table 70 Asia-Pacific: Market Size, By Application, 2013�2020 (USD Million)
Table 71 Asia-Pacific: Market Size, By Application, 2013�2020 (Kiloton)
Table 72 Asia-Pacific: Market Size in Coatings, By Sub-Application, 2013�2020 (USD Million)
Table 73 Asia-Pacific: Market Size in Coatings, By Sub-Application, 2013�2020 (Kiloton)
Table 74 Asia-Pacific: Market Size in Adhesives, By Sub-Application, 2013�2020 (USD Million)
Table 75 Asia-Pacific: Market Size in Adhesives, By Sub-Application, 2013�2020 (Kiloton)
Table 76 Asia-Pacific: Market Size in Composites, By Sub-Application, 2013�2020 (USD Million)
Table 77 Asia-Pacific: Market Size in Composites, By Sub-Application, 2013�2020 (Kiloton)
Table 78 Asia-Pacific: Market Size in Coatings, By Type, 2013�2020 (USD Million)
Table 79 Asia-Pacific: Market Size in Coatings, By Type, 2013�2020 (Kiloton)
Table 80 Asia-Pacific: Market Size in Adhesives, By Type, 2013�2020 (USD Million)
Table 81 Asia-Pacific: Market Size in Adhesives, By Type, 2013�2020 (Kiloton)
Table 82 Asia-Pacific: Market Size in Composites, By Type, 2013�2020 (USD Million)
Table 83 Asia-Pacific: Market Size in Composites, By Type, 2013�2020 (Kiloton)
Table 84 Asia-Pacific: Liquid Epoxy Market Size in Coatings, By Sub-Application, 2013�2020 (USD Million)
Table 85 Asia-Pacific: Market Size in Coatings, By Sub-Application, 2013�2020 (Kiloton)
Table 86 Asia-Pacific: Market Share in Adhesives, By Sub-Application, 2013�2020 (USD Million)
Table 87 Asia-Pacific: Market Share in Adhesives, By Sub-Application, 2013�2020 (Kiloton)
Table 88 Asia-Pacific: Market Share in Composites, By Sub-Application, 2013�2020 (USD Million)
Table 89 Asia-Pacific: Market Share in Composites, By Sub-Application, 2013�2020 (Kiloton)
Table 90 Asia-Pacific: Solid Epoxy Market Share in Coatings, By Sub-Application, 2013�2020 (USD Million)
Table 91 Asia-Pacific: Market Share in Coatings, By Sub-Application, 2013�2020 (Kiloton)
Table 92 Asia-Pacific: Market Share in Adhesives, By Sub-Application, 2013�2020 (USD Million)
Table 93 Asia-Pacific: Market Share in Adhesives, By Sub-Application, 2013�2020 (Kiloton)
Table 94 Asia-Pacific: Market Share in Composites, By Sub-Application, 2013�2020 (USD Million)
Table 95 Asia-Pacific: Market Share in Composites, By Sub-Application, 2013�2020 (Kiloton)
Table 96 Asia-Pacific: Market Share in Coatings, By Sub-Application, 2013�2020 (USD Million)
Table 97 Asia-Pacific: Market Share in Coatings, By Sub-Application, 2013�2020 (Kiloton)
Table 98 Asia-Pacific: Solution Epoxy Market Share in Adhesives, By Sub-Application, 2013�2020 (USD Million)
Table 99 Asia-Pacific: Market Share in Adhesives, By Sub-Application, 2013�2020 (Kiloton)
Table 100 Asia-Pacific: Market Share in Composites, By Sub-Application, 2013�2020 (USD Million)
Table 101 Asia-Pacific: Market Share in Composites, By Sub-Application, 2013�2020 (Kiloton)
Table 102 China: Epoxy Market Size, 2013�2020 in (USD Million) & (Kiloton)
Table 103 Japan: Epoxy Market Size, 2013�2020 in (USD Million) & (Kiloton)
Table 104 India: Epoxy Market Size, 2013�2020 in (USD Million) & (Kiloton)
Table 105 Rest of Asia-Pacific: Epoxy Market Size, 2013�2020 in (USD Million) & (Kiloton)
Table 106 North America: Epoxy Market Size, By Country, 2013�2020 (USD Million)
Table 107 North America: Market Size, By Country, 2013�2020 (Kiloton)
Table 108 North America: Market Size, By Type, 2013�2020 (USD Million)
Table 109 North America: Market Size, By Type, 2013�2020 (Kiloton)
Table 110 North America: Market Size, By Application, 2013�2020 (USD Million)
Table 111 North America: Market Size, By Application, 2013�2020 (Kiloton)
Table 112 North America: Market Size in Coatings, By Sub-Application, 2013�2020 (USD Million)
Table 113 North America: Market Size in Coatings, By Sub-Application, 2013�2020 (Kiloton)
Table 114 North America: Market Size in Adhesives, By Sub-Application, 2013�2020 (USD Million)
Table 115 North America: Market Size in Adhesives, By Sub-Application, 2013�2020 (Kiloton)
Table 116 North America: Market Size in Composites, By Sub-Application, 2013�2020 (USD Million)
Table 117 North America: Market Size in Composites, By Sub-Application, 2013�2020 (Kiloton)
Table 118 North America: Market Size in Coatings, By Type, 2013�2020 (USD Million)
Table 119 North America: Market Size in Coatings, By Type, 2013�2020 (Kiloton)
Table 120 North America: Market Size in Adhesives, By Type, 2013�2020 (USD Million)
Table 121 North America: Market Size in Adhesives, By Type, 2013�2020 (Kiloton)
Table 122 North America: Market Size in Composites, By Type, 2013�2020 (USD Million)
Table 123 North America: Market Size in Composites, By Type, 2013�2020 (Kiloton)
Table 124 North America: Liquid Epoxy Market Size in Coatings, By Sub-Application, 2013�2020 (USD Million)
Table 125 North America: Market Size in Coatings By Sub-Application, 2013�2020 (Kiloton)
Table 126 North America: Market Size in Adhesives, By Sub-Application, 2013�2020 (USD Million)
Table 127 North America: Market Size in Adhesives, By Sub-Application, 2013�2020 (Kiloton)
Table 128 North America: Market Size in Composites, By Sub-Application, 2013�2020 (USD Million)
Table 129 North America: Market Size in Composites, By Sub-Application, 2013�2020 (Kiloton)
Table 130 North America: Solid Epoxy Market Size in Coatings, By Sub-Application, 2013�2020 (USD Million)
Table 131 North America: Market Size in Coatings, By Sub-Application, 2013�2020 (Kiloton)
Table 132 North America: Market Size in Adhesives, By Sub-Application, 2013�2020 (USD Million)
Table 133 North America: Market Size in Adhesives, By Sub-Application, 2013�2020 (Kiloton)
Table 134 North America: Market Size in Composites, By Sub-Application, 2013�2020 (USD Million)
Table 135 North America: Market Size in Composites, By Sub-Application, 2013�2020 (Kiloton)
Table 136 North America: Solution Epoxy Market Size in Coatings, By Sub-Application, 2013�2020 (USD Million)
Table 137 North America: Market Size in Coatings, By Sub-Application, 2013�2020 (Kiloton)
Table 138 North America: Market Size in Adhesives, By Sub-Application, 2013�2020 (USD Million)
Table 139 North America: Market Size in Adhesives, By Sub-Application, 2013�2020 (Kiloton)
Table 140 North America: Market Size in Composites, By Sub-Application, 2013�2020 (USD Million)
Table 141 North America: Market Size in Composites, By Sub-Application, 2013�2020 (Kiloton)
Table 142 U.S.: Epoxy Market Size, 2013�2020 in (USD Million) & (Kiloton)
Table 143 Canada: Epoxy Market Size, 2013�2020
Table 144 Mexico: Epoxy Market Size, 2013�2020 in (USD Million) & (Kiloton)
Table 145 Europe: Epoxy Market Size, By Country, 2013�2020 (USD Million)
Table 146 Europe: Market Size, By Country, 2013�2020 (Kiloton)
Table 147 Europe: Market Size, By Type, 2013�2020 (USD Million)
Table 148 Europe: Market Size, By Type, 2013�2020 (Kiloton)
Table 149 Europe: Market Size, By Application, 2013�2020 (USD Million)
Table 150 Europe: Market Size, By Application, 2013�2020 (Kiloton)
Table 151 Europe: Market Size in Coatings, By Sub-Application, 2013�2020 (USD Million)
Table 152 Europe: Market Size in Coatings, By Sub-Application, 2013�2020 (Kiloton)
Table 153 Europe: Market Size in Adhesive,By Sub-Application, 2013�2020 (USD Million)
Table 154 Europe: Market Size in Adhesive, By Sub-Application, 2013�2020 (Kiloton)
Table 155 Europe: Market Size in Composite, By Sub-Application, 2013�2020 (USD Million)
Table 156 Europe: Market Size in Composite, By Sub-Application, 2013�2020 (Kiloton)
Table 157 Europe: Market Size in Coatings, By Type, 2013�2020 (USD Million)
Table 158 Europe: Market Size in Coatings, By Type, 2013�2020 (Kiloton)
Table 159 Europe: Market Size in Adhesives, By Type, 2013�2020 (USD Million)
Table 160 Europe: Market Size in Adhesives, By Type, 2013�2020 (Kiloton)
Table 161 Europe: Market Size in Composites, By Type, 2013�2020 (USD Million)
Table 162 Europe: Market Size in Composites, By Type, 2013�2020 (Kiloton)
Table 163 Europe: Liquid Epoxy Market Size in Coatings, By Sub-Application, 2013�2020 (USD Million)
Table 164 Europe: Market Size in Coatings, By Sub-Application, 2013�2020 (Kiloton)
Table 165 Europe: Market Size in Adhesive, By Sub-Application, 2013�2020 (USD Million)
Table 166 Europe: Market Size in Adhesive, By Sub-Application, 2013�2020 (Kiloton)
Table 167 Europe: Market Size in Composites, By Sub-Application, 2013�2020 (USD Million)
Table 168 Europe: Market Size in Composites, By Sub-Application, 2013�2020 (Kiloton)
Table 169 Europe: Solid Epoxy Market Size in Coatings, By Sub-Application, 2013�2020 (USD Million)
Table 170 Europe: Market Size in Coatings, By Sub-Application, 2013�2020 (Kiloton)
Table 171 Europe: Market Size in Adhesives, By Sub-Application, 2013�2020 (USD Million)
Table 172 Europe: Market Size in Adhesives, By Sub-Application, 2013�2020 (Kiloton)
Table 173 Europe: Market Size in Composites, By Sub-Application, 2013�2020 (USD Million)
Table 174 Europe: Market Size in Composites, By Sub-Application, 2013�2020 (Kiloton)
Table 175 Europe: Solution Epoxy Market Size Coatings, By Sub-Application, 2013�2020 (USD Million)
Table 176 Europe: Market Size in Coatings, By Sub-Application, 2013�2020 (Kiloton)
Table 177 Europe: Market Size in Adhesives, By Sub-Application, 2013�2020 (USD Million)
Table 178 Europe: Market Size in Adhesives, By Sub-Application, 2013�2020 (Kiloton)
Table 179 Europe: Market Size in Composites, By Sub-Application, 2013�2020 (USD Million)
Table 180 Europe: Market Size in Composites, By Sub-Application, 2013�2020 (Kiloton)
Table 181 Germany: Epoxy Market Size, 2013�2020 (USD Million) and (Kiloton)
Table 182 France: Epoxy Market Size, 2013�2020 (USD Million)
Table 183 U.K.: Epoxy Market Size, 2013�2020 (USD Million)
Table 184 Italy: Epoxy Market Size, 2013�2020 (USD Million)
Table 185 Rest of Europe: Epoxy Market Size, 2013�2020 (USD Million)
Table 186 RoW: Epoxy Market Size, By Country, 2013�2020 (USD Million)
Table 187 RoW: Market Size, By Country, 2013�2020 (Kiloton)
Table 188 RoW: Market Size, By Type, 2013�2020 (USD Million)
Table 189 RoW: Market Size, By Type, 2013�2020 (Kiloton)
Table 190 RoW: Market Size, By Application, 2013�2020 (USD Million)
Table 191 RoW: Market Size, By Application, 2013�2020 (Kiloton)
Table 192 RoW: Market Size in Coatings, By Sub-Application, 2013�2020 (USD Million)
Table 193 RoW: Market Size in Coatings, By Sub-Application, 2013�2020 (Kiloton)
Table 194 RoW: Market Size in Adhesives, By Sub-Application, 2013�2020 (USD Million)
Table 195 RoW: Market Size in Adhesives, By Sub-Application, 2013�2020 (Kiloton)
Table 196 RoW: Market Size in Composites, By Sub-Application, 2013�2020 (USD Million)
Table 197 RoW: Market Size in Composites, By Sub-Application, 2013�2020 (Kiloton)
Table 198 RoW: Market Size in Coatings, By Type, 2013�2020 (USD Million)
Table 199 RoW: Market Size in Coatings, By Type, 2013�2020 (Kiloton)
Table 200 RoW: Market Size in Adhesives, By Type, 2013�2020 (USD Million)
Table 201 RoW: Market Size in Adhesives, By Type, 2013�2020 (Kiloton)
Table 202 RoW: Market Size in Composites, By Type, 2013�2020 (USD Million)
Table 203 RoW: Market Size in Composites, By Type, 2013�2020 (Kiloton)
Table 204 RoW: Liquid Epoxy Market Size in Coatings,By Sub-Application, 2013�2020 (USD Million)
Table 205 RoW: Market Size in Coatings, By Sub-Application, 2013�2020 (Kiloton)
Table 206 RoW: Market Size in Adhesives, By Sub-Application, 2013�2020 (USD Million)
Table 207 RoW: Market Size in Adhesives, By Sub-Application, 2013�2020 (Kiloton)
Table 208 RoW: Market Size in Composites, By Sub-Application, 2013�2020 (USD Million)
Table 209 RoW: Market Size in Composites, By Sub-Application, 2013�2020 (Kiloton)
Table 210 RoW: Solid Epoxy Market Size in Coatings, By Sub-Application, 2013�2020 (USD Million)
Table 211 RoW: Market Size in Coatings, By Sub-Application, 2013�2020 (Kiloton)
Table 212 RoW: Market Size in Adhesives, By Sub-Application, 2013�2020 (USD Million)
Table 213 RoW: Market Size in Adhesives, By Sub-Application, 2013�2020 (Kiloton)
Table 214 RoW: Market Size in Composites, By Sub-Application, 2013�2020 (USD Million)
Table 215 RoW: Market Size in Composites, By Sub-Application, 2013�2020 (Kiloton)
Table 216 RoW: Solution Epoxy Market Size in Coatings, By Sub-Application, 2013�2020 (USD Million)
Table 217 RoW: Market Size in Coatings, By Sub-Application, 2013�2020 (Kiloton)
Table 218 RoW: Market Size in Adhesives, By Sub-Application, 2013�2020 (USD Million)
Table 219 RoW: Market Size in Adhesives, By Sub-Application, 2013�2020 (Kiloton)
Table 220 RoW: Market Size in Composites, By Sub-Application, 2013�2020 (USD Million)
Table 221 RoW: Market Size in Composites, By Sub-Application, 2013�2020 (Kiloton)
Table 222 Brazil: Epoxy Market Size, 2013�2020 (USD Million & Kiloton)
Table 223 Russia: Epoxy Market Size, 2013�2020 (USD Million & Kiloton)
Table 224 Rest of the Countries: Epoxy Market Size, 2013�2020 (USD Million) & (Kiloton)
Table 225 Rest of the Countries: Epoxy Market Size, 2013�2020 (USD Million) & (Kiloton)
Table 226 Investments & Expansions, 2011�2015
Table 227 New Product Launches, 2011�2015
Table 228 Partnerships, 2011�2015
List of Figures (62 Figures)
Figure 1 Epoxy Market Segmentation
Figure 2 Epoxy Market: Research Design
Figure 3 Data From Secondary Sources
Figure 4 Data From Primary Sources
Figure 5 Breakdown of Primary Interviews
Figure 6 Market Size Estimation: Bottom-Up Approach
Figure 7 Market Size Estimation: Top-Down Approach
Figure 8 Market Breakdown and Data Triangulation
Figure 9 Assumptions in the Research Study
Figure 10 Limitations of the Research Study
Figure 11 Asia-Pacific to Dominate the Global Epoxy Market
Figure 12 Composites Segment Dominated the Epoxy Market in 2015
Figure 13 Composites to Be the Fastest-Growing Application Segment
Figure 14 Asia-Pacific is the Largest Market for Epoxy
Figure 15 Emerging Economies Will Offer Lucrative Growth Potential for Market Players
Figure 16 Solid Epoxy Segment to Witness the Highest CAGR in Epoxy Market
Figure 17 Markets to Grow Faster in Developing Nations Than Developed Ones
Figure 18 Market in Asia-Pacific to Grow Rapidly During the Forecast Period
Figure 19 Composites Segment Accounted for the Largest Share of the Epoxy Market in 2014
Figure 20 China to Dominate the Asia-Pacific Market During the Forecast Period
Figure 21 China and U.S. Accounted for the Largest Share of the Epoxy Market in 2014
Figure 22 Growing End User Demand Across Global Market for Epoxy
Figure 23 Drivers, Restraints, Opportunities, and Challenges
Figure 24 Huge Investment in Infrastructural Development in Emerging Countries
Figure 25 Fluctuations in the Price of Crude Oil May Impact Base Raw Material Prices
Figure 26 Epoxy Value-Chain Analysis
Figure 27 Porter�s Five Forces Analysis
Figure 28 Liquid Epoxys to Dominate the Market Between 2015 and 2020
Figure 29 Asia-Pacific Will Domiate the Global Epoxy Market in 2015
Figure 30 High Growth in Composites Applications Will Continue to Drive the Market
Figure 31 Composites is the Fastest-Growing Application Segment
Figure 32 India, China, Mexico, and Brazil are Emerging as Hotspots in the Global Epoxy Market
Figure 33 Asia-Pacific: Potential Market for Epoxy
Figure 34 Future Growth for Epoxy Applications Centered on Asia-Pacific and RoW
Figure 35 Asia-Pacific: High Growth of Epoxy Market in 2015
Figure 36 Asia-Pacific: the Largest Market for Epoxy in 2015
Figure 37 Asia-Pacific Market Snapshot � Potential Market for Epoxy Manufacturers
Figure 38 North America Market Snapshot: Demand Will Be Driven By End-Use Industries
Figure 39 U.S.: Rise in Manufacturing Activities to Drive the Epoxy Market
Figure 40 Europe: Rise in the Demand for Composites Products to Drive Epoxy Market
Figure 41 Germany: the Biggest Epoxy Market in Europe
Figure 42 Composites Application to Dominate the Epoxy Market in RoW During Forecast Period
Figure 43 Battle for Market Share: Investments & Expansions Was the Key Strategy.
Figure 44 Regional Revenue Mix of Major Market Players
Figure 45 Olin Corporation: Company Snapshot
Figure 46 Olin Corporation: SWOT Analysis
Figure 47 Nan Ya Plastics Corporation: Company Snapshot
Figure 48 Nan Ya Plastic Corporation: SWOT Analysis
Figure 49 Hexion Inc.: Company Snapshot
Figure 50 Hexion Inc.: SWOT Analysis
Figure 51 Kukdo Chemical Co. Ltd.: Company Snapshot
Figure 52 3M Company: Company Snapshot
Figure 53 3M Company: SWOT Analysis
Figure 54 BASF SE: Company Snapshot
Figure 55 BASF SE: SWOT Analysis
Figure 56 Huntsman Corporation: Company Snapshot
Figure 57 Huntsman Corporation: SWOT Analysis
Figure 58 Sinopec Corporation: Company Snapshot
Figure 59 Mitsubishi Chemical Corporation: Company Snapshot
Figure 60 Atul Ltd.: Company Snapshot
Figure 61 Marketsandmarkets Knowledge Store Snapshot
Figure 62 Marketsandmarkets Knowledge Store: Chemicals & Material Industry Snapshot


Growth opportunities and latent adjacency in Epoxy Market