Aluminum Systems Market by Alloy Type (Wrought Aluminum Alloy, Cast Aluminum Alloy), Alloying Element (Silicon, Manganese, Copper, Magnesium), Application (Transportation & Logistics, Packaging, Construction, Electrical &Electronics), & Geography - Global Forecast to 2020


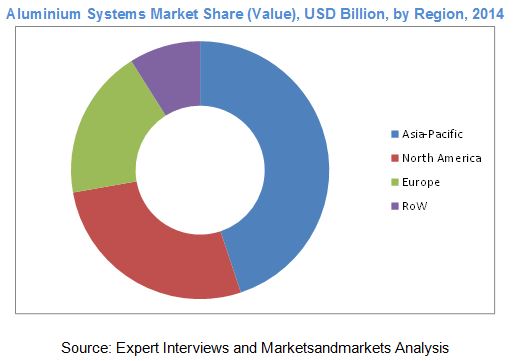
[215 Pages Report] The global market for aluminum systems witnessed a rapid growth in 2013, and is projected to grow at a CAGR of 5.65% from 2015 to 2020, to reach USD 147.13 Billion by 2020. Asia-Pacific dominated the market with a share of 45% in 2014; this market is driven by increasing competition, consumer awareness, rising consumer spending, demand for value-added product, and technological advancements. The Asia-Pacific region is projected to become the fastest-growing market for aluminum systems from 2015 to 2020. Moreover, with increasing awareness about environmental hazards, the market will adopt technologies to develop a sustainable manufacturing process which is environment-friendly. The Asia-Pacific region accounted for around 45% of the total market share in terms of value, followed by the North American and European regions. The aluminum systems market in developing countries such as China and India are estimated to grow at a higher rate from 2015 to 2020. China is estimated to grow faster than any other country because of its strong economic growth along with growing demand from end-user industry and rapid urbanization.
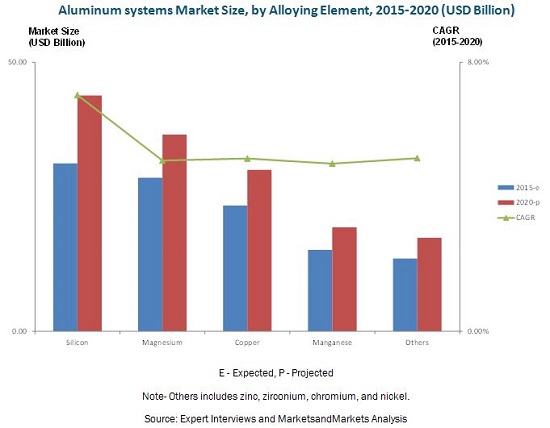
Wrought aluminum alloy accounted for the largest share of 79% of aluminum systems market in 2014. Cast aluminum alloy is projected to be the fastest-growing alloy type segment from 2015 to 2020. Silicon is projected to be the fastest-growing alloying element during the same period. Copper is projected to be the second-fastest growing product type segment from 2015 to 2020. Transportation & logistics accounted for the largest share of aluminum systems market in 2014 due to the rising demand for fuel-efficient vehicles.
This report estimates the market size of the global aluminum systems market in terms of value (USD billion). In this report, the market is segmented based on alloy type, alloying element, application, and region. Market drivers, restraints, challenges, raw materials, and product price trends are discussed in detail. Market share, by participant, for the overall market is also discussed in detail. The global aluminum systems market has grown exponentially in the last few years and this trend is expected to continue.
Scope of the Report
This research study categorizes the global aluminum systems market based on alloy type, alloying element, application, and region:
On the basis of alloy type, the aluminum systems market has been segmented as follows:
- Wrought aluminum alloy
- Cast aluminum alloy
On the basis of alloying element, the aluminum systems market has been segmented as follows:
- Silicon
- Magnesium
- Manganese
- Copper
- Others (zinc)
On the basis of application, the aluminum systems market has been segmented as follows:
- Transportation & Logistics
- Packaging
- Construction
- Electrical & Electronics
- Others (manufactured/machined components)
On the basis of region, the aluminum systems market has been segmented as follows:
- North America
- Europe
- Asia-Pacific
- Rest of the World (RoW)
The aluminum systems market has varied applications such as transportation & logistics, packaging, construction, electrical & electronics, and others (machined/manufactured components). The transportation & logistics segment consume around 42% of the global aluminum systems market in 2014. The construction segment is expected to grow due to improved lifestyle and increase in the disposable incomes of the population in both developed and developing economies. The packaging segment is also one of the major end users of aluminum systems and is expected to witness considerable growth.
The increase in demand for innovative and sustainable aluminum systems production techniques has driven the growth of the aluminum systems market. Growing demand for value-added and recycled products due to the need for reducing the environmental impact of aluminum systems industry has resulted in the increase in the demand for aluminum systems. The growing preference of aluminum systems for sustainable and innovative smelting, mining, mineral recovery, and recycling technology will also drive this market. Silicon is expected to grow due to the demand for improved castability and weldability capabilities from the end-user industries such as transportation & logistics, packaging, construction, and electrical & electronics
The market for aluminum systems is observed to be matured in developing economies such as Europe and North America due to the high disposable incomes of the people in these region. The Asia-Pacific region formed the largest market for aluminum systems, in terms of volume, having accounted for 17,151.5 KT in 2014. North America accounted for the second-largest market with a share of 25% in 2014. The Asia-Pacific region is projected to be the fastest-growing market for aluminum systems from 2015 to 2020. The global market for aluminum systems is projected to grow at a CAGR of 5.65% from 2015 to 2020, and is projected to reach USD 147.13 Billion by 2020.
The aluminum systems market will be driven due to factors such as the increasing demand from the end use industry and technological advancements. The development of economies plays an essential role in increasing the demand for aluminum systems in the global market. The key parameters that determine the growth of aluminum systems in developing economies are increase in consumption and demand for value-added and sustainable products.
The global aluminum systems market is marked with intense competition due to the presence of a large number of both, big and small firms. Investments & expansions and agreements & contracts are the key strategies adopted by market players to ensure their growth in the market. Companies such as United Company Rusal (Russia), Alcoa Inc. (USA), Aluminum Corporation of China (China), Rio Tinto (U.K.), and BHP Billiton (Australia) are some of the prominent companies in the aluminum systems market.
 Exclusive indicates content/data unique to MarketsandMarkets and not available with any competitors.
Table of Contents
1 Introduction (Page No. - 22)
1.1 Objectives of the Study
1.2 Market Definition
1.3 Study Scope
1.3.1 Geographic Scope
1.3.2 Years Considered
1.4 Currency Considered
1.5 Package Size
1.6 Limitations
1.7 Stakeholders
2 Research Methodology (Page No. - 26)
2.1 Research Data
2.1.1 Secondary Data
2.1.1.1 Key Data From Secondary Sources
2.1.2 Primary Data
2.1.2.1 Key Data From Primary Sources
2.1.2.2 Key Industry Insights
2.1.2.2.1 Breakdown of Primaries - By Company Type, Designation & Region
2.2 Factor Analysis
2.2.1 Introduction
2.2.2 Overview of the Parent Industry
2.2.3 Demand-Side Analysis
2.2.3.1 Rising Population
2.2.3.1.1 Increase in Middle-Class Population, 2009-2030
2.2.3.2 Increasing Urban Population
2.2.3.3 Developing Economies, GDP (Purchasing Power Parity), 2013
2.2.4 Supply-Side Analysis
2.2.4.1 Fluctuation in Raw Material Prices
2.2.4.2 Competitive Or Substitute Products
2.2.4.3 Research & Development
2.3 Market Size Estimation
2.4 Market Breakdown and Data Triangulation
2.5 Market Share Estimation
2.6 Research Assumptions and Limitations
3 Executive Summary (Page No. - 40)
3.1 Demand From End-Use Market to Drive Aluminum Systems Market
3.2 Evolution of Aluminum Systems
3.3 Aluminum Systems Market
3.4 Silicon is Widely Used for Making Aluminum Alloys With Improved Castability and Weldability
3.5 Asia-Pacific Market Projected to Grow at the Highest Rate
4 Premium Insights (Page No. - 45)
4.1 Attractive Opportunities in the Aluminum Systems Market
4.2 China is Estimated to Capture the Largest Market Share in the Asia-Pacific Aluminum Systems Market in 2015
4.3 Asia-Pacific Estimated to Dominate the Aluminum Systems Market in 2015, in Terms of Value
4.4 Aluminum Systems Market, By Application, 2015 vs. 2020
4.5 Aluminum Systems Market: Developed vs. Emerging Markets
4.6 Wrought Aluminum Alloy to Be the Largest Segment in the Aluminum Systems Market, 2015 to 2020
4.7 Asia-Pacific Aluminum Systems Market to Grow at the Highest Rate in 2015
4.8 Aluminum Systems Market Life Cycle Analysis, By Region, 2014
5 Market Overview (Page No. - 52)
5.1 Introduction
5.2 the Evolution of Aluminum Systems Market
5.3 Market Segmentation
5.3.1 Aluminum Systems Market, By Alloy Type
5.3.2 Aluminum Systems Market, By Alloying Element
5.3.3 Aluminum Systems Market, By Application
5.4 Market Dynamics
5.4.1 Drivers
5.4.1.1 Growing Demand From End-User Industry
5.4.1.2 Technological Advancements in the Aluminum Systems Industry
5.4.2 Restraints
5.4.2.1 High Initial Capital Investment Required
5.4.2.2 Magnesium Alloy Replacing Aluminum Alloys
5.4.3 Opportunities
5.4.3.1 Growing Demand for Recycled and Value-Added Aluminum Products
5.4.3.2 Demand for Aluminum in Emerging Economies
5.4.4 Challenges
5.4.4.1 Reducing Greenhouse Gas Emissions
5.4.4.2 Fluctuating Raw Material Prices
5.5 Aluminum Systems Market, Price Analysis, 2014
5.5.1 Aluminum Systems Market, By Region, 2014
5.5.2 Aluminum Systems, By Alloy Type, 2014
5.5.3 Aluminum Systems, By Alloying Element, 2014
5.5.4 Aluminum Systems, By Application , 2014
6 Industry Trends (Page No. - 66)
6.1 Introduction
6.2 Value Chain Analysis
6.3 Industry Trends
6.4 Porter’s Five Forces Analysis
6.4.1 Threat of New Entrants
6.4.2 Threat of Substitutes
6.4.3 Bargaining Power of Suppliers
6.4.4 Bargaining Power of Buyers
6.4.5 Intensity of Competitive Rivalry
6.5 Competing Technologies
7 Aluminum Systems Market, By Alloy Type (Page No. - 75)
7.1 Introduction
7.2 Wrought Aluminum Alloy
7.3 Cast Aluminum Alloy
8 Aluminum Systems Market, By Alloying Element (Page No. - 79)
8.1 Introduction
8.2 Silicon
8.3 Magnesium
8.4 Copper
8.5 Manganese
8.6 Other Alloying Elements
9 Aluminum Systems Market, By Application (Page No. - 83)
9.1 Introduction
9.2 Transportation & Logistics
9.2.1 Transportation & Logistics: By Alloy Type
9.2.1.1 Wrought Aluminum Alloy Finds Wide Applications in Transportation & Logistics Segment
9.3 Packaging
9.3.1 Packaging: By Alloy Type
9.3.1.1 Rising Demand for Barrier Resistant in Packaging to Drive the Market for Aluminum Systems
9.4 Construction
9.4.1 Construction: By Alloy Type
9.4.1.1 Cast Aluminum Alloy Projected to Grow at the Highest Rate in Aluminum Systems Market
9.5 Electrical & Electronics
9.5.1 Electrical & Electronics: By Alloy Type
9.5.1.1 Wrought Aluminum Alloys Widely Used in Electrical & Electronics Segment
9.6 Other Applications
9.6.1 Other Applications: By Alloy Type
10 Aluminum Systems Market, By Region (Page No. - 93)
10.1 Introduction
10.2 Geographic Snapshot (2015–2020): Rapidly Growing Markets are Emerging as New Hot Spots
10.3 Top 20 Countries Exporting Raw Aluminum
10.4 Top 20 Countries Importing Raw Aluminum
10.5 Asia-Pacific
10.5.1 Regulations in Asia-Pacific
10.5.2 Asia-Pacific: By Country
10.5.2.1 China and Japan Will See Remarkable Growth in the Aluminum Systems Market
10.5.3 Asia-Pacific: By Alloy Type
10.5.3.1 Rising Demand From End-User Industry is the Main Driving Factor for the Aluminum Systems Market
10.5.4 Asia-Pacific: By Alloying Element
10.5.4.1 Increase in Middle-Class Population to Drive the Market for Aluminum Systems in Asia-Pacific
10.5.5 Asia-Pacific: By Application
10.5.5.1 Construction is the Fastest-Growing Segment in Asia-Pacific
10.5.6 China
10.5.6.1 China: By Alloy Type
10.5.6.1.1 Cast Aluminum Alloy is the Fastest-Growing Segment in China
10.5.6.2 China: By Alloying Element
10.5.6.2.1 Silicon as an Alloying Element Dominated the Aluminum Systems Market in China in 2014
10.5.6.3 China: By Application
10.5.6.3.1 Transportation & Logistics Segment Accounted for the Largest Share in China in 2014
10.5.7 Japan
10.5.7.1 Japan: By Alloy Type
10.5.7.1.1 Wrought Aluminum Alloys Finds Wide Application in Japan’s Aluminum Systems Market
10.5.7.2 Japan: By Alloying Element
10.5.7.2.1 Magnesium as Alloying Element Accounted for the Second-Largest Share in Japan’s Aluminum Systems Market
10.5.7.3 Japan: By Application
10.5.7.3.1 Transportation & Logistics Segment Accounted for the Largest Share in Japan’s Market
10.5.8 India
10.5.8.1 India: By Alloy Type
10.5.8.1.1 Cast Aluminum Alloy Projected to Grow at the Highest CAGR
10.5.8.2 India: By Alloying Element
10.5.8.2.1 Manganese as Alloying Element Projected to Grow at Relatively Lower Rate
10.5.8.3 India: By Applications
10.5.8.4 India: By Application
10.5.8.4.1 Construction Segment Projected to Grow at the Highest Rate
10.5.9 Australia
10.5.9.1 Australia: By Alloy Type
10.5.9.1.1 Wrought Aluminum Alloy Segment Projected to Grow at Relatively Lower Rate
10.5.9.2 Australia: By Alloying Element
10.5.9.2.1 Silicon as an Alloying Element Accounted for the Largest Share of Australian Aluminum Systems Market
10.5.9.3 Australia: By Application
10.5.9.3.1 Electrical & Electronics Segment Projected to Grow at A Lower Rate in Australian Aluminum Systems Market
10.5.10 Rest of Asia-Pacific
10.5.10.1 Rest of Asia-Pacific: By Alloy Type
10.5.10.2 Rest of Asia-Pacific: By Alloying Element
10.5.10.3 Rest of Asia-Pacific: By Application
10.6 North America
10.6.1 Regulations in North America
10.6.3 North America: By Alloy Type
10.6.3.1 Market for Wrought Aluminum Alloy Accounted for the Largest Share in Aluminum Systems Market in North America
10.6.4 North America: By Alloying Element
10.6.4.1 Demand for Improved Castability to Drive the Market for Silicon as Alloying Element in North America
10.6.5 North America: By Application
10.6.5.1 Transportation & Logistics Dominated the North America Aluminum Systems Market
10.6.6 U.S.
10.6.6.2 U.S.: By Alloying Element
10.6.6.2.1 Silicon as Alloying Element to Grow at the Highest CAGR in the U.S. Aluminum Systems Market
10.6.6.3 U.S.: By Application
10.6.6.3.1 Transportation & Logistics Segment to Be the Second Fastest-Growing Market in the U.S.
10.6.7 Canada
10.6.7.2 Canada: By Alloying Element
10.6.7.2.1 Copper as Alloying Element is the Second Fastest-Growing Segment in the Canadian Aluminum Systems Market
10.6.7.3 Canada: By Application
10.6.7.3.1 Construction is the Fastest-Growing Segment in the Canadian Aluminum Systems Market
10.6.8 Mexico
10.6.8.2 Mexico: By Alloying Element
10.6.8.2.1 Silicon as Alloying Element to Be the Fastest-Growing Segment in Mexico Aluminum Systems Market
10.6.8.3 Mexico: By Application
10.6.8.3.1 Transportation & Logistics to Grow at the Second-Highest CAGR in the Aluminum Systems Market in Mexico
10.7 Europe
10.7.1 Regulations in Europe
10.7.3 Europe: By Alloy Type
10.7.3.1 the Wrought Aluminum Alloy Segment is Estimated to Be the Largest in the European Aluminum Systems Market in 2015
10.7.4 Europe: By Alloying Element
10.7.4.1 Silicon as Alloying Element is Projected to Grow at the Highest CAGR From 2015 to 2020
10.7.5 Europe: By Application
10.7.5.1 Rising Income and Continually Improving Standard of Living to Drive the European Aluminum Systems Market
10.7.6 Germany
10.7.6.1 Germany: By Alloy Type
10.7.6.1.1 Cast Aluminum Alloy is Projected to Be the Fastest-Growing Segment in Germany
10.7.6.2 Germany: By Alloying Element
10.7.6.2.1 Copper as Alloying Element Expected to Witness Growth in Germany’s Aluminum Systems Market
10.7.6.3 Germany: By Application
10.7.6.3.1 Construction Segment to Be the Fastest-Growing Segment in Germany
10.7.7 U.K.
10.7.7.1 U.K.: By Alloy Type
10.7.7.1.1 Wrought Aluminum Alloy Accounted for the Largest Share of the Aluminum Systems Market in 2014
10.7.7.2 U.K.: By Alloying Element
10.7.7.2.1 Magnesium as Alloying Element is Projected to Grow at A Considerable Growth Rate in the U.K. Aluminum Systems Market
10.7.7.3 U.K.: , By Application
10.7.7.3.1 Construction to Be the Fastest-Growing Segment in the U.K.
10.7.8 Russia
10.7.8.1 Russia: By Market Size, By Alloy Type
10.7.8.1.1 Wrought Aluminum Alloy Dominated the Aluminum Systems Market in the U.K.
10.7.8.2 Russia: By Market Size, By Alloying Element
10.7.8.2.1 Silicon as Alloying Element Projected to Grow at the Highest CAGR From 2015 to 2020
10.7.8.3 Russia: By Market Size, By Application
10.7.8.3.1 Packaging Segment Projected to Grow at A Considerable Rate
10.7.9 France
10.7.9.1 France:By Market Size, By Alloy Type
10.7.9.1.1 Wrought Aluminum Accounted for the Largest Share in France in 2014
10.7.9.2 France: By Market Size, By Alloying Element
10.7.9.2.1 Manganese as Alloying Element Projected to Grow at A Comparatively Lower Rate in France
10.7.9.3 France: By Market Size, By Application
10.7.9.3.1 Construction Segment Projected to Witness the Highest Growth in France
10.7.10 Rest of Europe
10.7.10.2 Rest of Europe: By Market Size, By Alloying Element
10.7.10.3 Rest of Europe: By Market Size, By Application
10.8 Rest of the World
10.8.1 Regulations in Rest of the World
10.8.3.1 Wrought Aluminum Alloy Segment to Grow at A Considerable Rate in the RoW Market
10.8.4 RoW: Aluminum Systems Market, By Alloying Element
10.8.4.1 Silicon as Alloying Element to Grow at the Highest CAGR From 2015 to 2020
10.8.5 RoW: Aluminum Systems Market, By Application
10.8.5.1 Electrical & Electronics Segment Projected to Grow at A Relatively Low CAGR From 2015 to 2020
10.8.6 Brazil
10.8.6.1 Demand From End-Use Market is Projected to Drive the Cast Aluminum Alloy Market in Brazil
10.8.6.2 Brazil: Aluminum Systems Market, By Alloying Element
10.8.6.2.1 Manganese as Alloying Element Segment Projected to Grow at A Lower Rate
10.8.6.3 Brazil: Aluminum Systems Market, By Application
10.8.6.3.1 Demand for Fuel Efficiency Projected to Drive Transportation & Logistics Segment in Brazil
10.8.7 Argentina
10.8.7.1 Argentina: Aluminum Systems Market, By Alloy Type
10.8.7.1.1 Wrought Aluminum Alloy Segment Accounted for the Largest Share in Argentina in 2014
10.8.7.2 Argentina: Aluminum Systems Market, By Alloying Element
10.8.7.2.1 Magnesium as Alloying Element Accounted for the Second-Largest Share in Argentina in 2014
10.8.7.3 Argentina: Aluminum Systems Market, By Application
10.8.7.3.1 Construction Segment Projected to Grow at the Highest Rate in Argentina
10.8.8 South Africa
10.8.8.1 South Africa: Aluminum Systems Market, By Alloy Type
10.8.8.1.1 Cast Aluminum Alloy Segment Projected to Grow at the Highest Rate in South Africa
10.8.8.2 South Africa: Aluminum Systems Market, By Alloying Element
10.8.8.2.1 Silicon as Alloying Element Accounted for the Largest Share in South Africa
10.8.8.3 South Africa: Aluminum Systems Market, By Application
10.8.8.3.1 Electrical & Electronics Segment Projected to Witness Lower Growth Rate
10.8.9 Others in RoW
10.8.9.1 Others in RoW: Aluminum Systems Market, By Alloy Type
10.8.9.2 Others in RoW: Aluminum Systems Market, By Alloying Element
10.8.9.3 Others in RoW: Aluminum Systems Market, By Application
11 Competitive Landscape (Page No. - 176)
11.1 Overview
11.1.1 Investments & Expansions and Contracts & Agreements Was the Key Growth Strategy
11.2 Key Players of Aluminum Systems Market
11.3 Competitive Situations & Trends
11.4 Investments & Expansions: the Key Strategy, 2014
11.4.1 Investments & Expansions
11.4.2 Partnerships, Agreements & Contracts
11.4.3 Mergers & Acquisitions
11.4.4 New Product Launches & Technological Advancements
11.5 Innovation Spotlight
12 Company Profiles (Page No. - 185)
12.1 Introduction
12.2 United Company Rusal
12.2.1 Business Overview
12.2.2 Products Offered
12.2.3 Recent Developments
12.2.4 MnM View
12.2.4.1 SWOT Analysis
12.2.4.2 188
12.3 Alcoa Inc.
12.3.1 Business Overview
12.3.2 Products Offered
12.3.3 Recent Developments
12.3.4 MnM Analysis
12.3.4.1 SWOT Analysis
12.4 Aluminum Corporation of China Limited
12.4.1 Business Overview
12.4.2 Products
12.4.3 Recent Developments
12.4.4 MnM View
12.4.4.1 SWOT Analysis
12.5 Rio Tinto
12.5.1 Business Overview
12.5.2 Products Offered
12.5.3 Recent Developments
12.5.4 MnM View
12.5.4.1 SWOT Analysis
12.6 BHP Billiton Group
12.6.1 Business Overview
12.6.2 Products Offered
12.6.3 Recent Developments
12.6.4 MnM View
12.6.4.1 SWOT Analysis
12.7 Norsk Hydro Asa
12.7.1 Business Overview
12.7.2 Products Offered
12.7.3 Recent Developments
12.8 Century Aluminum Company
12.8.1 Business Overview
12.8.2 Products Offered
12.8.3 Recent Developments
12.9 China Hongquiao Group Limited
12.9.1 Business Overview
12.9.2 Products Offered
12.9.3 Recent Developments
12.10 Aluminum Bahrain B.S.C.
12.10.1 Business Overview
12.10.2 Product Offered
12.10.3 Recent Developments
12.11 Hindalco Indsutries Limited
12.11.1 Business Overview
12.11.2 Products Offered
12.11.3 Recent Developments
13 Appendix (Page No. - 209)
13.1 Insights of Industry Experts
13.2 Discussion Guide
13.3 Introducing RT:Real Time Market Intelligence
13.4 Available Customizations
13.5 Related Reports
List of Tables (168 Tables)
Table 1 Asia-Pacific: Urbanization Prospects
Table 2 Aluminum Systems Market, By Alloy Type
Table 3 Aluminum Systems Market, By Alloying Element
Table 4 Aluminum Systems Market, By Application
Table 5 Growing Demand From End-Use Industry has Played A Major Role in Driving the Growth of the Aluminum Systems Market
Table 6 High Initial Capital Investment is A Key Restraining Factor for the Aluminum Systems Market
Table 7 Growing Demand for Recycled and Value-Added Products is the Key Opportunity for the Aluminum Systems Market
Table 8 Challenges in Reducing Greenhouse Gas Emissions
Table 9 Competing Technologies
Table 10 Aluminum Systems Market Size, By Alloy Type, 2013–2020 (USD Million)
Table 11 Aluminum Systems Market Size, By Alloy Type, 2013–2020 (KT)
Table 12 Aluminum Systems Market Size, By Alloying Element, 2013–2020 (USD Million)
Table 13 Aluminum Systems Market Size, By Alloying Element, 2013–2020 (KT)
Table 14 Aluminum Systems Market Size, By Application,2013–2020 (USD Million)
Table 15 Aluminum Systems Market Size, By Application, 2013–2020 (KT)
Table 16 Aluminum Systems Market Size for Transportation & Logistics, By Alloy Type, 2013–2020 (USD Billion)
Table 17 Aluminum Systems Market Size for Transportation & Logistics, By Alloy Type, 2013–2020 (KT)
Table 18 Aluminum Systems Market Size for Packaging, By Alloy Type, 2013–2020 (USD Billion)
Table 19 Aluminum Systems Market Size for Packaging, By Alloy Type, 2013–2020 (KT)
Table 20 Aluminum Systems Market Size for Construction, By Alloy Type, 2013–2020 (USD Billion)
Table 21 Aluminum Systems Market Size for Construction, By Alloy Type, 2013–2020 (KT)
Table 22 Aluminum Systems Market Size for Electrical & Electronics, By Alloy Type, 2013–2020 (USD Billion)
Table 23 Aluminum Systems Market Size for Electrical & Electronics, By Alloy Type, 2013–2020 (KT)
Table 24 Aluminum Systems Market Size for Other Applications, By Alloy Type, 2013–2020 (USD Billion)
Table 25 Aluminum Systems Market Size for Other Applications, By Alloy Type, 2013–2020 (KT)
Table 26 Top 20 Raw Aluminum Exporting Countries
Table 27 Top 20 Raw Aluminum Importing Countries
Table 28 Aluminum Systems Market Size, By Region, 2013–2020 (USD Million)
Table 29 Aluminum Systems Market Size, By Region, 2013–2020 (KT)
Table 30 Asia-Pacific: Aluminum Systems Market Size, By Country, 2013–2020 (USD Million)
Table 31 Asia-Pacific: Aluminum Systems Market Size, By Country, 2013–2020 (KT)
Table 32 Asia-Pacific: Aluminum Systems Market Size, By Alloy Type, 2013–2020 (USD Million)
Table 33 Asia-Pacific: Aluminum Systems Market Size, By Alloy Type, 2013–2020 (KT)
Table 34 Asia-Pacific: Aluminum Systems Market Size, By Alloying Element, 2013–2020 (USD Million)
Table 35 Asia-Pacific: Aluminum Systems Market Size, By Alloying Element, 2013–2020 (KT)
Table 36 Asia-Pacific: Aluminum Systems Market Size, By Application, 2013–2020 (USD Million)
Table 37 Asia-Pacific: Aluminum Systems Market Size, By Application, 2013–2020 (KT)
Table 38 China: Aluminum Systems Market Size, By Alloy Type, 2013–2020 (USD Million)
Table 39 China: Aluminum Systems Market Size, By Alloy Type, 2013–2020 (KT)
Table 40 China: Aluminum Systems Market Size, By Alloying Element, 2013–2020 (USD Million)
Table 41 China: Aluminum Systems Market Size, By Alloying Element, 2013–2020 (KT)
Table 42 China: Aluminum Systems Market Size, By Application, 2013–2020 (USD Million)
Table 43 China: Aluminum Systems Market Size, By Application, 2013–2020 (KT)
Table 44 Japan: Aluminum Systems Market Size, By Alloy Type, 2013–2020 (USD Million)
Table 45 Japan: Aluminum Systems Market Size, By Alloy Type, 2013–2020 (KT)
Table 46 Japan: Aluminum Systems Market Size, By Alloying Element, 2013–2020 (USD Million)
Table 47 Japan: Aluminum Systems Market Size, By Alloying Element, 2013–2020 (KT)
Table 48 Japan: Aluminum Systems Market Size, By Application, 2013–2020 (USD Million)
Table 49 Japan: Aluminum Systems Market Size, By Application, 2013–2020 (KT)
Table 50 India: Aluminum Systems Market Size, By Alloy Type, 2013–2020 (USD Million)
Table 51 India: Aluminum Systems Market Size, By Alloy Type, 2013–2020 (KT)
Table 52 India: Aluminum Systems Market Size, By Alloying Element, 2013–2020 (USD Million)
Table 53 India: Aluminum Systems Market Size, By Alloying Element, 2013–2020 (KT)
Table 54 India: Aluminum Systems Market Size, By Application, 2013–2020 (USD Million)
Table 55 India: Aluminum Systems Market Size, By Application, 2013–2020 (KT)
Table 56 Australia: Aluminum Systems Market Size, By Alloy Type, 2013–2020 (USD Million)
Table 57 Australia: Aluminum Systems Market Size, By Alloy Type, 2013–2020 (KT)
Table 58 Australia: Aluminum Systems Market Size, By Alloying Element, 2013–2020 (USD Million)
Table 59 Australia: Aluminum Systems Market Size, By Alloying Element, 2013–2020 (KT)
Table 60 Australia: Aluminum Systems Market Size, By Application, 2013–2020 (USD Million)
Table 61 Australia: Aluminum Systems Market Size, By Application, 2013–2020 (KT)
Table 62 Rest of Asia-Pacific: Aluminum Systems Market Size, By Alloy Type, 2013–2020 (USD Million)
Table 63 Rest of Asia-Pacific: Aluminum Systems Market Size, By Alloy Type, 2013–2020 (KT)
Table 64 Rest of Asia-Pacific: Aluminum Systems Market Size, By Alloying Element, 2013–2020 (USD Million)
Table 65 Rest of Asia-Pacific: Aluminum Systems Market Size, By Alloying Element, 2013–2020 (KT)
Table 66 Rest of Asia-Pacific: Aluminum Systems Market Size, By Application, 2013–2020 (USD Million)
Table 67 Rest of Asia-Pacific: Aluminum Systems Market Size, By Application, 2013–2020 (KT)
Table 68 North America: Aluminum Systems Market Size, By Country, 2013–2020 (USD Million)
Table 69 North America: Aluminum Systems Market Size, By Country, 2013–2020 (KT)
Table 70 North America: Aluminum Systems Market Size, By Alloy Type, 2013–2020 (USD Million)
Table 71 North America: Aluminum Systems Market Size, By Alloy Type, 2013–2020 (KT)
Table 72 North America: Aluminum Systems Market Size, By Alloying Element, 2013–2020 (USD Million)
Table 73 North America: Aluminum Systems Market Size, By Alloying Element, 2013–2020 (KT)
Table 74 North America: Aluminum Systems Market Size, By Application, 2013–2020 (USD Million)
Table 75 North America: Aluminum Systems Market Size, By Application, 2013–2020 (KT)
Table 76 U.S.: Aluminum Systems Market Size, By Alloy Type, 2013–2020 (USD Million)
Table 77 U.S.: Aluminum Systems Market Size, By Alloy Type, 2013–2020 (KT)
Table 78 U.S.: Aluminum Systems Market Size, By Alloying Element, 2013–2020 (USD Million)
Table 79 U.S.: Aluminum Systems Market Size, By Alloying Element, 2013–2020 (KT)
Table 80 U.S.: Aluminum Systems Market Size, By Application, 2013–2020 (USD Million)
Table 81 U.S.: Aluminum Systems Market Size, By Application, 2013–2020 (KT)
Table 82 Canada: Aluminum Systems Market Size, By Alloy Type , 2013–2020 (USD Million)
Table 83 Canada: Aluminum Systems Market Size, By Alloy Type , 2013–2020 (KT)
Table 84 Canada: Aluminum Systems Market Size, By Alloying Element , 2013–2020 (USD Million)
Table 85 Canada: Aluminum Systems Market Size, By Alloying Element, 2013–2020 (KT)
Table 86 Canada: Aluminum Systems Market Size, By Application, 2013–2020 (USD Million)
Table 87 Canada: Aluminum Systems Market Size, By Application, 2013–2020 (KT)
Table 88 Mexico: Aluminum Systems Market Size, Byalloy Type, 2013–2020 (USD Million)
Table 89 Mexico: Aluminum Systems Market Size, Byalloy Type, 2013–2020 (KT)
Table 90 Mexico: Aluminum Systems Market Size, By Alloying Element, 2013–2020 (USD Million)
Table 91 Mexico: Aluminum Systems Market Size, By Alloying Element, 2013–2020 (KT)
Table 92 Mexico: Aluminum Systems Market Size, By Application, 2013–2020 (USD Million)
Table 93 Mexico: Aluminum Systems Market Size, By Application, 2013–2020 (KT)
Table 94 Europe: Aluminum Systems Market Size, By Country, 2013–2020 (USD Million)
Table 95 Europe: Aluminum Systems Market Size, By Country, 2013–2020 (KT)
Table 96 Europe: Aluminum Systems Market Size, By Alloy Type, 2013–2020 (USD Million)
Table 97 Europe: Aluminum Systems Market Size, By Alloy Type, 2013–2020 (KT)
Table 98 Europe: Aluminum Systems Market Size, By Alloying Element, 2013–2020 (USD Million)
Table 99 Europe: Aluminum Systems Market Size, By Alloying Element, 2013–2020 (KT)
Table 100 Europe: Aluminum Systems Market Size, By Application, 2013–2020 (USD Million)
Table 101 Europe: Aluminum Systems Market Size, By Application, 2013–2020 (KT)
Table 102 Germany: Aluminum Systems Market Size, By Alloy Type, 2013–2020 (USD Million)
Table 103 Germany: Aluminum Systems Market Size, By Alloy Type, 2013–2020 (KT)
Table 104 Germany: Aluminum Systems Market Size, By Alloying Element, 2013–2020 (USD Million)
Table 105 Germany: Aluminum Systems Market Size, By Alloying Element, 2013–2020 (KT)
Table 106 Germany: Aluminum Systems Market Size, By Application, 2013–2020 (USD Million)
Table 107 Germany: Aluminum Systems Market Size, By Application, 2013–2020 (KT)
Table 108 U.K.: Aluminum Systems Market Size, By Alloy Type, 2013–2020 (USD Million)
Table 109 U.K.: Aluminum Systems Market Size, By Alloy Type, 2013–2020 (KT)
Table 110 U.K.: Aluminum Systems Market Size, By Alloying Element, 2013–2020 (USD Million)
Table 111 U.K.: Aluminum Systems Market Size, By Alloying Element, 2013–2020 (KT)
Table 112 U.K.: Aluminum Systems Market Size, By Application, 2013–2020 (USD Million)
Table 113 U.K.: Aluminum Systems Market Size, , By Application, 2013–2020 (KT)
Table 114 Russia: By Market Size, By Alloy Type, 2013–2020 (USD Million)
Table 115 Russia: By Market Size, By Alloy Type, 2013–2020 (KT)
Table 116 Russia: By Market Size, By Alloying Element, 2013–2020 (USD Million)
Table 117 Russia: By Market Size, By Alloying Element, 2013–2020 (KT)
Table 118 Russia: By Market Size, By Application, 2013–2020 (USD Million)
Table 119 Russia: By Market Size, By Application, 2013–2020 (KT)
Table 120 France: By Market Size, By Alloy Type, 2013–2020 (USD Million)
Table 121 France: By Market Size, By Alloy Type, 2013–2020 (KT)
Table 122 France: By Market Size, By Alloying Element, 2013–2020 (USD Million)
Table 123 France: By Market Size, By Alloying Element, 2013–2020 (KT)
Table 124 France: By Market Size, By Application, 2013–2020 (USD Million)
Table 125 France: By Market Size, By Application, 2013–2020 (KT)
Table 126 Rest of Europe: By Market Size, By Alloy Type, 2013–2020 (USD Million)
Table 127 Rest of Europe: By Market Size, By Alloy Type, 2013–2020 (KT)
Table 128 Rest of Europe: By Market Size, By Alloying Element, 2013–2020 (USD Million)
Table 129 Rest of Europe: By Market Size, By Alloying Element, 2013–2020 (KT)
Table 130 Rest of Europe: By Market Size, By Application, 2013–2020 (USD Million)
Table 131 Rest of Europe: By Market Size, By Application, 2013–2020 (KT)
Table 132 RoW: By Market Size, By Country, 2013–2020 (USD Million)
Table 133 RoW: By Market Size, By Country, 2013–2020 (KT)
Table 134 RoW: By Size, By Alloy Type, 2013–2020 (USD Million)
Table 135 RoW: By Market Size, By Alloy Type, 2013–2020 (KT)
Table 136 RoW: By Market Size, By Alloying Element, 2013–2020 (USD Million)
Table 137 RoW: By Market Size, By Alloying Element, 2013–2020 (KT)
Table 138 RoW: By Market Size, By Application, 2013–2020 (USD Million)
Table 139 RoW: By Market Size, By Application, 2013–2020 (KT)
Table 140 Brazil: By Market Size, By Alloy Type, 2013–2020 (USD Million)
Table 141 Brazil: By Market Size, By Alloy Type, 2013–2020 (KT)
Table 142 Brazil: By Market Size, By Alloying Element, 2013–2020 (USD Million)
Table 143 Brazil: By Market Size, By Alloying Element, 2013–2020 (KT)
Table 144 Brazil: By Market Size, By Application, 2013–2020 (USD Million)
Table 145 Brazil: By Market Size, By Application, 2013–2020 (KT)
Table 146 Argentina: By Market Size, By Alloy Type, 2013–2020 (USD Million)
Table 147 Argentina: By Market Size, By Alloy Type, 2013–2020 (KT)
Table 148 Argentina: By Market Size, By Alloying Element, 2013–2020 (USD Million)
Table 149 Argentina: By Market Size, By Alloying Element, 2013–2020 (KT)
Table 150 Argentina: By Market Size, By Application, 2013–2020 (USD Million)
Table 151 Argentina: By Market Size, By Application, 2013–2020 (KT)
Table 152 South Africa: By Market Size, By Alloy Type, 2013–2020 (USD Million)
Table 153 South Africa: By Market Size, By Alloy Type, 2013–2020 (KT)
Table 154 South Africa: By Market Size, By Alloying Element, 2013–2020 (USD Million)
Table 155 South Africa: By Size, By Alloying Element, 2013–2020 (KT)
Table 156 South Africa: By Size, By Application, 2013–2020 (USD Million)
Table 157 South Africa: By Market Size, By Application, 2013–2020 (KT)
Table 158 Others in RoW: By Market Size, By Alloy Type, 2013–2020 (USD Million)
Table 159 Others in RoW: By Market Size, By Alloy Type, 2013–2020 (KT)
Table 160 Others in RoW: By Market Size, By Alloying Element, 2013–2020 (USD Million)
Table 161 Others in RoW: By Market Size, By Alloying Element, 2013–2020 (KT)
Table 162 Others in RoW: By Market Size, By Application, 2013–2020 (USD Million)
Table 163 Others in RoW: By Market Size, By Application, 2013–2020 (KT)
Table 164 Investment & Expansions, 2011–2015
Table 165 Partnerships, Agreements, and Contracts, 2011–2015
Table 166 Mergers & Acquisitions, 2011–2015
Table 167 New Product Launches & Technological Advancements, 2011–2015
Table 168 Innovation Spotlight, 2011–2015
List of Figures (57 Figures)
Figure 1 Aluminum Systems Market
Figure 2 Research Design
Figure 3 Global Population Projected to Reach ~9.5 Billion By 2050
Figure 4 Middle Class Population, 2009-2030
Figure 5 Projected GDP Per Capita, By Region
Figure 6 Fluctuation in Price of Aluminum From 2011-2015
Figure 7 Fluctuation in Prices of Aluminum and Copper From 2011-2015
Figure 8 Market Size Estimation Methodology: Bottom-Up Approach
Figure 9 Market Size Estimation Methodology: Top-Down Approach
Figure 10 Asia-Pacific Projected to Grow at the Highest CAGR Due to Rising Demand From End-User Industries
Figure 11 Aluminum Systems Market Snapshot (2015 vs. 2020)
Figure 12 Asia-Pacific to Be the Fastest-Growing Region-Level Market in Terms of Value
Figure 13 Key Strategies of Various Competitors, 2011–2015
Figure 14 Emerging Economies Offer Attractive Opportunities in the Aluminum Systems Market
Figure 15 Transportation & Logisitics Estimated to Capture the Largest Market Share in the Asia-Pacific Aluminum Systems Application Market in 2015
Figure 16 China is Projected to Be the Fastest-Growing Country-Level Market for Aluminum Systems
Figure 17 Construction Segment is Expected to Grow at the Highest Rate From 2015 to 2020
Figure 18 Emerging Markets to Grow at A Higher Rate Than Developed Markets Between 2015 and 2020
Figure 19 Wrought Aluminum Alloy Accounted for the Largest Share in the Aluminum Systems Market in 2014
Figure 20 Market in China is Projected to Grow at the Highest Rate
Figure 21 Aluminum Systems Market in Asia-Pacific Region is Experiencing High Growth
Figure 22 Evolution of Aluminum Systems
Figure 23 Market Segmentation, Aluminum Systems Market
Figure 24 Rising Demand From End Use Industry is the Key Driver for Aluminum Systems Market
Figure 25 Aluminum Systems Prices, By Region, 2014 (USD Per KT)
Figure 26 Aluminum Systems Prices, By Alloy Type, 2014 (USD Per KT)
Figure 27 Aluminum Systems Prices, By Alloying Element, 2014 (USD Per KT)
Figure 28 Aluminum Systems Prices, By Application, 2014 (USD Per KT)
Figure 29 Production Process Contributes the Most to the Value of the Overall Aluminum Systems
Figure 30 Porter’s Five Forces Analysis
Figure 31 Aluminum Systems Market Size, By Alloy Type, 2015 vs. 2020 (USD Billion)
Figure 32 Aluminum Systems Market Size, By Alloying Element, 2015 vs. 2020 (USD Billion)
Figure 33 Aluminum Systems Market Size, By Application, 2015 vs. 2020 (USD Billion)
Figure 34 Aluminum Systems Market Growth Analysis, 2015–2020
Figure 35 Aluminum Systems Market Size, By Region, 2015 vs. 2020 (USD Billion)
Figure 36 Rising Demand for Value-Added and Recycled Products to Drive the Demand for Aluminum Systems in Asia-Pacific
Figure 37 North America: Aluminum Systems Market Size, 2015 vs. 2020
Figure 38 Companies Adopted Investments & Expansions and Contracts & Agreements as the Key Growth Strategy Over the Last Three Years
Figure 39 Aluminum Corporation of China Limited Witnessed the Highest Growth Rate Between 2012 & 2014
Figure 40 Investments & Expansions Have Fueled Growth & Innovation in 2014
Figure 41 Investments & Expansions: the Key Strategy, 2013
Figure 42 Geographic Revenue Mix of Top Five Market Players
Figure 43 United Company Rusal: Company Snapshot
Figure 44 United Company Rusal PLC: SWOT Analysis
Figure 45 Alcoa Inc.: Company Snapshot
Figure 46 Alcoa Inc.: SWOT Analysis
Figure 47 Aluminum Corporation of China Limited: Company Snapshot
Figure 48 Aluminum Corporation of China Limited: SWOT Analysis
Figure 49 Rio Tinto: Company Snapshot
Figure 50 Rio Tinto: SWOT Analysis
Figure 51 BHP Billiton Group: Company Snapshot
Figure 52 BHP Billiton Group:SWOT Analysis
Figure 53 Norsk Hydro Asa: Company Snapshot
Figure 54 Century Aluminum Company: Company Snapshot
Figure 55 China Hongquiao Group Limited: Company Snapshot
Figure 56 Aluminum Bahrain B.S.C.: Company Snapshot
Figure 57 Hindalco Industries Limited: Company Snapshot


Growth opportunities and latent adjacency in Aluminum Systems Market