Automotive Aftermarket for Top 10 Components (Tire, Fluid, Filter, Battery, Brake, Collision Body, Lighting, Spark Plug, Telematics, Bearings), Vehicle Type (Passenger Car and Commercial Vehicle), and Region - Global Trends and Forecast to 2021


The automotive aftermarket for top 10 components is projected to grow at a CAGR of 7.75% during the forecast period, to reach a market size of USD 302.64 Billion by 2021. The market is driven by factors such as rising average age of vehicles in operation, increasing vehicle sales and parc, emergence of new distribution channels, and increased miles driven per year.
Objectives of the Study:
- To identify, define, segment, and forecast (2016–2021) the top 10 automotive aftermarket components market, in terms of volume (’000 units/million gallons) and value (USD million/billion)
- To identify the market dynamics and analyze their impact on the individual aftermarket components considered in the study
- To derive the market size for top 10 automotive aftermarket components as automotive fluids, filters, tires, battery, bearings, collision body, brakes, lighting, telematics, and spark plugs
- To segment the market for top 10 aftermarket components and forecast the market size, by value and volume, based on region (Asia-Oceania, North America, Europe, and the Rest of the World (RoW))
- To segment the market for top 10 aftermarket components and forecast the market size, by value and volume, based on vehicle type (passenger car, light commercial vehicle, and heavy commercial vehicles)
- To provide an analysis of the recent developments, alliances, joint ventures, and mergers & acquisitions in the top 10 aftermarket components market
Years considered for the study:
- 2015- Base Year
- 2016- Estimated Year
- 2021- Projected Year
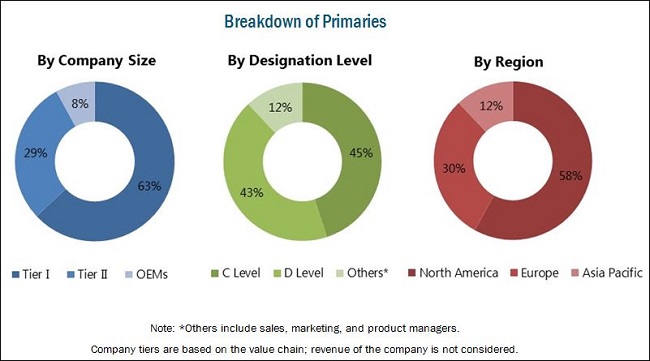
The research methodology used in the report involves primary and secondary sources. Secondary sources include automotive and component-manufacturing associations, paid databases, and directories such as Factiva and Bloomberg. In the primary research stage, experts from related industries, manufacturers, and suppliers have been interviewed to understand the present situation and future trends of the market. The automotive aftermarket for top 10 components size, in terms of volume (’000 units/million gallons) and value (USD million/billion), for all regions has been derived using forecasting techniques based on automobile demand and sales trends. The aftermarket prices of automotive top 10 components have been verified through primary sources.
The figure below illustrates the break-up of the profile of industry experts who participated in primary discussions.
To know about the assumptions considered for the study, download the pdf brochure
The automotive aftermarket for top 10 components ecosystem consists of component manufacturers such as Bridgestone Group (Japan), Royal Dutch Shell Plc (The Netherlands), and Mahle Group (Germany) and technology providers such as Robert Bosch GmbH (Germany), Continental AG (Germany), and Delphi Automotive PLC (U.K.). The products manufactured by these companies are used by automotive companies such as BMW (Germany), Daimler (Germany), Volvo (Sweden), and Ford Motor Company (U.S.).
Target Audience
- Manufacturers of automotive components
- Raw material suppliers for automotive components
- Experts from the automotive industry
- Dealers and distributors of automotive components
- Automotive OEMs
- The automobile industry and related end-user industries
Scope of the Report
Automotive Aftermarket for Top 10 Components, by Component
Automotive Aftermarket for Top 10 Components, by Vehicle Type
Automotive Aftermarket for Top 10 Components, by Region
-
- Tires
- Fluids
- Filters
- Batteries
- Brake friction products
- Collision bodies
- Lighting
- Remote Vehicle Diagnostics (RVD)
- Spark Plugs
- Bearings
- Passenger Cars (PC)
- Commercial Vehicles (CV)
- Asia-Oceania
- Europe
- North America
- RoW
Available Customizations
Automotive Aftermarket, By Region and Vehicle Type
-
- Wheels
- Starters and alternators
- Remanufactured components
- Accessories
- Fuel conversion kits
The automotive aftermarket for top 10 components is projected to grow at a CAGR of 7.75% from 2016 to 2021, to reach a market size of USD 302.64 Billion by 2021. The major factors responsible for growth are growing vehicle parc, increase in average life of a vehicle, rising miles driven per year and emergence of new distribution channels.
Tires is the largest segment globally, in terms of value. Tires are replaced once they are driven for a fixed set of kilometers or miles. Thus, the replacement or aftermarket for tires becomes an important segment for the automotive tire market. The aftermarket for tires is led by the radial tires segment. The sales of radial tires are rising as they offer low rolling resistance, better durability, and service life as compared to bias tires. The major players in the automotive tire aftermarket are Continental Group (Germany), Bridgestone Group (Japan), Michelin Group (France), and Goodyear Tire and Rubber Company (The U.S.).
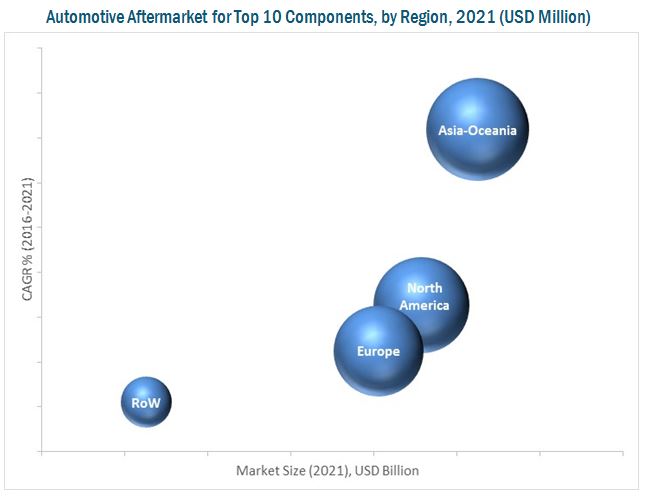
Asia-Oceania is estimated to dominate the automotive aftermarket for top 10 components, and the market is projected to grow at the highest CAGR, in terms of value, during the forecast period. The sizeable population in countries such as China and India have resulted in increased vehicle sales, which has boosted the demand for automotive aftermarket components. The growth in sales of mid segment passenger cars and SUVs is expected to continue over the next five years in the region, further fuelling the demand for aftermarket components. The region is home to various major automotive aftermarket players such as Bridgestone Group (Japan), Aisin Seiki Co., Ltd. (Japan), and several others.
A key factor restraining the growth of the automotive aftermarket for top 10 components is the counterfeit market, which is creating a hurdle for the organized players in the aftermarket. In addition, long-lasting aftermarket components are restraining the automotive component aftermarket as they lead to longer time gaps between consecutive vehicle servicing. For instance, aftermarket specialists such as K&N Engineering Inc. (U.S.) have introduced synthetic media-based air filters that they claim last up to 1,00,000 miles.
To speak to our analyst for a discussion on the above findings, click Speak to Analyst
 Exclusive indicates content/data unique to MarketsandMarkets and not available with any competitors.
Table of Contents
1 Introduction (Page No. - 14)
1.1 Objectives of the Study
1.2 Market Definition
1.3 Market Scope
1.3.1 Years Considered in the Study
1.4 Currency
1.5 Limitations
1.6 Stakeholders
2 Research Methodology (Page No. - 17)
2.1 Research Data
2.2 Secondary Data
2.2.1 Key Secondary Sources
2.2.2 Key Data From Secondary Sources
2.3 Primary Data
2.3.1 Sampling Techniques & Data Collection Methods
2.3.2 Primary Participants
2.4 Market Size Estimation
2.4.1 Market Breakdown & Data Triangulation
2.4.2 Assumptions
3 Executive Summary (Page No. - 23)
3.1 Introduction
3.2 Automotive Aftermarket – Key Influencing Factors
3.3 Automotive Aftermarket, By Value – Top 10 Components
3.4 Automotive Aftermarket for Top 10 Components – By Region
4 Automotive Tire Aftermarket, By Region and Vehicle Type (Page No. - 26)
4.1 Introduction
4.2 Market Dynamics
4.2.1 Drivers
4.2.1.1 Rising Average Age of Vehicles in Operation
4.2.2 Restraints
4.2.2.1 Fluctuating Prices of Raw Materials
4.2.3 Opportunities
4.2.3.1 Partnerships Between Major Tire Manufacturers and Domestic Players
4.2.4 Challenges
4.2.4.1 Increasing Number of Mandatory Test to Be Performed on Tires for Commercializing
4.3 Tire Aftermarket, By Region
4.3.1 Automotive Tire Aftermarket, By Region
4.3.2 Automotive Tire Aftermarket, By Vehicle Type
4.4 Company Profiles
4.4.1 Continental Group
4.4.1.1 Business Overview
4.4.1.2 Products Offered
4.4.1.3 MnM View
4.4.2 Bridgestone Group
4.4.2.1 Business Overview
4.4.2.2 Products Offered
4.4.2.3 MnM View
4.4.3 Key Developments
5 Automotive Fluids Aftermarket, By Region and Vehicle Type (Page No. - 34)
5.1 Introduction
5.2 Market Dynamics
5.2.1 Drivers
5.2.1.1 Growing Vehicle PARC
5.2.2 Restraints
5.2.2.1 Volatile Price of Raw Materials
5.2.3 Opportunity
5.2.3.1 Increasing Vehicle Demand in Developing Countries
5.2.4 Challenge
5.2.4.1 Increasing Engine Downsizing in Passenger Car Segment
5.2.4.2 Increase in Demand for Electric Vehicles
5.3 Global Automotive Fluids Aftermarket Size
5.3.1 Automotive Coolant Aftermarket Size, By Region
5.3.2 Automotive Coolant Aftermarket, By Vehicle Type
5.3.3 Automotive Engine Oil Aftermarket, By Region
5.3.4 Automotive Engine Oil Aftermarket, By Vehicle Type
5.3.5 Automotive Transmission Oil Aftermarket, By Region
5.3.6 Automotive Transmission Oil Aftermarket, By Vehicle Type
5.3.7 Automotive Brake Fluid Aftermarket, By Region
5.3.8 Automotive Brake Fluid Aftermarket, By Vehicle Type
5.4 Company Profiles
5.4.1 Royal Dutch Shell PLC
5.4.1.1 Business Overview
5.4.1.2 Products Offered
5.4.1.3 MnM View
5.4.2 Bp PLC
5.4.2.1 Business Overview
5.4.2.2 Products Offered
5.4.2.3 MnM View
5.4.3 Key Developments
6 Automotive Filters Aftermarket, By Region and Vehicle Type (Page No. - 48)
6.1 Introduction
6.2 Market Dynamics
6.2.1 Drivers
6.2.1.1 Increased Miles Driven Per Year
6.2.2 Restraints
6.2.2.1 Long Service Intervals Affecting the Aftermarket
6.2.3 Opportunities
6.2.3.1 Nano-Fiber Filters
6.2.4 Challenges
6.2.4.1 Unorganized Aftermarket
6.3 Global Automotive Filters Aftermarket Size
6.3.1 Automotive Fuel Filter Aftermarket Size, By Region
6.3.2 Automotive Fuel Filter Aftermarket Size, By Vehicle Type
6.3.3 Automotive Oil Filter Aftermarket Size, By Region
6.3.4 Automotive Oil Filter Aftermarket Size, By Vehicle Type
6.3.5 Automotive Air Filter Aftermarket Size, By Region
6.3.6 Automotive Air Filter Aftermarket Size, By Vehicle Type
6.4 Company Profiles
6.4.1 Mahle Group
6.4.1.1 Business Overview
6.4.1.2 Products Offered
6.4.1.3 MnM View
6.4.2 Mann+Hummel Group
6.4.2.1 Business Overview
6.4.2.2 Products Offered
6.4.2.3 MnM View
6.4.3 Key Developments
7 Automotive Battery Aftermarket, By Region and Vehicle Type (Page No. - 60)
7.1 Introduction
7.2 Market Dynamics
7.2.1 Drivers
7.2.1.1 Growing Integration of Electronics
7.2.2 Restraints
7.2.2.1 Underdeveloped Support Infrastructure for Evs
7.2.3 Opportunities
7.2.3.1 Growing Demand for Hybrids & Evs
7.2.4 Challenges
7.2.4.1 Reluctance to Replacement
7.3 Automotive Battery Aftermarket, By Region
7.3.1 Automotive Battery Aftermarket Size, By Region
7.3.2 Automotive Battery Aftermarket, By Vehicle Type
7.4 Company Profiles
7.4.1 Johnsons Controls Inc.
7.4.1.1 Business Overview
7.4.1.2 Products & Services
7.4.1.3 MnM View
7.4.2 Exide Technologies, Inc.
7.4.2.1 Business Overview
7.4.2.2 Products Offered:
7.4.3 Key Developments
8 Automotive Brake Friction Products Aftermarket, By Region and Vehicle Type (Page No. - 68)
8.1 Introduction
8.2 Market Dynamics
8.2.1 Drivers
8.2.1.1 Growing Vehicle Sales and PARC
8.2.2 Restraints
8.2.2.1 Counterfeit Market Hurdle for Organized Players
8.2.3 Opportunities
8.2.3.1 Demand for Lightweight Friction Products
8.2.4 Challenges
8.2.4.1 Extended Vehicle Warranties
8.3 Global Automotive Brake Friction Products Aftermarket
8.3.1 Automotive Brake Friction Products Aftermarket Size, By Component
8.3.2 Asia–Oceania: Brake Friction Products Aftermarket Size, By Component
8.3.3 Europe: Brake Friction Products Aftermarket Size, By Component
8.3.4 North America: Brake Friction Products Aftermarket Size, By Component
8.3.5 Rest of the World: Brake Friction Products Aftermarket Size, By Component
8.4 Company Profiles
8.4.1 Brembo S.P.A.
8.4.1.1 Business Overview
8.4.1.2 Products Offered
8.4.1.3 MnM View
8.4.2 Aisin Seiki Co. Ltd.
8.4.2.1 Business Overview
8.4.2.2 Products Offered
8.4.2.3 MnM View
8.4.3 Key Developments
9 Automotive Collision Body Aftermarket, By Region and Vehicle Type (Page No. - 79)
9.1 Introduction
9.1.1 Automotive Collision Body Aftermarket Size, By Region
9.1.2 Automotive Collision Body Aftermarket Size, By Vehicle Type
10 Automotive Lighting Aftermarket, By Region and Vehicle Type (Page No. - 82)
10.1 Introduction
10.1.1 Automotive Lighting Aftermarket Size, By Region
10.1.2 Automotive Lighting Aftermarket Size, By Vehicle Type
11 Remote Vehicle Diagnostics Aftermarket, By Region and Vehicle Type (Page No. - 85)
11.1 Introduction
11.2 Global Remote Vehicle Diagnostics Aftermarket
11.2.1 Remote Vehicle Diagnostics Aftermarket, By Region
11.2.2 Remote Vehicle Diagnostics Aftermarket, By Vehicle Type
12 Automotive Spark Plug Aftermarket, By Region (Page No. - 88)
12.1 Introduction
12.2 Automotive Spark Plugs Aftermarket, By Region
13 Automotive Bearings Aftermarket, By Region and Vehicle Type (Page No. - 90)
13.1 Introduction
13.2 Automotive Bearings Aftermarket
13.2.1 Automotive Bearings Aftermarket Size, By Application
13.2.2 Automotive Bearings Aftermarket Size, By Region
13.2.3 Automotive Bearings Aftermarket, By Vehicle Type
14 Appendix (Page No. - 94)
14.1 Insights of Primary Insights
14.2 Discussion Guide
14.3 Knowledge Store: Marketsandmarkets’ Subscription Portal
14.4 Introducing RT: Real Time Market Intelligence
14.5 Available Customizations
14.5.1 Regional Analysis
14.5.2 Automotive Aftermarket, By Region and Vehicle Type
14.5.2.1 Wheels
14.5.2.2 Starter and Alternators
14.5.2.3 Remanufactured Components
14.5.2.4 Accessories
14.5.2.5 Fuel Conversion Kits
14.6 Author Details
List of Tables (67 Tables)
Table 1 Aftermarket Size for Top 10 Automotive Components, 2016 vs 2021 (USD Million)
Table 2 Tires Aftermarket Size, By Region, 2014–2021 (‘000 Units)
Table 3 Tires Aftermarket Size, By Region, 2014–2021 (USD Million)
Table 4 Tires Aftermarket Size, By Vehicle Type, 2014–2021 (‘000 Units)
Table 5 Tires Aftermarket Size, By Vehicle Type, 2014–2021 (USD Million)
Table 6 Coolant Aftermarket Size, By Region, 2014–2021 (Million Gallons)
Table 7 Coolants Aftermarket Size, By Region, 2014–2021 (USD Million)
Table 8 Coolant Aftermarket Size, By Vehicle Type, 2014–2021 (Million Gallons)
Table 9 Coolants Aftermarket Size, By Vehicle Type, 2014–2021 (USD Million)
Table 10 Engine Oil Aftermarket Size, By Region, 2014–2021 (Million Gallons)
Table 11 Engine Oil Aftermarket Size, By Region, 2014–2021 (USD Million)
Table 12 Engine Oil Aftermarket Size, By Vehicle Type, 2014–2021 (Million Gallons)
Table 13 Engine Oil Aftermarket Size, By Vehicle Type, 2014–2021 (USD Million)
Table 14 Transmission Oil Aftermarket Size, By Region, 2014–2021 (Million Gallons)
Table 15 Transmission Oil Aftermarket Size, By Region, 2014–2021 (USD Million)
Table 16 Transmission Oil Aftermarket Size, By Vehicle Type, 2014–2021 (Million Gallons)
Table 17 Transmission Oil Aftermarket Size, By Vehicle Type, 2014–2021 (USD Million)
Table 18 Brake Fluid Aftermarket Size, By Region, 2014–2021 (Million Gallons)
Table 19 Brake Fluid Aftermarket Size, By Region, 2014–2021 (USD Million)
Table 20 Brake Fluid Aftermarket Size, By Vehicle Type, 2014–2021 (Million Gallons)
Table 21 Brake Fluids Aftermarket Size, By Vehicle Type, 2014–2021 (USD Million)
Table 22 Fuel Filter Aftermarket Size, By Region, 2014–2021 (‘000 Units)
Table 23 Fuel Filter Aftermarket Size, By Region, 2014–2021 (USD Million)
Table 24 Fuel Filter Aftermarket Size, By Vehicle Type, 2014–2021 (‘000 Units)
Table 25 Fuel Filter Aftermarket Size, By Vehicle Type, 2014–2021 (USD Million)
Table 26 Oil Filter Aftermarket Size, By Region, 2014–2021 (‘000 Units)
Table 27 Oil Filter Aftermarket Size, By Region, 2014–2021 (USD Million)
Table 28 Oil Filter Aftermarket Size, By Vehicle Type, 2014–2021 (‘000 Units)
Table 29 Oil Filter Aftermarket Size, By Vehicle Type, 2014–2021 (USD Million)
Table 30 Air Filter Aftermarket Size, By Region, 2014–2021 (‘000 Units)
Table 31 Air Filter Aftermarket Size, By Region, 2014–2021 (USD Million)
Table 32 Air Filter Aftermarket Size, By Vehicle Type, 2014–2021 (‘000 Units)
Table 33 Air Filter Aftermarket Size, By Vehicle Type, 2014–2021 (USD Million)
Table 34 Battery Aftermarket Size, By Region, 2014–2021 (‘000 Units)
Table 35 Battery Aftermarket Size, By Region, 2014–2021 (USD Million)
Table 36 Battery Aftermarket Size, By Vehicle Type, 2014–2021 (‘000 Units)
Table 37 Battery Aftermarket Size, By Vehicle Type, 2014–2021 (USD Million)
Table 38 Brake Friction Products Aftermarket Size, By Component, 2014–2021 (Million Units)
Table 39 Brake Friction Products Aftermarket Size, By Component, 2014–2021 (USD Million)
Table 40 Asia–Oceania: Brake Friction Products Aftermarket Size, By Component, 2014–2021 (Million Units)
Table 41 Asia–Oceania: Brake Friction Products Aftermarket Size, By Component, 2014–2021 (USD Million)
Table 42 Europe: Brake Friction Products Aftermarket Size, By Component, 2014–2021 (Million Units)
Table 43 Europe: Brake Friction Products Aftermarket Size, By Component, 2014–2021 (USD Million)
Table 44 North America: Brake Friction Products Aftermarket Size, By Component, 2014–2021 (Million Units)
Table 45 North America: Brake Friction Products Aftermarket Size, By Component, 2014–2021 (USD Million)
Table 46 Rest of the World: Brake Friction Products Aftermarket Size, By Component, 2014–2021 (Million Units)
Table 47 Rest of the World: Brake Friction Products Aftermarket Size, By Component, 2014–2021 (USD Million)
Table 48 Collision Body Aftermarket Size, By Region, 2014–2021 (‘000 Units)
Table 49 Collision Body Aftermarket Size, By Region, 2014–2021 (USD Million)
Table 50 Collision Body Aftermarket Size, By Vehicle Type, 2014–2021 (‘000 Units)
Table 51 Collision Body Aftermarket Size, By Vehicle Type, 2014–2021 (USD Million)
Table 52 Lighting Aftermarket Size, By Region, 2014–2021 (‘000 Units)
Table 53 Lighting Aftermarket Size, By Region, 2014–2021 (USD Million)
Table 54 Lighting Aftermarket Size, By Vehicle Type, 2014–2021 (‘000 Units)
Table 55 Lighting Aftermarket Size, By Vehicle Type, 2014–2021 (USD Million)
Table 56 Remote Vehicle Diagnostics Aftermarket Size, By Region, 2014–2021 (‘000 Units)
Table 57 Remote Vehicle Diagnostics Aftermarket Size, By Region, 2014–2021 (USD Million)
Table 58 Remote Vehicle Diagnostics Aftermarket Size, By Vehicle Type, 2014–2021 (‘000 Units)
Table 59 Remote Vehicle Diagnostics Aftermarket Size, By Vehicle Type, 2014–2021 (USD Million)
Table 60 Spark Plugs Aftermarket Size, By Region, 2014–2021 (‘000 Units)
Table 61 Spark Plugs Aftermarket Size, By Region, 2014–2021 (USD Million)
Table 62 Automotive Bearings Aftermarket Size, By Application, 2014–2021 (Million Units)
Table 63 Automotive Bearings Aftermarket Size, By Application, 2014–2021 (USD Million)
Table 64 Automotive Bearings Aftermarket Size, By Region, 2014–2021 (Million Units)
Table 65 Automotive Bearings Aftermarket Size, By Region, 2014–2021 (USD Million)
Table 66 Automotive Bearings Aftermarket Size, By Vehicle Type, 2014–2021 (Million Units)
Table 67 Automotive Bearings Aftermarket Size, By Vehicle Type, 2014–2021 (USD Million)
List of Figures (26 Figures)
Figure 1 Top 10 Automotive Aftermarket Segmentation
Figure 2 Research Design Model
Figure 3 Breakdown of Primary Interviews: By Company Type, Designation, & Region
Figure 4 Bottom-Up Approach – Automotive Coolant Aftermarket
Figure 5 Data Triangulation
Figure 6 Factors Influencing the Automotive Aftermarket
Figure 7 Automotive Aftermarket Size for Top 10 Components, 2016 vs 2021 (USD Million)
Figure 8 Automotive Aftermarket Size for Top 10 Components – Regional Overview
Figure 9 Global Tires Aftermarket – Market Dynamics
Figure 10 Fluctuating Prices of Raw Materials
Figure 11 Tire Aftermarket, By Region, 2016 – 2021 (USD Million)
Figure 12 Global Automotive Fluids Aftermarket – Market Dynamics
Figure 13 Global Automotive Fluids Aftermarket Size, By Region
Figure 14 Global Automotive Filters Aftermarket – Market Dynamics
Figure 15 Miles Driven Per Year
Figure 16 Global Automotive Filters Aftermarket, By Region
Figure 17 Global Automotive Battery Aftermarket – Market Dynamics
Figure 18 Global Automotive Battery Aftermarket, By Region
Figure 19 Global Automotive Brake Friction Products – Market Dynamics
Figure 20 Vehicle PARC, 2015
Figure 21 Global Automotive Brake Friction Products Aftermarket, By Component
Figure 22 Global Collision Body Aftermarket Size, By Region
Figure 23 Global Lighting Aftermarket Size, By Region
Figure 24 Global Remote Vehicle Diagnostics Aftermarket Size, By Region.
Figure 25 Global Spark Plugs Aftermarket Size, By Region
Figure 26 Global Automotive Bearings Aftermarket, By Application


Growth opportunities and latent adjacency in Automotive Aftermarket