Automotive Energy Recovery Systems Market by Regenerative Braking [by Region (Asia-Oceania; North America; Europe; and ROW) & by Passenger Car Type (Electric Vehicles, Hybrid Vehicles, and Plug-in Hybrid Electric Vehicles)], by Waste Heat Recovery Systems (by EGR and by Turbochargers), by KERS [by Region (Asia-Pacific, Europe, North America, and ROW)] - Global Trends and forecast to 2019


[250 Pages Report] An energy recovery systems helps in converting a sizable amount of waste energy, and store and reuse in another useful form for driving auxiliary vehicle functions or giving extra boost to the engine when required. For instance, the regenerative braking system converts some of its kinetic energy into charging the battery of electric vehicles. The main factors driving the demand for automotive energy recovery systems are environment-friendly systems, quest for improved vehicle performance, and stringent fuel economy standards.
In the years to come, the increasingly stringent government regulations for emission and performance in the passenger car segment in regions such as Europe and Asia-Pacific mainly in China, India, and Japan is estimatedto increase. This is projected to drive the automotive energy recovery systems market. Sustainable growth in the automotive energy recovery systems market will largely depend upon the upcoming legislations in various countries. In future, these systemsare to become mandatory in developed countries.
This report classifies and defines the automotive energy recovery systems market in terms of volume and value. This report provides comprehensive analyses and insights (qualitative and quantitative) on the market. The report highlights the potential growth opportunities in the coming years, while covering a review of the market drivers, restraints, growth indicators, challenges, legislation trends, market dynamics, competitive landscape, and other key aspects of the market. The key players in this market have also been identified and profiled.
Scope of the Report
The report covers the automotive energy recovery systems market in terms of volume and value. Market size in terms of volume is provided from 2012 to 2019 in thousand units, whereas the value of the market is provided in $million. The market is broadly classified into Asia-Oceania, Europe, North America, and RoW in terms of geography, focusing on key countries in each region.
Global Automotive Energy Recovery Systems Market Size, by Region, 2014-2019 (�000 Units)
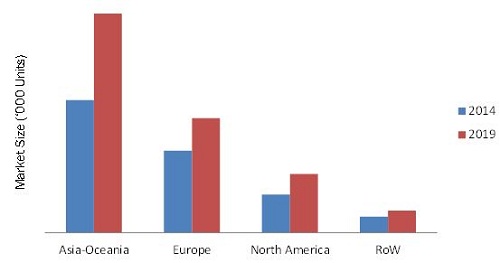
Source: OICA, Industry Associations, MarketsandMarkets Analysis
Automotive energy recovery systems: The market size, in terms of volume, is projected to grow at a promising CAGR of 9.03% to reach 139.4 million units by 2019.
Nowadays, the automotive industry is more inclined towards the use of advanced technologies to reduce the emissions and increase the fuel economy, thereby controlling the increased NOX and CO2 levels in the environment. Hence, the energy recovery systems play an important role in achieving both the targets.
The energy recovery systems have evolved as a result of the need for better fuel-efficiency, economy, and better vehicle performance. Energy recovery systems in various forms are the systems that provide the vehicle with the aforementioned features, which prompted companies to invest extensively in these systems. The automotive energy recovery systems market is driven by the factors such as stringent fuel emission norms, increased demand of improved vehicle performance, and inclination of consumers towards environment-friendly vehicles.
In Europe and North America, the automotive energy recovery systems market is growing at a higher rate, with a high penetration rate. The use of these systems is also growing significantly in the Asia-Oceania and RoW regions due to the increase in the consumer purchasing power and their preference for low emission vehicle. Japan, the U.S., France, and Brazil are projected to be the largest markets for the automotive energy recovery systems. Developing countries such as India, the Netherlands, and Mexico are projected to record a high growth rate from 2014 to 2019.
The energy recovery systems market is dominated by players such as Continental AG (Germany), Robert Bosch GmbH (Germany), and Denso Corporation (Japan).
Automotive Energy Recovery Systems Market Size, by Region, 2014 vs. 2019 (�000 Units)
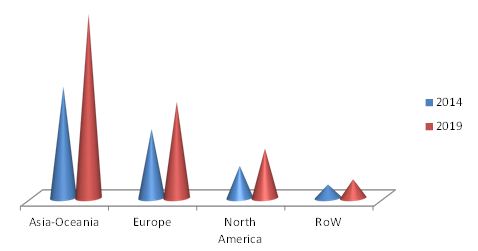
Source:OICA, Industry Association, MarketsandMarkets Analysis
 Exclusive indicates content/data unique to MarketsandMarkets and not available with any competitors.
Table of Contents
1 Introduction (Page No. - 15)
1.1 Objectives of the Study
1.2 Markets Covered
1.3 Stakeholders
1.4 Market Scope
2 Research Methodology (Page No. - 18)
2.1 Market Size Estimation
2.2 Market Crackdown and Data Triangulation
2.3 Market Share Estimation
2.3.1 Key Data Taken From Secondary Sources
2.3.2 Key Data Taken From Primary Sources
2.3.3 Assumptions
3 Executive Summary (Page No. - 24)
4 Premium Insights (Page No. - 28)
4.1 Attractive Opportunities in the Automotive Energy Recovery Systems Market
4.2 Automotive Energy Recovery Systems Market in the Key Countries
4.3 Automotive Waste Heat Energy Recovery Systems Market, By Turbochargers, Market Share 2014
4.4 Automotive Energy Recovery Systems Market, By Technology, 2014
4.5 Automotive Exhaust Gas Recirculation Market, By Region
4.6 Kinetic Energy Recovery System Market,By Region, 2014-2019
4.7 Life Cycle Analysis, By Technology
5 Market Overview (Page No. - 35)
5.1 Introduction
5.2 Market Segmentation
5.3 Market Dynamics
5.3.1 Drivers
5.3.1.1 Need for Environment-Friendly System
5.3.1.2 Improved Vehicle Performance
5.3.1.3 Stringent Fuel-Economy Standards
5.3.2 Restraint
5.3.2.1 High Cost of the System
5.3.3 Opportunities
5.3.3.1 Increasing Concerns Regarding the Environment
5.3.3.2 Benefit to Related Markets
5.3.4 Challenge
5.3.4.1 Lack of Awareness Among Consumers
5.3.5 Burning Issue
5.3.5.1 Government Initiatives
5.3.6 Winning Imperatives
5.3.6.1 Low-Cost Systems Compatible With Multiple Engine Models
6 Industry Trends (Page No. - 43)
6.1 Introduction
6.2 Value Chain Analysis
6.3 Industry Trends
6.4 Porter�s Five Forces Analysis
6.4.1 Threat of New Entrants
6.4.2 Threat of Substitutes
6.4.3 Bargaining Power of Suppliers
6.4.4 Bargaining Power of Buyers
6.4.5 Intensity of Rivalry
6.5 Pest Analysis
6.5.1 Political Factors
6.5.2 Economic Factors
6.5.3 Social Factors
6.5.4 Technological Factors
7 Automotive Regenerative Braking System Market (Page No. - 50)
7.1 Introduction
7.2 Regenerative Braking Systems
7.2.1 Advantages
7.2.2 Disadvantages
7.3 By Region
7.3.1 Asia-Pacific
7.3.2 Europe
7.3.3 North America
7.3.4 RoW
7.4 By Passenger Car Type
7.4.1 By Region
7.4.1.1 Asia-Pacific
7.4.1.1.1 Australia
7.4.1.1.2 Japan
7.4.1.1.3 China
7.4.1.1.4 South Korea
7.4.1.1.5 Rest of Asia-Pacific
7.4.1.2 Europe
7.4.1.2.1 France
7.4.1.2.2 U.K.
7.4.1.2.3 Italy
7.4.1.2.4 the Netherlands
7.4.1.2.5 Rest of Europe
7.4.1.3 North America
7.4.1.3.1 Canada
7.4.1.3.2 Mexico
7.4.1.3.3 U.S.
7.4.1.4 RoW
7.4.1.4.1 Brazil
7.4.1.4.2 Israel
7.4.1.4.3 Other Countries of RoW
8 Automotive Waste Heat Recovery System (Page No. - 97)
8.1 Automotive Exhaust Gas Recirculation (EGR)
8.1.1 Introduction
8.1.1.1 Working of Exhaust Gas Recirculation System (EGR)
8.1.1.2 Advantages
8.1.1.3 Disadvantages
8.1.2 By Region
8.1.2.1 Introduction
8.2 Automotive Turbochargers
8.2.1 Introduction
8.2.2 Working of Turbochargers
8.2.3 Advantages
8.2.4 Disadvantages
8.2.5 By Region
8.2.5.1 Introduction
8.2.5.2 Asia-Pacific
8.2.5.3 Europe
8.2.5.4 North America
8.2.5.5 RoW
9 Kinetic Energy Recovery System Market (Page No. - 113)
9.1 Introduction
9.1.1 Kinetic Energy Recovery System
9.1.1.1 Advantages
9.1.1.2 Disadvantages
9.1.2 By Region
9.1.2.1 Automotive Kinetic Energy Recovery System: Scenario-1
9.1.2.2 Automotive Kinetic Energy Recovery System: Scenario-2
10 Automotive Energy Recovery System Market-Comparative Analysis (Page No. - 120)
10.1 Comparative Study
10.1.1 By Region
10.1.1.1 By Technology
10.1.1.1.1 Asia-Pacific
10.1.1.1.2 Europe
10.1.1.1.3 North America
10.1.1.1.4 RoW
11 Competitive Landscape (Page No. - 128)
11.1 Overview
11.2 Competitive Situation and Trends
11.2.1 New Product Launches
11.2.2 Agreements, Partnerships, Collaborations, and Joint Ventures
11.2.3 Expansions & Other Developments
12 Company Profiles (Page No. - 135)
(Company at A Glance, Recent Financials, Products & Services, Strategies & Insights, & Recent Developments)*
12.1 Introduction
12.2 Continental AG
12.3 Delphi Automotive PLC
12.4 Denso Corporation
12.5 Faurecia SA
12.6 Gentherm Incorporated
12.7 Panasonic
12.8 Ricardo PLC
12.9 Robert Bosch GMBH
12.10 Tenneco Inc.
12.11 Torotrak PLC
12.12 TRW
*Details on Company at A Glance, Recent Financials, Products & Services, Strategies & Insights, & Recent Developments Might Not Be Captured in Case of Unlisted Companies.
List of Tables (85 Tables)
Table 1 Impact of Key Drivers on the Automotive Energy Recovery Systems Market
Table 2 Impact of the Key Restraint on the Automotive Energy Recovery Systems Market
Table 3 Impact of Key Opportunities on the Automotive Energy Recovery Systems Market
Table 4 Impact of the Key Challenge on the Automotive Energy Recovery Systems Market
Table 5 Automotive Regenerative Braking System Market Size, By Region,2012-2019 (Units)
Table 6 Automotive Regenerative Braking System Market Size, By Region,2012-2019 ($Million)
Table 7 Asia-Pacific: Automotive Regenerative Braking System Market Size,By Country, 2012-2019 (Units)
Table 8 Asia-Pacific: Automotive Regenerative Braking System Market Size,By Country, 2012-2019 ($Million)
Table 9 Europe: Automotive Regenerative Braking System Market Size,By Country, 2012-2019 (Units)
Table 10 Europe: Automotive Regenerative Braking System Market Size,By Country, 2012-2019 ($Million)
Table 11 North America: Automotive Regenerative Braking System Market Size,By Country, 2012-2019 (Units)
Table 12 North America: Automotive Regenerative Braking System Market Size,By Country, 2012-2019 ($Million)
Table 13 RoW: Automotive Regenerative Braking System Market Size, By Country, 2012-2019 (Units)
Table 14 RoW: Automotive Regenerative Braking System Market Size, By Country, 2012-2019 ($Million)
Table 15 Automotive Regenerative Braking System Market Size, By Passenger Car Type, 2012-2019 (Units)
Table 16 Automotive Regenerative Braking System Market Size, By Passenger Car Type, 2012-2019 ($Million)
Table 17 Asia-Pacific: Automotive Regenerative Braking System Market Size,By Passenger Car Type, 2012-2019 (Units)
Table 18 Asia-Pacific: Automotive Regenerative Braking System Market Size,By Passenger Car Type, 2012-2019 ($Million)
Table 19 Australia: Automotive Regenerative Braking System Market Size,By Passenger Car Type, 2012-2019 (Units)
Table 20 Australia: Automotive Regenerative Braking System Market Size,By Passenger Car Type, 2012-2019 ($Million)
Table 21 Japan: Automotive Regenerative Braking System Market Size,By Passenger Car Type, 2012-2019 (Units)
Table 22 Japan: Automotive Regenerative Braking System Market Size,By Passenger Car Type, 2012-2019 ($Million)
Table 23 China: Automotive Regenerative Braking System Market Size,By Passenger Car Type, 2012-2019 (Units)
Table 24 China: Automotive Regenerative Braking System Market Size,By Passenger Car Type, 2012-2019 ($Million)
Table 25 South Korea: Automotive Regenerative Braking System Market Size,By Passenger Car Type, 2012-2019 (Units)
Table 26 South Korea: Automotive Regenerative Braking System Market Size,By Passenger Car Type, 2012-2019 ($Million)
Table 27 Rest of Asia-Pacific: Automotive Regenerative Braking System Market Size, By Passenger Car Type, 2012-2019 (Units)
Table 28 Rest of Asia-Pacific: Automotive Regenerative Braking System Market Size, By Passenger Car Type, 2012-2019 ($Million)
Table 29 Europe: Automotive Regenerative Braking System Market Size,By Passenger Car Type, 2012-2019 (Units)
Table 30 Europe: Automotive Regenerative Braking System Market Size,By Passenger Car Type, 2012-2019 ($Million)
Table 31 France: Automotive Regenerative Braking System Market Size,By Passenger Car Type, 2012-2019 (Units)
Table 32 France: Automotive Regenerative Braking System Market Size,By Passenger Car Type, 2012-2019 ($Million)
Table 33 U.K.: Automotive Regenerative Braking System Market Size, By Passenger Car Type, 2012-2019 (Units)
Table 34 U.K.: Automotive Regenerative Braking System Market Size, By Passenger Car Type, 2012-2019 ($Million)
Table 35 Italy: Automotive Regenerative Braking System Market Size,By Passenger Car Type, 2012-2019 (Units)
Table 36 Italy: Automotive Regenerative Braking System Market Size,By Passenger Car Type, 2012-2019 ($Million)
Table 37 The Netherlands: Automotive Regenerative Braking System Market Size, By Passenger Car Type, 2012-2019 (Units)
Table 38 The Netherlands: Automotive Regenerative Braking System Market Size, By Passenger Car Type, 2012-2019 ($Million)
Table 39 Rest of Europe: Automotive Regenerative Braking System Market Size,By Passenger Car Type, 2012-2019 (Units)
Table 40 Rest of Europe: Automotive Regenerative Braking System Market Size,By Passenger Car Type, 2012-2019 ($Million)
Table 41 North America: Automotive Regenerative Braking System Market Size,By Passenger Car Type, 2012-2019 (Units)
Table 42 North America: Automotive Regenerative Braking System Market Size,By Passenger Car Type, 2012-2019 ($Million)
Table 43 Canada: Automotive Regenerative Braking System Market Size,By Passenger Car Type, 2012-2019 (Units)
Table 44 Canada: Automotive Regenerative Braking System Market Size,By Passenger Car Type, 2012-2019 ($Million)
Table 45 Mexico: Automotive Regenerative Braking System Market Size,By Passenger Car Type, 2012-2019 (Units)
Table 46 Mexico: Automotive Regenerative Braking System Market Size,By Passenger Car Type, 2012-2019 ($Million)
Table 47 U.S.: Automotive Regenerative Braking System Market Size, By Passenger Car Type, 2012-2019 (Units)
Table 48 U.S.: Automotive Regenerative Braking System Market Size, By Passenger Car Type, 2012-2019 ($Million)
Table 49 RoW: Automotive Regenerative Braking System Market Size,By Passenger Car Type, 2012-2019 (Units)
Table 50 RoW: Automotive Regenerative Braking System Market Size,By Passenger Car Type, 2012-2019 ($Million)
Table 51 Brazil: Automotive Regenerative Braking System Market Size,By Passenger Car Type, 2012-2019 (Units)
Table 52 Brazil: Automotive Regenerative Braking System Market Size,By Passenger Car Type, 2012-2019 ($Million)
Table 53 Israel: Automotive Regenerative Braking System Market Size,By Passenger Car Type, 2012-2019 (Units)
Table 54 Israel: Automotive Regenerative Braking System Market Size,By Passenger Car Type, 2012-2019 ($Million)
Table 55 Other Countries of RoW: Automotive Regenerative Braking System Market Size, By Passenger Car Type, 2012-2019 (Units)
Table 56 Other Countries of RoW: Automotive Regenerative Braking System Market Size, By Passenger Car Type, 2012-2019 ($Million)
Table 57 Automotive Exhaust Gas Recirculation System Market Size, By Region, 2012-2019 (�000 Units)
Table 58 Automotive Exhaust Gas Recirculation System Market Size, By Region, 2012-2019 ($Million)
Table 59 Automotive Turbocharger Market Size, By Region, 2012-2019 (�000 Units)
Table 60 Automotive Turbocharger Market Size, By Region, 2012-2019 ($Million)
Table 61 Asia-Pacific: Automotive Turbocharger Market Size, By Country,2012-2019 (�000 Units)
Table 62 Asia-Pacific: Automotive Turbocharger Market Size, By Country,2012-2019 ($Million)
Table 63 Europe: Automotive Turbocharger Market Size, By Country,2012-2019 (�000 Units)
Table 64 Europe: Automotive Turbocharger Market Size, By Region,2012-2019 ($Million)
Table 65 North America: Automotive Turbocharger Market Size, By Country,2012-2019 (�000 Units)
Table 66 North America: Automotive Turbocharger Market Size, By Country,2012-2019 ($Million)
Table 67 RoW: Automotive Turbocharger Market Size, By Country,2012-2019 (�000 Units)
Table 68 RoW: Automotive Turbocharger Market Size, By Country,2012-2019 ($Million)
Table 69 Scenario-1: Automotive Kinetic Energy System Market Size, By Region, 2014-2019 (�000 Units)
Table 70 Scenario-1: Automotive Kinetic Energy System Market Size, By Region, 2014-2019 ($Million)
Table 71 Scenario-2: Automotive Kinetic Energy System Market Size, By Region, 2014-2019 (�000 Units)
Table 72 Scenario-2: Automotive Kinetic Energy System Market, By Region,2014-2019 ($Million)
Table 73 Automotive Energy Recovery Systems Market Size, By Region,2014-2019 (�000 Units)
Table 74 Automotive Energy Recovery Systems Market Size, By Region,2014-2019 ($Million)
Table 75 Asia-Pacific: Automotive Energy Recovery Systems Market Size,By Technology, 2014-2019 (�000 Units)
Table 76 Asia-Pacific: Automotive Energy Recovery Systems Market Size,By Technology, 2014-2019 ($Million)
Table 77 Europe: Automotive Energy Recovery Systems Market Size,By Technology, 2014-2019 (�000 Units)
Table 78 Europe: Automotive Energy Recovery Systems Market Size,By Technology, 2014-2019 ($Million)
Table 79 North America: Automotive Energy Recovery Systems Market Size,By Technology, 2014-2019 (�000 Units)
Table 80 North America: Automotive Energy Recovery Systems Market Size,By Technology, 2014-2019 ($Million)
Table 81 RoW: Automotive Energy Recovery Systems Market Size, By Technology, 2012-2019 (�000 Units)
Table 82 RoW: Automotive Energy Recovery Systems Market Size, By Technology, 2012-2019 ($Million)
Table 83 New Product Launches, 2011�2014
Table 84 Agreements, Partnerships, Collaborations, and Joint Ventures,2011-2014
Table 85 Expansion & Other Development, 2011-2014
List of Figures (83 Figures)
Figure 1 Global Automotive Energy Recovery Systems Market: Research Methodology
Figure 2 Market Size Estimation Methodology: Bottom-Up Approach: Regenerative Braking Systems
Figure 3 Market Size Estimation Methodology: Bottom-Up Approach: Waste Heat Recovery Systems (WHRS) and Kinetic Energy Recovery Systems (KERS)
Figure 4 Regenerative Braking System Market Snapshot (2014 vs. 2019): Hybrid Vehicle Regenerative Braking Systems Capture the Maximum Market Share Among All Regions
Figure 5 Waste Heat Recovery Systems Market, By Type & Region,2014-2019 ($Million)
Figure 6 Kinetic Energy Recovery System Market Share, 2014, Scenario-1
Figure 7 Kinetic Energy Recovery System Market Share, 2014, Scenario-2
Figure 8 Attractive Opportunities in the Automotive Energy Recovery Systems Market
Figure 9 Japan Captures the Top Position in the Emerging Asia-Pacific Market
Figure 10 China Commands More Than One-Fifth of the Automotive Turbocharger System Market
Figure 11 Regenerative Braking Systems are Projected to Continue to Dominate the Automotive Energy Recovery System Market in the Next Five Years
Figure 12 North American Markets to Grow Faster Than Other Regions
Figure 13 Asia-Pacific Accounted for the Largest Share for the Kinetic Energy Recovery System Market, 2014-2019
Figure 14 Kinetic Energy System Market Soon to Enter Exponential Growth Phase
Figure 15 Automotive Energy Recovery Systems Market Segmentation
Figure 16 Increasing Fuel Economy Standards Will Spur the Demand for Automotive Energy Recovery Systems
Figure 17 Corporate Average Fuel Economy (CAFE) Targets for Passenger Cars, 2012-2016
Figure 18 Value Chain Analysis (2013): Major Value is Added During Manufacturing & Assembly Phase
Figure 19 Heavy R&D Investment: the Leading Trend Among the Key Players
Figure 20 Porter�s Five Forces Analysis (2013)
Figure 21 Structure of Regenerative Braking System
Figure 22 Automotive Regenerative Braking System Market Size, By Region,2014 vs. 2019 ($Million & Units)
Figure 23 Asia-Pacific: Automotive Regenerative Braking System Market Size, By Country, 2014 vs. 2019 (Units)
Figure 24 Asia-Pacific: Automotive Regenerative Braking System Market Size, By Country, 2014 vs. 2019 ($Million)
Figure 25 Europe: Automotive Regenerative Braking System Market Size, By Country, 2014 vs. 2019 (Units)
Figure 26 Europe: Automotive Regenerative Braking System Market Size, By Country, 2014 vs. 2019 ($Million)
Figure 27 North America: Automotive Regenerative Braking System Market Size, By Country, 2014 vs. 2019 (Units)
Figure 28 North America: Regenerative Braking System Market Size, By Country, 2014 vs. 2019 ($Million)
Figure 29 RoW: Automotive Regenerative Braking System Market Size, By Country, 2014 vs. 2019 (Units)
Figure 30 RoW: Automotive Regenerative Braking System Market, By Country,2014 vs. 2019 ($Million)
Figure 31 Automotive Regenerative Braking System Market Size, By Passenger Car Type, 2014 vs. 2019 (Units)
Figure 32 Automotive Regenerative Braking System Market Size, By Passenger Car Type, 2014 vs. 2019 ($Million)
Figure 33 Asia-Pacific: Automotive Regenerative Braking System Market Size, By Passenger Car Type, 2014-2019 ($Million & Units)
Figure 34 Australia: Automotive Regenerative Braking System Market Size, By Passenger Car Type, 2014-2019 ($Million & Units)
Figure 35 Japan: Automotive Regenerative Braking System Market Size, By Passenger Car Type, 2014-2019 ($Million & Units)
Figure 36 China: Regenerative Braking System Market Size, By Passenger Car Type, 2014-2019 ($Million & Units)
Figure 37 South Korea: Regenerative Braking System Market Size, By Passenger Car Type, 2014-2019 ($Million & Units)
Figure 38 Rest of Asia-Pacific: Regenerative Braking System Market, By Passenger Car Type, 2014-2019 ($Million & Units)
Figure 39 Europe: Regenerative Braking System Market Size, By Passenger Car Type, 2014-2019 ($Million & Units)
Figure 40 France: Regenerative Braking System Market Size, By Passenger Car Type, 2014-2019 ($Million & Units)
Figure 41 U.K.: Regenerative Braking System Market Size, By Passenger Car Type, 2014-2019 ($Million & Units)
Figure 42 Italy: Regenerative Braking System Market Size, By Passenger Car Type, 2014-2019 ($Million & Units)
Figure 43 The Netherlands: Regenerative Braking System Market Size, By Passenger Car Type, 2014-2019 ($Million & Units)
Figure 44 Rest of Europe: Regenerative Braking System Market Size, By Passenger Car Type, 2014-2019 ($Million & Units)
Figure 45 North America: Automotive Regenerative Braking System Market, By Passenger Car Type, 2014-2019 ($Million & Units)
Figure 46 Canada: Regenerative Braking System Market Size, By Passenger Car Type, 2014-2019 ($Million & Units)
Figure 47 Mexico: Automotive Regenerative Braking System Market, By Passenger Car Type, 2014-2019 (Value, Volume)
Figure 48 U.S.: Regenerative Braking System Market, By Passenger Car Type,2014-2019 (Value, Volume)
Figure 49 RoW: Automotive Regenerative Braking System Market Size, By Passenger Car Type, 2014-2019 ($Million & Units)
Figure 50 Brazil: Regenerative Braking System Market Size, By Passenger Car Type, 2014-2019 ($Million & Units)
Figure 51 Israel: Automotive Regenerative Braking System Market Size, By Passenger Car Type, 2014-2019 ($Million & Units)
Figure 52 Other Countries of RoW: Automotive Regenerative Braking System Market Size, By Passenger Car Type, 2014-2019 ($Million & Units)
Figure 53 Exhaust Gas Recirculation System Market Size, By Region, 2014 Vs.2019 ($Million & �000 Units)
Figure 54 Global Automotive Turbocharger Market Size, By Region,2014-2019 ($Million)
Figure 55 Asia-Pacific: Automotive Turbocharger Market Size, By Country,2014-2019 ($Million)
Figure 56 Europe: Automotive Turbocharger Market Size, By Country,2014 vs. 2019 ($Million)
Figure 57 North America: Automotive Turbocharger Market Size, By Country,2014 vs. 2019 ($Million)
Figure 58 RoW: Automotive Turbocharger Market Size, By Country,2014-2019 ($Million)
Figure 59 Working of Automotive Kinetic Energy Recovery System
Figure 60 Scenario-1: Automotive Kinetic Energy System Market Share, By Region, 2014 vs. 2019 (�000 Units)
Figure 61 Scenario-2: Automotive Kinetic Energy System Market Share, By Region, 2014-2019 (�000 Units)
Figure 62 Automotive Energy Recovery System Market, By Region,2014-2019 (�000 Units)
Figure 63 Automotive Energy Recovery Systems Market, By Technology, 2014-2019
Figure 64 Product Innovation has Emerged as the Key Growth Strategy Over the Last Three Years
Figure 65 Continental AG and Faurecia S.A. Grew at A Rapid Pace During 2008�2013
Figure 66 Key Growth Strategies of Automotive Energy Recovery System Market
Figure 67 Battle for Market Share: New Product Launches Was the Key Strategy
Figure 68 Geographic Revenue Mix of Top Five Market Players
Figure 69 Competitive Benchmarking of Key Players (2008-2013)
Figure 70 Continental AG: Business Overview
Figure 71 Delphi Automotive PLC: Business Overview
Figure 72 Denso Corporation: Business Overview
Figure 73 Faurecia SA: Business Overview
Figure 74 Faurecia SA: SWOT Analysis
Figure 75 Gentherm Incorporated: Business Overview
Figure 76 Panasonic: Business Overview
Figure 77 Panasonic: SWOT Analysis
Figure 78 Ricardo PLC: Business Overview
Figure 79 Robert Bosch GMBH: Business Overview
Figure 80 Robert Bosch GMBH: SWOT Analysis
Figure 81 Tenneco Inc.: Business Overview
Figure 82 Torotrak PLC: Business Overview
Figure 83 TRW: Business Overview


Growth opportunities and latent adjacency in Automotive Energy Recovery Systems Market