Automotive HVAC Market by Vehicle Type (Passenger Cars, LCVs & HCVs), Technology (Manual & Automatic), Components & Cabin Comfort Market by Type (Power Seats, Power Windows, Heated Seats & Sunroofs) - Global Trends & Forecast to 2018


[448 Pages Report] The report focuses on automotive HVAC and Cabin comfort systems, which have cemented their place in a vehicle with the growing demand for luxuries. The automotive HVAC systems which were first introduced in 1930s are standard equipment in almost every vehicle in the developed markets such as U.S. and Europe. The key drivers behind the growth of this market are the rising amount of time spent by people in their vehicles and the growing popularity of private vehicles over public transport. The Asia-Pacific region is expected to be the largest segment in automotive HVAC market owing to the large vehicle production levels in countries such China, India, and Japan.
The Cabin comfort features arrived in the automotive HVAC market as value added features in the passenger cars which helped the automotive OEMs generate interest in their vehicles and attract buyers for vehicles with a premium price tag. However, with the constantly declining prices, majority of these features have now trickled down into the lower segment vehicles as well. The four cabin comfort features targeted in this report are - power windows, power seats, heated seats, and sunroof systems. While the power windows and power seats have high penetration rate in the modern day vehicles; heated seats and sunroof systems are still mainly associated with luxury vehicles. This report provides the market estimations for these products in the four major regional markets�Asia, Americas, Europe, and ROW from 2011 to 2018 in terms of value and volume.
The sunroof systems, on account of their high prices, are expected to acquire the largest share in the Cabin comfort systems and automotive HVAC market in terms of value; while power windows are expected to be the largest segment in terms of volume.
The HVAC systems market has been comprehensively studied with segmentations based on geography (Asia, Americas, Europe, and ROW); technology (Automatic and Manual); components (Compressor, Heat exchanging equipment, Receiver/Dryer, and Expansion valve).
The growing popularity of automatic HVAC systems is expected to drive the market to new heights in the coming years with several lower level vehicles getting this equipment as an option or as standard equipment.
In the past few years, the automotive sector has witnessed a significant growth, mainly due to growing economies of the BRICS countries. The systems considered under the scope of the report are both comfort technologies which increase the level of comfort and luxury quotient of the vehicle. HVAC system creates pleasant climate inside the vehicle cabin, which results in increased comfort to the occupants. It is very useful mainly during long distance travels, when lack of comfort could lead to tiredness and fatigue. Presently, the automatic systems are being employed to a large extent as it requires the least level of human intervention. The cabin comfort features ease the process of adjusting windows, seats and temperature beneath the seats. These features in vehicles are useful especially when aged people are travelling. Sunroof is a type of cabin comfort system, which is mainly employed in the medium and luxury segment passenger cars. This system helps in providing ventilation and at the same time increases the luxury feature of the vehicle. These cabin comfort systems have gained importance among the automobile consumers mainly due to their benefits, which includes comfort.
The major factors driving the demand for these technologies in automotive HVAC systems market are the increasing requirement of comfort, fuel efficiency and growing adoption of luxury vehicles. The fuel efficiency of a vehicle is directly linked to HVAC system equipped in it as it draws the power from the engine. Lighter and efficient the HVAC system, higher is the increase in fuel economy of the vehicle. Most of the luxury vehicles come equipped with automatic HVAC systems, power windows, power and heated seats as a standard and the increase in sales of these vehicles leaves a positive impact on the cabin comfort systems market.
Asia is expected to lead the Cabin Comfort Systems and automotive HVAC market. Pushed by the fast growing markets in China and India, this region is expected to dominate the automotive industry. The market in this region is one, where the price of a vehicle has a major impact on its demand. Consumers require high value for their money and hence manufacturers are relying on low cost systems for their vehicles produced in this region. The European and Americas regions are still recuperating from the economic turmoil. While the Americas market is pushing forward with full force, the European market is showing a slow but steady growth and is expected to reach pre-meltdown levels over the period of next five years.
The key manufacturers in automotive HVAC systems market are identified as Denso Corp. (Japan), Valeo SA (France), Behr GmbH (Germany), Halla Climate Control Corp. (Korea), Delphi Automotive (U.S.), Calsonic Kansei (Japan), Visteon Corp. (U.S.) and Sanden Corp. (U.S.). The key players in the cabin comfort systems market are Brose GmbH (Germany), Webasto (Germany), Inalfa Roof Systems BV (The Netherlands), Imasen Electric Corp. (Japan) etc. These companies collectively account for a major share of their respective markets. However, the demand for both these technologies is highly dependent on the automobile industry. The market for HVAC and cabin comfort systems is expected to grow at a healthy pace over the next five years.
This report covers the market for automotive HVAC and cabin comfort systems based on Geography (Asia, Europe, Americas and Rest of the World (ROW)), Technology (HVAC system− Manual and Automatic), Vehicle Type (HVAC system− Passenger cars, LCVs and HCVs), Components (HVAC system− Heat exchanging equipment, Compressor, Receiver/Drier and Expansion device) and Cabin Comfort market by Type (Power windows, Power seats, Heated seats and Sunroofs). All the market estimates given are in terms of volume (�000 Units) and revenue ($million), except for technology and components markets; where the estimates are provided only in terms of volume (�000 Units) and revenue ($million) respectively.
Automotive HVAC & Cabin Comfort Systems: Market Revenue ($Billion), By Geography, 2011 � 2018 & Revenue Share, By Geography, 2013
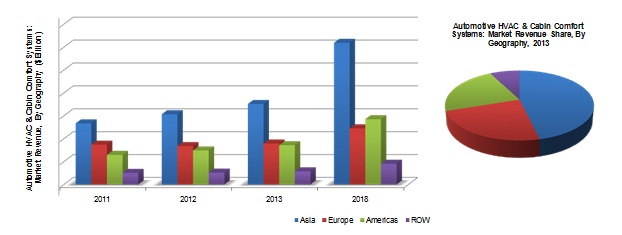
Source: MarketsandMarkets Analysis
 Exclusive indicates content/data unique to MarketsandMarkets and not available with any competitors.
Table Of Contents
1 Introduction (Page No. - 33)
1.1 Key Take-Aways
1.2 Report Description
1.2.1 Automatic HVAC Systems: Leading & Rapidly Growing Technology
1.3 Glance At Markets Covered
1.3.1 By Geography
1.3.1.1 Asia
1.3.1.2 Europe
1.3.1.3 Americas
1.3.1.4 Row
1.3.2 By Product Types
1.3.2.1 Automotive HVAC Systems
1.3.2.2 Automotive Cabin Comfort Systems
1.3.3 By Vehicle Types
1.3.3.1 Passenger Cars
1.3.3.2 Light Commercial Vehicles
1.3.3.3 Heavy Commercial Vehicles
1.3.4 By Technologies
1.3.4.1 Manual Hvac Systems
1.3.4.2 Automatic HVAC Systems
1.3.5 By Components
1.3.5.1 Compressor
1.3.5.2 Heat Exchanging Equipment
1.3.5.3 Receiver/Drier
1.3.5.4 Expansion Device
1.3.6 Automotive Cabin Comfort Systems, By Types
1.3.6.1 Power Windows
1.3.6.2 Power Seats
1.3.6.3 Heated Seats
1.3.6.4 Sunroof Systems
1.4 Stakeholders
1.5 Research Methodology
1.5.1 Market Size
1.5.1.1 Methodology
1.5.2 Key Data Points Taken From Secondary Sources
1.5.3 Key Data Points Taken From Primary Sources
1.5.4 Assumptions
2 Executive Summary (Page No. - 49)
2.1 Asia: Fastest Growing Market
2.2 Passenger Cars: Small Sized Giants
2.3 Power Windows: Volume Drawer
3 Premium Insights (Page No. - 52)
3.1 Market Segmentation
3.1.1 Automotive HVAC Systems
3.1.2 Automotive Cabin Comfort Systems
3.2 Automotive HVAC Market & Cabin Comfort Systems Market Overview
3.2.1 Automotive Hvac Systems Market
3.2.1.1 Automotive HVAC Systems Penetration Rate, By Geography
3.2.1.2 Automotive HVAC Market, By Geography
3.2.1.3 Automotive HVAC Systems: Key Regional/Country Markets
3.2.1.4 Automotive HVAC Market, By Vehicle Types
3.2.1.5 Automotive HVAC Market, By Technologies
3.2.1.6 Automotive HVAC Systems: Key Market Players
3.2.2 Automotive Cabin Comfort Systems Market
4 Market Overview (Page No. - 64)
4.1 Introduction
4.2 Market Dynamics
4.2.1 Drivers
4.2.1.1 Comfort Is The New Fuel Economy
4.2.1.2 My Car Is My Second Home
4.2.1.3 Making Travelling Easier For Aged People
4.2.1.4 Value Proposition
4.2.2 Restraints
4.2.2.1 Pricey Options
4.2.2.2 Buying Is Easy, Maintaining Is The Tougher Part
4.2.3 Opportunity
4.2.3.1 Comfort Features That Are Easy On The Pocket
4.3 Burning Issues
4.3.1 Environmental Effects Of Refrigerants Used
4.3.2 Medical Concerns Over Heated Seats
4.4 Winning Imperatives
4.4.1 Collaborative Product Development
4.4.2 Venturing Into Retrofit Business
4.4.3 Leaner, Cleaner & Greener- Future Requirements From HVAC Systems
4.4.4 Standard Design- The Key To Economies Of Scale
4.5 Porter�s Five Force Analysis
4.5.1 Automotive HVAC Systems
4.5.1.1 Suppliers� Power
4.5.1.2 Threat Of Substitutes
4.5.1.3 Threat Of New Entrants
4.5.1.4 Buyers� Power
4.5.1.5 Degree Of Competition
4.5.2 Automotive Cabin Comfort System
4.5.2.1 Suppliers� Power
4.5.2.2 Threat Of Substitutes
4.5.2.3 Threat Of New Entrants
4.5.2.4 Buyers� Power
4.5.2.5 Degree Of Competition
4.6 Value Chain
4.7 Market Share Analysis
4.7.1 Automotive HVAC System Manufacturers� Market Share Outlook, 2013
4.8 Patents Analysis
4.8.1 Automotive HVAC Systems
4.8.1.1 By Region
4.8.1.2 By Company
4.8.2 Automotive Cabin Comfort Systems
4.8.2.1 By Region
4.8.2.2 By Product
5 Technological Overview (Page No. - 89)
5.1 Introduction
5.2 Automotive HVAC System
5.2.1 Basic Components
5.2.1.1 Compressor
5.2.1.2 Heat Exchanging Equipment
5.2.1.2.1 Condenser
5.2.1.2.2 Evaporator
5.2.1.3 Receiver/Drier
5.2.1.4 Expansion Device
5.2.2 Types Of Actuation
5.2.2.1 Manual HVAC System
5.2.2.2 Automatic HVAC System
5.2.3 Technology Roadmap
5.2.3.1 The First Attempt
5.2.3.2 Mid-Twentieth Century
5.2.3.3 1960-1990: The Rise Of Automotive Air Conditioning Systems
5.2.3.4 1990-Till Date: The Phase Of Transition
5.2.3.5 Future HVAC Systems
5.3 Automotive Cabin Comfort Systems
5.3.1 Power Windows
5.3.2 Power Seats
5.3.3 Heated Seats
5.3.4 Sunroofs
6 Automotive HVAC & Cabin Comfort Systems Market, By Geography (Page No. - 99)
6.1 Introduction
6.2 Automotive HVAC Systems
6.2.1 Market Volume Estimates, By Geography
6.2.2 Market Revenue Estimates, By Geography
6.2.3 Market By Geography
6.2.3.1 Asia
6.2.3.1.1 Largest Market For Automotive HVAC Systems
6.2.3.1.2 Market Volume Estimates, By Countries
6.2.3.1.3 Market Revenue Estimates, By Countries
6.2.3.2 Europe
6.2.3.2.1 Promising Market Conditions Due To Eu Regulations
6.2.3.2.2 Market Volume Estimates, By Countries
6.2.3.2.3 Market Revenue Estimates, By Countries
6.2.3.3 Americas
6.2.3.3.1 Expected To Show Significant Growth In The Next Five Years
6.2.3.3.2 Market Volume Estimates, By Countries
6.2.3.3.3 Market Revenue Estimates, By Countries
6.2.3.4 Row
6.2.3.4.1 Steady And Slow Growth For Automotive HVAC Systems
6.2.3.4.2 Market Volume Estimates, By Countries
6.2.3.4.3 Market Revenue Estimates, By Countries
6.3 Automotive Cabin Comfort Systems
6.3.1 Market Volume Estimates, By Geography
6.3.2 Market Revenue Estimates, By Geography
6.3.3 Key Regional Markets
6.3.3.1 Asia
6.3.3.1.1 Largest Market For Automotive Cabin Comfort Systems Dominated By China And Japan
6.3.3.1.2 Market Volume Estimates, By Countries
6.3.3.1.3 Market Revenue Estimates, By Countries
6.3.3.2 Europe
6.3.3.2.1 Luxury Vehicle Segment To Dominate The Market In Next Five Years
6.3.3.2.2 Market Volume Estimates, By Countries
6.3.3.2.3 Market Revenue Estimates, By Countries
6.3.3.3 Americas
6.3.3.3.1 Expected To Show Promising Growth For Automotive Cabin Comfort Systems Market
6.3.3.3.2 Market Volume Estimates, By Countries
6.3.3.3.3 Market Revenue Estimates, By Countries
6.3.3.4 Row
6.3.3.4.1 High Potential For Automotive Cabin Comfort Systems Market
6.3.3.4.2 Market Volume Estimates, By Countries
6.3.3.4.3 Market Revenue Estimates, By Countries
6.4 Automotive HVAC & Cabin Comfort Systems Market
6.4.1 Market Volume Estimates, By Geography
6.4.2 Market Revenue Estimates, By Geography
6.4.3 Asia
6.4.3.1 Dominates The Automotive HVAC And Cabin Comfort Systems Market
6.4.3.2 Market Volume Estimates, By Products
6.4.3.3 Market Revenue Estimates, By Products
6.4.3.4 Market By Countries
6.4.3.4.1 China
6.4.3.4.1.1 High Volume And Revenue Market For Automotive HVAC And Cabin Comfort Systems
6.4.3.4.1.2 Market Volume Estimates, By Products
6.4.3.4.1.3 Market Revenue Estimates, By Products
6.4.3.4.2 Japan
6.4.3.4.2.1 Market Volume Estimates, By Products
6.4.3.4.2.2 Market Revenue Estimates, By Products
6.4.3.4.3 South Korea
6.4.3.4.3.1 Potential Market And Possible Game Changer For Automotive HVAC And Cabin Comfort Systems
6.4.3.4.3.2 Market Volume Estimates, By Products
6.4.3.4.3.3 Market Revenue Estimates, By Products
6.4.4 Europe
6.4.4.1 Market Volume Estimates, By Products
6.4.4.2 Market Revenue Estimates, By Products
6.4.4.3 Market By Countries
6.4.4.3.1 Germany
6.4.4.3.1.1 Largest Volume Market In Eu
6.4.4.3.1.2 Market Volume Estimates, By Products
6.4.4.3.1.3 Market Revenue Estimates, By Products
6.4.4.3.2 France
6.4.4.3.2.1 Market Volume Estimates, By Products
6.4.4.3.2.2 Market Revenue Estimates, By Products
6.4.4.3.3 U.K.
6.4.4.3.3.1 Expected To Show High Adoption Of Automotive HVAC And Cabin Comfort Systems In Next Five Years
6.4.4.3.3.2 Market Volume Estimates, By Products
6.4.4.3.3.3 Market Revenue Estimates, By Products
6.4.5 Americas
6.4.5.1 Market Volume Estimates, By Products
6.4.5.2 Market Revenue Estimates, By Products
6.4.5.3 Market By Countries
6.4.5.3.1 U.S.
6.4.5.3.1.1 High Penetration Of Automotive HVAC And Cabin Comfort Systems
6.4.5.3.1.2 Market Volume Estimates, By Products
6.4.5.3.1.3 Market Revenue Estimates, By Products
6.4.5.3.2 Mexico
6.4.5.3.2.1 Latest Hub For Automotive Technology Manufacturers
6.4.5.3.2.2 Market Volume Estimates, By Products
6.4.5.3.2.3 Market Revenue Estimates, By Products
6.4.5.3.3 Brazil
6.4.5.3.3.1 Cash Cow For The Automotive Industry
6.4.5.3.3.2 Market Volume Estimates, By Products
6.4.5.3.3.3 Market Revenue Estimates, By Products
6.4.6 Row
6.4.6.1 Market Volume Estimates, By Products
6.4.6.2 Market Revenue Estimates, By Products
6.4.6.3 Market By Countries
6.4.6.3.1 Russia
6.4.6.3.1.1 Highest Opportunity For Automotive HVAC Systems Market
6.4.6.3.1.2 Market Volume Estimates, By Products
6.4.6.3.1.3 Market Revenue Estimates, By Products
6.4.6.3.2 South Africa
6.4.6.3.2.1 Market Volume Estimates, By Products
6.4.6.3.2.2 Market Revenue Estimates, By Products
6.4.6.3.3 Australia
6.4.6.3.3.1 Market Volume Estimates, By Products
6.4.6.3.3.2 Market Revenue Estimates, By Products
7 Global Automotive HVAC Systems Market, By Vehicle Type (Page No. - 173)
7.1 Introduction
7.2 Market By Vehicle Type
7.2.1 Market Volume Estimates
7.2.2 Market Revenue Estimates
7.3 Key Automotive Industry Trends
7.3.1 Passenger Cars
7.3.2 Light Commercial Vehicles
7.3.3 Heavy Commercial Vehicles
7.4 Passenger Car HVAC Systems
7.4.1 Market By Geography
7.4.1.1 Market Volume Estimates
7.4.1.2 Market Revenue Estimates
7.5 Light Commercial Vehicle HVAC Systems
7.5.1 Market By Geography
7.5.1.1 Market Volume Estimates
7.5.1.2 Market Revenue Estimates
7.6 Heavy Commercial Vehicle HVAC Systems
7.6.1 Market By Geography
7.6.1.1 Market Volume Estimates
7.6.1.2 Market Revenue Estimates
8 Global Automotive HVAC Systems Market, By Technology (Page No. - 192)
8.1 Introduction
8.2 Market By Technology
8.2.1 Market Volume Estimates
8.2.2 Automatic HVAC Systems
8.2.2.1 Market Volume Estimates, By Geography
8.2.3 Manual HVAC Systems
8.2.3.1 Market Volume Estimates, By Geography
8.2.4 By Geography
8.2.4.1 Asia
8.2.4.1.1 Market Volume Estimates, By Technology
8.2.4.2 Europe
8.2.4.2.1 Market Volume Estimates, By Technology
8.2.4.3 Americas
8.2.4.3.1 Market Volume Estimates, By Technology
8.2.4.4 Row
8.2.4.4.1 Market Volume Estimates, By Technology
9 Global Automotive HVAC Systems Market, By Components (Page No. - 205)
9.1 Introduction
9.2 Market By Component
9.2.1 Market Revenue Estimates
9.2.2 Compressor
9.2.2.1 Market Revenue Estimates, By Geography
9.2.3 Heat Exchanging Equipment
9.2.3.1 Market Revenue Estimates, By Geography
9.2.4 Receiver/Drier
9.2.4.1 Market Revenue Estimates, By Geography
9.2.5 Expansion Device
9.2.5.1 Market Revenue Estimates, By Geography
10 Global Automotive Cabin Comfort Systems Market, By Types (Page No. - 216)
10.1 Introduction
10.2 Market By Types
10.2.1 Market Volume Estimates
10.2.2 Market Revenue Estimates
10.2.3 Major Regional Automotive Cabin Comfort Systems Markets, By Types
10.2.3.1 Asia
10.2.3.1.1 Market Volume Estimates, By Types
10.2.3.1.2 Market Revenue Estimates, By Types
10.2.3.1.3 China
10.2.3.1.3.1 Market Volume Estimates, By Types
10.2.3.1.3.2 Market Revenue Estimates, By Types
10.2.3.1.4 Japan
10.2.3.1.4.1 Market Volume Estimates, By Types
10.2.3.1.4.2 Market Revenue Estimates, By Types
10.2.3.1.5 South Korea
10.2.3.1.5.1 Market Volume Estimates, By Types
10.2.3.1.5.2 Market Revenue Estimates, By Types
10.2.3.2 Europe
10.2.3.2.1 Market Volume Estimates, By Types
10.2.3.2.2 Market Revenue Estimates, By Types
10.2.3.2.3 Germany
10.2.3.2.3.1 Market Volume Estimates, By Types
10.2.3.2.3.2 Market Revenue Estimates, By Types
10.2.3.2.4 France
10.2.3.2.4.1 Market Volume Estimates, By Types
10.2.3.2.4.2 Market Revenue Estimates, By Types
10.2.3.2.5 U.K.
10.2.3.2.5.1 Market Volume Estimates, By Types
10.2.3.2.5.2 Market Revenue Estimates, By Types
10.2.3.3 Americas
10.2.3.3.1 Market Volume Estimates, By Types
10.2.3.3.2 Market Revenue Estimates, By Types
10.2.3.3.3 U.S.
10.2.3.3.3.1 Market Volume Estimates, By Types
10.2.3.3.3.2 Market Revenue Estimates, By Types
10.2.3.3.4 Mexico
10.2.3.3.4.1 Market Volume Estimates, By Types
10.2.3.3.4.2 Market Revenue Estimates, By Types
10.2.3.3.5 Brazil
10.2.3.3.5.1 Market Volume Estimates, By Types
10.2.3.3.5.2 Market Revenue Estimates, By Types
10.2.3.4 Row
10.2.3.4.1 Market Volume Estimates, By Types
10.2.3.4.2 Market Revenue Estimates, By Types
10.2.3.4.3 Russia
10.2.3.4.3.1 Market Volume Estimates, By Types
10.2.3.4.3.2 Market Revenue Estimates, By Types
10.2.3.4.4 Australia
10.2.3.4.4.1 Market Volume Estimates, By Types
10.2.3.4.4.2 Market Revenue Estimates, By Types
10.2.3.4.5 South Africa
10.2.3.4.5.1 Market Volume Estimates, By Types
10.2.3.4.5.2 Market Revenue Estimates, By Types
10.3 Power Seats Market
10.3.1 Market Volume Estimates, By Geography
10.3.2 Market Revenue Estimates, By Geography
10.4 Power Windows Market
10.4.1 Market Volume Estimates, By Geography
10.4.2 Market Revenue Estimates, By Geography
10.5 Heated Seats Market
10.5.1 Market Volume Estimates, By Geography
10.5.2 Market Revenue Estimates, By Geography
10.6 Sunroof Systems Market
10.6.1 Market Volume Estimates, By Geography
10.6.2 Market Revenue Estimates, By Geography
11 Competitive Landscape (Page No. - 303)
11.1 Introduction
11.2 Market Players
11.2.1 Automotive HVAC Systems & Component Manufacturers
11.2.1.1 Company�s Relative Positions By Geography
11.2.2 Key Growth Strategies�Automotive HVAC System Market
11.3 Expansions
11.4 New Product Launch/Development
11.5 Agreements, Collaborations, Joint Ventures & Partnerships
11.6 Mergers & Acquisitions
11.7 Supply Contracts & Others
12 Company Profiles (Page No. - 322)
12.1 Air International Thermal Systems
12.1.1 Overview
12.1.2 Financials
12.1.3 Products & Services
12.1.4 Strategy
12.1.5 Developments
12.2 Behr Gmbh. & Co. Kg.
12.2.1 Overview
12.2.2 Financials
12.2.3 Products & Services
12.2.4 Strategy
12.2.5 Developments
12.2.6 Swot Analysis
12.3 Brose Fahrzeugteile Gmbh & Co. Kg
12.3.1 Overview
12.3.2 Financials
12.3.3 Products & Services
12.3.4 Strategy
12.3.5 Developments
12.4 Calsonic Kansei Corporation
12.4.1 Overview
12.4.2 Financials
12.4.3 Products & Services
12.4.4 Strategy
12.4.5 Developments
12.4.6 Swot Analysis
12.5 Delphi Automotive Plc
12.5.1 Overview
12.5.2 Financials
12.5.3 Products & Services
12.5.4 Strategy
12.5.5 Developments
12.6 Denso Corporation
12.6.1 Overview
12.6.2 Financials
12.6.3 Products & Services
12.6.4 Strategy
12.6.5 Developments
12.6.6 Swot Analysis
12.7 Eberspacher Climate Control Systems Gmbh & Co. Kg
12.7.1 Overview
12.7.2 Financials
12.7.3 Products & Services
12.7.4 Strategy
12.7.5 Developments
12.8 Gentherm Inc.
12.8.1 Overview
12.8.2 Financials
12.8.3 Products & Services
12.8.4 Strategy
12.8.5 Developments
12.9 Halla Climate Control Corporation
12.9.1 Overview
12.9.2 Financials
12.9.3 Products & Services
12.9.4 Strategy
12.9.5 Developments
12.10 Imasen Electric Industrial Co., Ltd
12.10.1 Overview
12.10.2 Financials
12.10.3 Products & Services
12.10.4 Strategy
12.10.5 Developments
12.11 Inalfa Roof Systems Group B.V.
12.11.1 Overview
12.11.2 Financials
12.11.3 Products & Services
12.11.4 Strategy
12.11.5 Developments
12.12 Japan Climate Systems Corporation
12.12.1 Overview
12.12.2 Financials
12.12.3 Products & Services
12.12.4 Strategy
12.12.5 Developments
12.13 Johnson Electric Holdings Ltd.
12.13.1 Overview
12.13.2 Financials
12.13.3 Products & Services
12.13.4 Strategy
12.13.5 Developments
12.13.6 Swot Analysis
12.14 Keihin Corporation
12.14.1 Overview
12.14.2 Financials
12.14.3 Products & Services
12.14.4 Strategy
12.14.5 Developments
12.14.6 Swot Analysis
12.15 Kongsberg Automotive Holding Asa
12.15.1 Overview
12.15.2 Financials
12.15.3 Products & Services
12.15.4 Strategy
12.15.5 Developments
12.16 Sanden Corporation
12.16.1 Overview
12.16.2 Financials
12.16.3 Products & Services
12.16.4 Strategy
12.16.5 Developments
12.17 Subros Ltd
12.17.1 Overview
12.17.2 Financials
12.17.3 Products & Services
12.17.4 Strategy
12.17.5 Developments
12.18 Toyota Industries Corporation
12.18.1 Overview
12.18.2 Financials
12.18.3 Products & Services
12.18.4 Strategy
12.18.5 Developments
12.19 Valeo Sa
12.19.1 Overview
12.19.2 Financials
12.19.3 Product & Services
12.19.4 Strategy
12.19.5 Developments
12.19.6 Swot Analysis
12.20 Visteon Corporation
12.20.1 Overview
12.20.2 Financials
12.20.3 Products & Services
12.20.4 Strategy
12.20.5 Developments
12.20.6 Swot Analysis
12.21 Xiezhong International Holdings Ltd.
12.21.1 Overview
12.21.2 Financials
12.21.3 Products & Services
12.21.4 Strategy
12.21.5 Developments
Appendix (Page No. - 410)
U.S. Patents
Europe Patents
Japan Patents
List Of Tables (159 Tables)
Table 1 Automotive HVAC Systems: Detailed Methodology For Market Size
Table 2 Automotive Cabin Comfort Systems: Detailed Methodology For Market Size
Table 3 Automotive HVAC & Cabin Comfort Systems: Impact Of Major Drivers On The Market
Table 4 Automotive HVAC & Cabin Comfort Systems: Impact Of Major Restraints On The Market
Table 5 Automotive HVAC Technology: Raw Materials, Components & System Suppliers
Table 6 Automotive HVAC Systems: Major Market Players
Table 7 Sunroof: Types & Its Descriptions
Table 8 Automotive HVAC Systems: Market Volume, By Geography, 2011 - 2018 ('000 Units)
Table 9 Automotive HVAC Systems: Market Revenue, By Geography, 2011 - 2018 ($Million)
Table 10 Asia: Automotive HVAC Systems Market Volume, By Countries, 2011 - 2018 ('000 Units)
Table 11 Asia: Market Revenue, By Countries, 2011 - 2018 ($Million)
Table 12 Europe: Automotive HVAC Systems Market Volume, By Countries, 2011 - 2018 ('000 Units)
Table 13 Europe: Market Revenue, By Countries, 2011 - 2018 ($Million)
Table 14 Americas: Automotive HVAC Systems Market Volume, By Countries, 2011 - 2018 ('000 Units)
Table 15 Americas: Market Revenue, By Countries, 2011 - 2018 ($Million)
Table 16 Row: Automotive HVAC Systems Market Volume, By Countries, 2011 - 2018 ('000 Units)
Table 17 Row: Market Revenue, By Countries, 2011 - 2018 ($Million)
Table 18 Automotive Cabin Comfort Systems: Market Volume, By Geography, 2011 � 2018 (�000 Units)
Table 19 Automotive Cabin Comfort Systems: Market Revenue, By Geography, 2011 � 2018 ($Million)
Table 20 Asia: Automotive Cabin Comfort Systems Market Volume, By Countries, 2011 - 2018 ('000 Units)
Table 21 Asia: Market Revenue, By Countries, 2011 - 2018 ($Million)
Table 22 Europe: Automotive Cabin Comfort Systems Market Volume, By Countries, 2011 - 2018 ('000 Units)
Table 23 Europe: Market Revenue, By Countries, 2011 - 2018 ($Million)
Table 24 Americas: Automotive Cabin Comfort Systems Market Volume, By Countries, 2011 - 2018 ('000 Units)
Table 25 Americas: Market Revenue, By Countries, 2011 - 2018 ($Million)
Table 26 Row: Automotive Cabin Comfort Systems Market Volume, By Countries, 2011 - 2018 ('000 Units)
Table 27 Row: Market Revenue, By Countries, 2011 - 2018 ($Million)
Table 28 Automotive HVAC Market & Cabin Comfort Systems: Market Volume, By Geography, 2011 - 2018 ('000 Units)
Table 29 Market Revenue, By Geography, 2011 - 2018 ($Million)
Table 30 Market Volume, By Products, 2011 - 2018 ('000 Units)
Table 31 Revenue, By Products, 2011 - 2018 ($Million)
Table 32 China: Automotive HVAC Market & Cabin Comfort Systems Market Volume, By Products, 2011 - 2018 ('000 Units)
Table 33 China: Market Revenue, By Products, 2011 - 2018 ($Million)
Table 34 Japan: Automotive HVAC & Cabin Comfort Systems Market Volume, By Products, 2011 - 2018 ('000 Units)
Table 35 Japan: , By Products, 2011 - 2018 ($Million)
Table 36 South Korea: Automotive HVAC & Cabin Comfort Systems Market Volume, By Products, 2011 - 2018 ('000 Units)
Table 37 South Korea: Market Revenue, By Products, 2011 - 2018 ($Million)
Table 38 Europe: Automotive HVAC & Cabin Comfort Systems Market Volume, By Products, 2011 - 2018 ('000 Units)
Table 39 Europe: Market Revenue, By Products, 2011 - 2018 ($Million)
Table 40 Germany: Automotive HVAC & Cabin Comfort Systems Market Volume, By Products, 2011 - 2018 ('000 Units)
Table 41 Germany: Market Revenue, By Products, 2011 - 2018 ($Million)
Table 42 France: Automotive HVAC & Cabin Comfort Systems Market Volume, By Products, 2011 - 2018 ('000 Units)
Table 43 France: Market Revenue, By Products, 2011 - 2018 ($Million)
Table 44 U.K: Automotive HVAC & Cabin Comfort Systems Market Volume, By Products, 2011 - 2018 ('000 Units)
Table 45 U.K: Market Revenue, By Products, 2011 - 2018 ($Million)
Table 46 Americas: Automotive HVAC & Cabin Comfort Systems Market Volume, By Products, 2011 - 2018 ('000 Units)
Table 47 Americas: Market Revenue, By Products, 2011 - 2018 ($Million)
Table 48 U.S: Automotive HVAC & Cabin Comfort Systems Market Volume, By Products, 2011 - 2018 ('000 Units)
Table 49 U.S: Market Revenue, By Products, 2011 - 2018 ($Million)
Table 50 Mexico: Automotive HVAC & Cabin Comfort Systems Market Volume, By Products, 2011 - 2018 ('000 Units)
Table 51 Mexico: Market Revenue, By Products, 2011 - 2018 ($Million)
Table 52 Brazil: Automotive HVAC & Cabin Comfort Systems Market Volume, By Products, 2011 - 2018 ('000 Units)
Table 53 Brazil: Market Revenue, By Products, 2011 - 2018 ($Million)
Table 54 Row: Automotive HVAC & Cabin Comfort Systems Market Volume, By Products, 2011 - 2018 ('000 Units)
Table 55 Row: Market Revenue, By Products, 2011 - 2018 ($Million)
Table 56 Russia: Automotive HVAC & Cabin Comfort Systems Market Volume, By Products, 2011 - 2018 ('000 Units)
Table 57 Russia: Market Revenue, By Products, 2011 - 2018 ($Million)
Table 58 South Africa: Automotive HVAC & Cabin Comfort Systems Market Volume, By Products, 2011 - 2018 ('000 Units)
Table 59 South Africa: Market Revenue, By Products, 2011 - 2018 ($Million)
Table 60 Australia: Automotive HVAC & Cabin Comfort Systems Market Volume, By Products, 2011 - 2018 ('000 Units)
Table 61 Australia: Market Revenue, By Products, 2011 - 2018 ($Million)
Table 62 Automotive HVAC Systems: Market Volume, By Vehicle Types, 2011 � 2018 (�000 Units)
Table 63 Global Automotive HVAC Systems: Market Revenue, By Vehicle Types, 2011 � 2018 ($Million)
Table 64 Passenger Car HVAC Systems: Market Volume, By Geography, 2011 � 2018 (�000 Units)
Table 65 Passenger Car HVAC Systems: Market Revenue, By Geography, 2011 � 2018 ($Million)
Table 66 Light Commercial Vehicle Hvac Systems: Market Volume, By Geography, 2011 � 2018 (�000 Units)
Table 67 Light Commercial Vehicle Hvac Systems: Market Revenue, By Geography, 2011 � 2018 ($Million)
Table 68 Heavy Commercial Vehicle Hvac Systems: Market Volume, By Geography, 2011 � 2018 (�000 Units)
Table 69 Heavy Commercial Vehicle Hvac Systems: Market Revenue, By Geography, 2011 � 2018 ($Million)
Table 70 Global Automotive HVAC Systems: Market Volume, By Technology, 2011 � 2018 (�000 Units)
Table 71 Automatic HVAC Systems: Market Volume, By Geography, 2011 � 2018 (�000 Units)
Table 72 Manual HVAC Systems: Market Volume, By Geography, 2011 � 2018 (�000 Units)
Table 73 Asia: Automotive HVAC Systems Market Volume, By Technologies, 2011 � 2018 (�000 Units)
Table 74 Europe: Automotive HVAC Systems Market Volume, By Technologies, 2011 � 2018 (�000 Units)
Table 75 Americas: Automotive HVAC Systems Market Volume, By Technologies, 2011 � 2018 (�000 Units)
Table 76 Row: Automotive HVAC Systems Market Volume, By Technologies, 2011 � 2018 (�000 Units)
Table 77 Automotive HVAC: Components & Its Functions
Table 78 Automotive HVAC System: Market Revenue, By Components, 2011 � 2018 ($Million)
Table 79 Compressor: Market Revenue, By Geography, 2011 � 2018 ($Million)
Table 80 Heat Exchanging Equipment: Market Revenue, By Geography, 2011 � 2018 ($Million)
Table 81 Receiver/Drier: Market Revenue, By Geography, 2011 � 2018 ($Million)
Table 82 Expansion Device: Market Revenue, By Geography, 2011 � 2018 ($Million)
Table 83 Automotive Cabin Comfort Systems: Market Volume, By Types, 2011 � 2018 (�000 Units)
Table 84 Automotive Cabin Comfort Systems: Market Revenue, By Types, 2011 � 2018 ($Million)
Table 85 Asia: Automotive Cabin Comfort Systems Market Volume, By Types, 2011 � 2018 (�000 Units)
Table 86 Asia: Market Revenue, By Types, 2011 � 2018 ($Million)
Table 87 China: Automotive Cabin Comfort Systems Market Volume, By Types, 2011 � 2018 (�000 Units)
Table 88 China: Market Revenue, By Types, 2011 � 2018 ($Million)
Table 89 Japan: Automotive Cabin Comfort Systems Market Volume, By Types, 2011 � 2018 (�000 Units)
Table 90 Japan: Market Revenue, By Types, 2011 � 2018 ($Million)
Table 91 South Korea: Automotive Cabin Comfort Systems Market Volume, By Types, 2011 � 2018 (�000 Units)
Table 92 South Korea: Market Revenue, By Types, 2011 � 2018 ($Million)
Table 93 Europe: Automotive Cabin Comfort Systems Market Volume, By Types, 2011 � 2018 (�000 Units)
Table 94 Europe: Market Revenue, By Types, 2011 � 2018 ($Million)
Table 95 Germany: Automotive Cabin Comfort Systems Market Volume, By Types, 2011 � 2018 (�000 Units)
Table 96 Germany: Market Revenue, By Types, 2011 � 2018 ($Million)
Table 97 France: Automotive Cabin Comfort Systems Market Volume, By Types, 2011 � 2018 (�000 Units)
Table 98 France: Market Revenue, By Types, 2011 � 2018 ($Million)
Table 99 U.K: Automotive Cabin Comfort Systems Market Volume, By Types, 2011 � 2018 (�000 Units)
Table 100 U.K: Market Revenue, By Types, 2011 � 2018 ($Million)
Table 101 Americas: Automotive Cabin Comfort Systems Market Volume, By Types, 2011 � 2018 (�000 Units)
Table 102 Americas: Market Revenue, By Types, 2011 � 2018 ($Million)
Table 103 U.S: Automotive Cabin Comfort Systems Market Volume, By Types, 2011 � 2018 (�000 Units)
Table 104 U.S: Automotive Revenue, By Types, 2011 � 2018 ($Million)
Table 105 Mexico: Automotive Cabin Comfort Systems Market Volume, By Types, 2011 � 2018 (�000 Units)
Table 106 Mexico: Market Revenue, By Types, 2011 � 2018 ($Million)
Table 107 Brazil: Automotive Cabin Comfort Systems Market Volume, By Types, 2011 � 2018 (�000 Units)
Table 108 Brazil: Market Revenue, By Types, 2011 � 2018 ($Million)
Table 109 Row: Automotive Cabin Comfort Systems Market Volume, By Types, 2011 � 2018 (�000 Units)
Table 110 Row: Market Revenue, By Types, 2011 � 2018 ($Million)
Table 111 Russia: Automotive Cabin Comfort Systems Market Volume, By Types, 2011 � 2018 (�000 Units)
Table 112 Russia: Market Revenue, By Types, 2011 � 2018 ($Million)
Table 113 Australia: Automotive Cabin Comfort Systems Market Volume, By Types, 2011 � 2018 (�000 Units)
Table 114 Australia: Market Revenue, By Types, 2011 � 2018 ($Million)
Table 115 South Africa: Automotive Cabin Comfort Systems Market Volume, By Types, 2011 � 2018 (�000 Units)
Table 116 South Africa: Market Revenue, By Types, 2011 � 2018 ($Million)
Table 117 Power Seats: Market Volume, By Geography, 2011 � 2018 (�000 Units)
Table 118 Power Seats: Market Revenue, By Geography, 2011 � 2018 ($Million)
Table 119 Power Windows: Market Volume, By Geography, 2011 � 2018 (�000 Units)
Table 120 Power Windows: Market Revenue, By Geography, 2011 � 2018 ($Million)
Table 121 Heated Seats: Market Volume, By Geography, 2011 � 2018 (�000 Units)
Table 122 Heated Seats: Market Revenue, By Geography, 2011 � 2018 ($Million)
Table 123 Sunroof Systems: Market Volume, By Geography, 2011 � 2018 (�000 Units)
Table 124 Sunroof Systems: Market Revenue, By Geography, 2011 � 2018 ($Million)
Table 125 Automotive Hvac Systems & Component Manufacturers
Table 126 Air International: Products & Its Descriptions
Table 127 Behr Gmbh: Annual Revenue,By Geography, 2010 � 2011 ($Million)
Table 128 Behr Gmbh: Products & Its Descriptions
Table 129 Brose: Segments & Its Products
Table 130 Calsonic Kansei: Annual Revenue, By Geography, 2011 � 2012 ($Million)
Table 131 Calsonic Kansei: Products & Its Descriptions
Table 132 Delphi: Annual Revenue, By Business Segments, 2011 � 2012 ($Million)
Table 133 Delphi: Products & Its Descriptions
Table 134 Denso: Annual Revenue, By Segments, 2011 � 2012 ($Million)
Table 135 Denso: Products & Its Descriptions
Table 136 Eberspacher: Annual Revenue, By Geography, 2011 � 2012 ($Million)
Table 137 Eberspacher: Products & Its Descriptions
Table 138 Gentherm: Products & Its Categories
Table 139 HCC: Annual Revenue, By Business Segments, 2011 � 2012 ($Million)
Table 140 HCC: Products & Its Descriptions
Table 141 Imasen: Products & Its Descriptions
Table 142 Inalfa Roof Systems: Segments & Its Products With Descriptions
Table 143 Japan Climate Systems: Segments & Its Products
Table 144 Johnson Electric: Annual Revenue, By Business Segments, 2011 - 2012 ($Million)
Table 145 Keihin Corp: Annual Revenue, By Segments, 2011 � 2012 ($Million)
Table 146 Keihin Corp: Products & Its Descriptions
Table 147 Kongsberg Automotive: Annual Revenue, By Segments, 2011 � 2012 ($Million)
Table 148 Kongsberg Automotive: Products & Its Descriptions
Table 149 Sanden Corp: Annual Revenue, By Segments, 2011 � 2012 ($Million)
Table 150 Sanden Corp: Products & Its Types
Table 151 Subros: Products & Its Descriptions
Table 152 Toyota Industries: Annual Revenue, By Segments, 2011 � 2012 ($Million)
Table 153 Toyota Industries: Product Categories & Its Products
Table 154 Valeo: Annual Revenue, By Business Segments, 2011 - 2012 ($Million)
Table 155 Valeo: Products & Its Descriptions
Table 156 Visteon Corp: Annual Revenue, By Geography, 2011 � 2012 ($Million)
Table 157 Visteon Corp: Annual Revenue, By Product Segments, 2011 � 2012 ($Million)
Table 158 Visteon Corp: Products & Its Description
Table 159 Xiezhong International: Annual HVAC Systems Revenue, By Business Segments, 2011 - 2012 ($Million)
List Of Figures (104 Figures)
Figure 1 Automotive HVAC & Cabin Comfort Systems: Market Volume (Million Units) & Revenue ($Billion), By Products, 2013 Vs. 2018
Figure 2 Automotive HVAC Systems: Market Segmentation
Figure 3 Automotive Cabin Comfort Systems: Market Segmentation
Figure 4 Automotive HVAC & Cabin Comfort Systems: Market Revenue ($Billion), 2013 Vs. 2018 & Cagr% (2013 � 2018)
Figure 5 Automotive HVAC Systems: Penetration Rate, By Geography, 2011 � 2018
Figure 6 Automotive HVAC Systems: Market Volume (�000 Units) & Market Volume Share, By Geography, 2011 � 2018
Figure 7 Automotive HVAC Systems: Key Regional/Country Markets
Figure 8 Automotive HVAC Systems: Market Volume, By Vehicle Types, 2011 � 2018 (Million Units)
Figure 9 Automotive HVAC Systems: Market Volume (�000 Units) & Market Volume Share, By Technologies, 2011 � 2018
Figure 10 Automotive HVAC Systems: Components Market Revenue, By Geography, 2011 - 2018 ($Million) & Regional Market Revenue Shares, By Components, 2013
Figure 11 Automotive HVAC Systems: Market Share, By Companies, 2012
Figure 12 Automotive Cabin Comfort Systems: Market Volume, By Types, 2011 � 2018 (�000 Units) & Market Volume Share, By Types, 2013 Vs. 2018
Figure 13 Automotive HVAC & Cabin Comfort Systems : Normalized Market Impact Ofdrivers & Restraints , 2013 � 2018
Figure 14 Automotive HVAC Systems Market: Porter�s Five Force Analysis
Figure 15 Automotive Cabin Comfort Systems Market: Porter�s Five Force Analysis
Figure 16 Automotive HVAC System: Value Chain
Figure 17 Automotive HVAC Systems: Market Share, By Companies, 2012
Figure 18 Automotive HVAC Systems: Market Outlook, By Companies, 2013
Figure 19 Automotive HVAC Systems: Patents Share, By Region/Countries, 2011 � 2013
Figure 20 Automotive HVAC Systems: Patents Share, By Companies, 2011 � 2013
Figure 21 Automotive Cabin Comfort Systems: Patents Share, By Region/Countries, 2011 � 2013
Figure 22 Automotive Cabin Comfort Systems: Patents Share, By Types, 2011 � 2013
Figure 23 Working Of An Automotive Hvac System
Figure 24 Working Of An Automotive Hvac Condenser
Figure 25 Working Of An Automotive Hvac Evaporator
Figure 26 Automotive HVAC & Cabin Comfort Systems: Market Volume Trend, 2011 � 2018 (�000 Units)
Figure 27 Automatic HVAC Systems: Market Volume (�000 Units) & Revenue ($Million), By Geography, 2011 � 2018
Figure 28 Automotive HVAC Systems: Market Volume Share, By Geography, 2013 Vs 2018
Figure 29 Asia: Automotive HVAC Systems Market Volume Share, By Countries, 2013 Vs 2018
Figure 30 Europe: Automotive HVAC Systems Market Volume Share, By Countries, 2013 Vs 2018
Figure 31 Americas: Automotive HVAC Systems Market Volume Share, By Countries, 2013 Vs 2018
Figure 32 Row: Automotive HVAC Systems Market Volume Share, By Countries, 2013 Vs 2018
Figure 33 Automotive Cabin Comfort Systems: Market Volume (�000 Units) & Revenue ($Million), By Geography, 2011 � 2018
Figure 34 Automotive Cabin Comfort Systems: Market Volume Share, By Geography, 2013 Vs 2018
Figure 35 Asia: Automotive Cabin Comfort Systems Market Volume Share, By Countries, 2013 Vs 2018
Figure 36 Europe: Automotive Cabin Comfort Systems Market Volume Share, By Countries, 2013 Vs 2018
Figure 37 Americas: Automotive Cabin Comfort Systems Market Volume Share, By Countries, 2013 Vs 2018
Figure 38 Row: Automotive Cabin Comfort Systems Market Volume Share, By Countries, 2013 Vs 2018
Figure 39 Automotive HVAC & Cabin Comfort Systems: Market Revenue Trend, 2013 - 2018 ($Million)
Figure 40 Automotive HVAC Systems: Market Volume, By Vehicle Types, 2011 � 2018 (�000 Units)
Figure 41 Passenger Cars: Production Trend, 2008 � 2012 (�000 Units)
Figure 42 Passenger Cars: Production Share, By Geography, 2011 Vs 2012 179
Figure 43 Light Commercial Vehicles: Production Share, By Geography 2011 Vs 2012
Figure 44 Heavy Commercial Vehicles: Production Share, By Geography, 2011 Vs 2012
Figure 45 Passenger Car HVAC Systems: Market Volume Share, By Geography, 2013 & 2018
Figure 46 Light Commercial Vehicle HVAC Systems: Market Volume Share, By Geography, 2013 Vs 2018
Figure 47 Heavy Commercial Vehicle HVAC Systems: Market Volume Share, By Geography, 2013 Vs 2018
Figure 48 Automotive HVAC Systems: Technology Market Snapshot
Figure 49 Automatic HVAC Systems: Market Volume Share, By Geography, 2013 Vs 2018
Figure 50 Manual Hvac Systems: Market Volume Share, By Geography, 2013 Vs 2018
Figure 51 Automotive HVAC Systems: Market Revenue, By Components, 2011 � 2018 ($Million)
Figure 52 Automotive HVAC Systems: Component Market Snapshot
Figure 53 Automotive Cabin Comfort Systems: Market Volume (�000 Units), By Types, 2011 � 2018 & Market Volume Share, By Types, 2013 Vs 2018
Figure 54 Automotive Cabin Comfort Systems: Market Volume Share, By Types, 2013 Vs 2018 220
Figure 55 Automotive Cabin Comfort Systems: Market Revenue Share, By Types, 2013 Vs 2018
Figure 56 Asia: Automotive Cabin Comfort Systems Market Volume Share, By Types, 2013 Vs 2018
Figure 57 Asia: Automotive Cabin Comfort Systems Market Revenue Share, By Types, 2013 Vs 2018
Figure 58 China: Automotive Cabin Comfort Systems Market Volume Share, By Types, 2013 Vs 2018
Figure 59 China: Automotive Cabin Comfort Systems Market Revenue Share, By Types, 2013 Vs 2018
Figure 60 Japan: Automotive Cabin Comfort Systems Market Volume Share, By Types, 2013 Vs 2018
Figure 61 Japan: Automotive Cabin Comfort Systems Market Revenue Share, By Types, 2013 Vs 2018
Figure 62 South Korea: Automotive Cabin Comfort Systems Market Volume Share, By Types, 2013 Vs 2018
Figure 63 South Korea: Automotive Cabin Comfort Systems Market Revenue Share, By Types, 2013 Vs 2018
Figure 64 Europe: Automotive Cabin Comfort Systems Market Volume Share, By Types, 2013 Vs 2018
Figure 65 Europe: Automotive Cabin Comfort Systems Market Revenue Share, By Types, 2013 Vs 2018
Figure 66 Germany: Automotive Cabin Comfort Systems Market Volume Share, By Types, 2013 Vs 2018
Figure 67 Germany: Automotive Cabin Comfort Systems Market Revenue Share, By Types, 2013 Vs 2018
Figure 68 France: Automotive Cabin Comfort Systems Market Volume Share, By Types, 2013 Vs 2018
Figure 69 France: Automtovie Cabin Comfort Systems Market Revenue Share, By Types, 2013 Vs 2018
Figure 70 U.K: Automotive Cabin Comfort Systems Market Volume Share, By Types, 2013 Vs 2018
Figure 71 U.K: Automotive Cabin Comfort Systems Market Revenue Share, By Types, 2013 Vs 2018
Figure 72 Americas: Automotive Cabin Comfort Systems Market Volume Share, By Types, 2013 Vs 2018 (�000 Units)
Figure 73 Americas: Automotive Cabin Comfort Systems Market Revenue Share, By Types, 2013 Vs 2018 ($Million)
Figure 74 U.S: Automotive Cabin Comfort Systems Market Volume Share, By Types, 2013 Vs 2018
Figure 75 U.S: Automotive Cabin Comfort Systems Market Revenue Share, By Types, 2013 Vs 2018
Figure 76 Mexico: Automotive Cabin Comfort Systems Market Volume Share, By Types, 2013 Vs 2018
Figure 77 Mexico: Automotive Cabin Comfort Systems Market Revenue Share, By Types, 2013 � 2018
Figure 78 Brazil: Automotive Cabin Comfort Systems Market Volume Share, By Types, 2013 Vs 2018
Figure 79 Brazil: Automotive Cabin Comfort Systems Market Revenue Share, By Types, 2013 Vs 2018
Figure 80 Row: Automotive Cabin Comfort Systems Market Volume Share, By Types, 2013 Vs 2018
Figure 81 Row: Automotive Cabin Comfort Systems Market Revenue Share, By Types, 2013 Vs 2018
Figure 82 Russia: Automotive Cabin Comfort Systems Market Volume Share, By Types, 2013 Vs 2018
Figure 83 Russia: Automotive Cabin Comfort Systems Market Revenue Share, By Types, 2013 Vs 2018
Figure 84 Australia: Automotive Cabin Comfort Systems Market Volume Share, By Types, 2013 Vs 2018
Figure 85 Australia: Automotive Cabin Comfort Systems Market Revenue Share, By Types, 2013 Vs 2018
Figure 86 South Africa: Automotive Cabin Comfort Systems Market Volume Share, By Types, 2013 Vs 2018
Figure 87 South Africa: Automotive Cabin Comfort Systems Market Revenue Share, By Types, 2013 Vs 2018
Figure 88 Power Seats: Market Volume Share, By Geography, 2013 Vs 2018
Figure 89 Power Seats: Market Revenue Share, By Geography, 2013 Vs 2018
Figure 90 Power Windows: Market Volume Share, By Geography, 2013 Vs 2018
Figure 91 Power Windows: Market Revenue Share, By Geography, 2013 Vs 2018
Figure 92 Heated Seats: Market Volume Share, By Geography, 2013 Vs 2018
Figure 93 Heated Seats: Market Revenue Share, By Geography, 2013 Vs 2018
Figure 94 Sunroof Systems: Market Volume Share, By Geography, 2013 Vs 2018
Figure 95 Sunroof Systems: Market Revenue Share, By Geography, 2013 Vs 2018
Figure 96 Automotive HVAC Systems & Component Manufacturers, By Geography
Figure 97 Automotive HVAC System Market: Key Growth Strategies Share, 2010 � 2013
Figure 98 Behr Gmbh: Swot Analysis
Figure 99 Calsonic Kansei: Swot Analysis
Figure 100 Denso: Swot Analysis
Figure 101 Johnson Electric: Swot Analysis
Figure 102 Keihin Corp: Swot Analysis
Figure 103 Valeo: Swot Analysis
Figure 104 Visteon Corp: Swot Analysis


Growth opportunities and latent adjacency in Automotive HVAC Market