Automotive Logistics Market by Activity (Warehouse, Transport), Logistics Service (Inbound, Outbound, Reverse, Aftermarket), Mode of transport (Roadways, Railways, Maritime, Airways), Distribution, and Region - Global Forecast to 2025


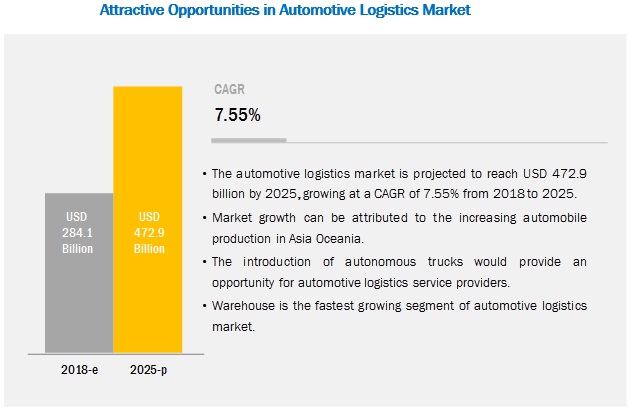
[167 Pages Report] The automotive logistics market size was valued at USD 284.1 billion in 2018 and is expected to reach USD 472.9 billion by 2025, at a CAGR of 7.55% during the forecast period 2018-2025. Increasing vehicle production, upcoming infrastructure projects, and the advent of electric vehicles are the major reasons for market growth.
Domestic distribution to be the largest contributor in the automotive logistics market during the forecast period
Domestic logistics include the services required to transport automotive vehicle and goods within a country and region. For example, a passenger car manufactured in China and shipped to India would be included in the domestic logistics market of Asia Oceania. International logistics market in a region includes the logistics services required to transport vehicles from one region to another. For example, a passenger car manufactured in Asia and transported to Europe would be included in the international logistics market of Asia Oceania. Asia Oceania is the largest market for domestic logistics due to large-scale automobile production in China, Japan, and India. Europe is the second largest market as the EU has facilitated the easy movement of man and materials amongst the EU counties. Similarly, in North America, cars and components manufactured in the US can be easily transported to Canada and Mexico. Thus, domestic distribution is expected to grow at a brisk rate during the forecast period.
Warehouse to have the fastest growth in this market during the forecast period
The key players operating in the logistics industry also offer warehousing services to OEMs as well as Tier I/Tier II component manufacturers. These services offered by logistics providers ensure that OEMs can deploy just in time (JIT) and just in sequence (JIS) assembly line production. The demand for these services depends on vehicle production. Hence, the regions with higher vehicle production will have a larger share in the warehousing market. In addition to warehousing, logistics service providers also offer assembly services for OEMs. For instance, DSV provides component assembly and warehousing services for Volvo Cars at Ghent, Belgium. Volvo manufactures its XC60, S60, V40, and V40 Cross Country models at the plant. During the forecast period, the warehouse segment is expected to witness the fastest growth due to the pre-assembly of components and increased vehicle production.
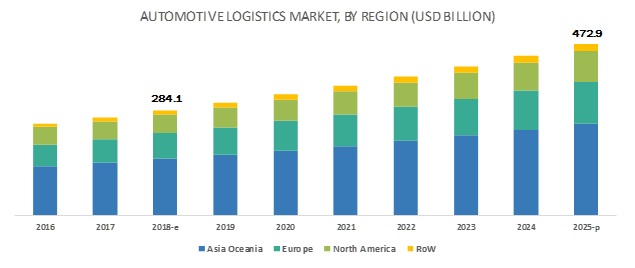
Asia Oceania is expected to account for the largest market size during the forecast period
The automotive logistics industry has witnessed substantial growth, particularly in emerging economies such as China and India. Asia Oceania is expected to witness an annual growth of 7-8% in line with global growth during the next 8 years. The region has witnessed growth in automotive production due to low wages, availability of raw materials, increased demand for vehicles, and presence of major OEMs such as Toyota (Japan), Maruti Suzuki (India), SAIC (China), Honda (Japan), Geely (China), and Hyundai (South Korea). China, Japan, India, and South Korea export vehicles to various countries in Europe and North America.
The Belt and Road Initiative, which aims to strengthen infrastructure, trade, and investment links between China and several other countries, is among the several infrastructure projects that are expected to drive the market in the Asia Oceania region. The Indian Railways is working toward improving its logistics services with the development of 6 dedicated freight corridors (DFCs) that span 2800 km across the eastern and western regions of the country.
Key Market Players
The automotive logistics market is consolidated and dominated by a few global players. The key players in the market are DHL (Germany), XPO (US), SNCF (France), Kuehne + Nagel (Switzerland), DSV (Denmark), Ryder (US), CEVA (UK), Imperial (South Africa), Panalpina (Switzerland), and Expeditors (US). The industry has adopted key strategies such as expansions, new product developments, and partnerships. For instance, Kuehne + Nagel expanded its regional network in Central Asia to offer an integrated service portfolio to both local and international customers from all major industries throughout the region.
Scope of the Report
|
Report Metric |
Details |
|
Market Size Available for Years |
2016–2025 |
|
Base Year Considered |
2017 |
|
Forecast Period |
2018–2025 |
|
Forecast Units |
Value (USD billion) |
|
Segments Covered |
By mode of transport, By activity, By logistics services, By distribution, By region |
|
Geographies Covered |
Asia Oceania, Europe, North America, and RoW |
|
Companies Covered |
DHL (Germany), XPO (US), SNCF (France), Kuehne + Nagel (Switzerland), and DSV (Denmark) among others with a total of 21 company profiles |
This research report segments the global market by the mode of transport, activity, logistics services, transportation, distribution network, and region.
Automotive Logistics Market, By Mode of Transport
- Roadways
- Airways
- Maritime
- Railway
Automotive Logistics Market, By Activity
- Warehousing & Handling
- Transportation & Handling
Automotive Logistics Market, By Logistics Solutions
- Inbound logistics
- Outbound logistics
- Reverse logistics
- Aftermarket logistics
Automotive Logistics Market, By Distribution
- Domestic
- International
Automotive Logistics Market, By Region
-
Asia Oceania
- India
- Japan
- China
-
Europe
- France
- Germany
- Italy
- Spain
- UK
- Rest of Europe
-
North America
- US
- Canada
- Mexico
-
Rest of the World (RoW)
- Brazil
- Russia
- South Africa
- RoW Others
Key Questions addressed by the report
- Which logistics services are expected to dominate in the future?
- How are the industry players addressing the challenge of maintaining a balance between on time delivery and low-cost?
- Which mode of transport has the fastest growth in a region?
- How would electric vehicles affect the automotive logistics supply chain?
- What are the key strategies adopted by the players? Which new advancements are the game changers?
- What are the key revenue impacting strategies that would drive the market in the future?
- How are the industry players placed in competitive leadership mapping?
To speak to our analyst for a discussion on the above findings, click Speak to Analyst
 Exclusive indicates content/data unique to MarketsandMarkets and not available with any competitors.
Table of Contents
1 Introduction (Page No. - 16)
1.1 Objectives of the Study
1.2 Market Definition
1.3 Market Scope
1.3.1 Markets Covered
1.3.2 Years Considered for the Study
1.4 Currency
1.5 Limitations
1.6 Package Size
1.7 Stakeholders
2 Research Methodology (Page No. - 21)
2.1 Research Data
2.2 Secondary Data
2.2.1 Key Secondary Sources for Automotive Logistics
2.2.2 Key Data From Secondary Sources
2.3 Primary Data
2.3.1 Sampling Techniques & Data Collection Methods
2.3.2 Primary Participants
2.4 Market Size Estimation
2.4.1 Top-Down Approach
2.4.2 Bottom-Up Approach
2.5 Market Breakdown and Data Triangulation
2.6 Assumptions
3 Executive Summary (Page No. - 29)
4 Premium Insights (Page No. - 32)
4.1 Attractive Opportunities in Automotive Logistics Market
4.2 Market in Asia Oceania, By Logistics Service Type and Country
4.3 Market, By Country
4.4 Market, By Activity
4.5 Market, By Distribution
4.6 Market, By Logistics Service
4.7 Market, By Mode of Transport
5 Market Overview (Page No. - 38)
5.1 Introduction
5.1.1 Drivers
5.1.1.1 Increase in Vehicle Production to Increase the Demand for Raw Materials and Components
5.1.1.1.1 Passenger Cars
5.1.1.1.2 Commercial Vehicles
5.1.1.1.3 Battery & Hybrid Electric Vehicles
5.1.1.1.4 Impact of Import & Export
5.1.1.2 Infrastructure Development in Developing Countries to Boost the Usage of Logistics
5.1.2 Restraints
5.1.2.1 Logistics Players Require High Initial Capital Investment
5.1.3 Opportunities
5.1.3.1 Implementation/Usage of Driverless Vehicles
5.1.3.2 Usage of Blockchain for Efficient Logistics Operations
5.1.4 Challenges
5.1.4.1 Assuring Continuity of Stock
5.1.4.2 Lack of Full-Service Tracking Solution
6 Industry Trends (Page No. - 50)
6.1 Introduction
6.2 Value Chain Analysis
6.3 Revenue Impact
6.4 Advancements in Technology
6.4.1 Internet of Things (IoT) in Logistics
6.4.2 3pl
6.4.3 4pl
6.4.4 5pl
6.4.5 Analytics and Big Data
7 Global Market, By Activity (Page No. - 54)
Note: The Chapter is Further Segmented By Region (Asia Oceania, Europe, North America, and RoW)
7.1 Introduction
7.1.1 Research Methodology
7.1.2 Assumptions & Definitions
7.1.3 Industry Insights
7.2 Warehousing
7.2.1 Europe is the Second Largest Logistics Market for Warehousing
7.3 Transportation
7.3.1 Asia Oceania is the Largest Automotive Logistics Market
8 Global Market, By Logistics Service (Page No. - 61)
Note: The Chapter is Further Segmented By Region (Asia Oceania, Europe, North America, and RoW)
8.1 Introduction
8.1.1 Research Methodology
8.1.2 Assumptions
8.1.3 Industry Insights
8.2 Inbound
8.2.1 Europe to Be the Second Largest Market for Inbound Logistics
8.3 Outbound
8.3.1 Asia Oceania is the Largest Market for Outbound Logistics Owing to Its Huge Vehicle Production
8.4 Reverse
8.4.1 Reverse Logistics has Minimal Share in the Automotive Logistics Market
8.5 Aftermarket
8.5.1 Increasing Vehicle Parc has Led to Increasing Demand for Aftermarket Automotive Logistics
9 Global Market, By Mode of Transport (Page No. - 71)
Note: The Chapter is Further Segmented By Region (Asia Oceania, Europe, North America, and RoW)
9.1 Introduction
9.1.1 Research Methodology
9.1.2 Assumptions
9.1.3 Industry Insights
9.2 Roadways
9.2.1 Asia Oceania is the Largest Market for Roadways
9.3 Railways
9.3.1 North America is the Second Largest Market for Railways Automotive Logistics
9.4 Maritime
9.4.1 Maritime Transport is the Second Most Preferred Mode of Transport in the Automotive Logistics Market
9.5 Airways
9.5.1 Airways has the Smallest Share Amongst All Modes of Transport
10 Global Market, By Distribution (Page No. - 81)
Note: The Chapter is Further Segmented By Region (Asia Oceania, Europe, North America, and RoW)
10.1 Introduction
10.1.1 Research Methodology
10.1.2 Assumptions
10.1.3 Industry Insights
10.2 Domestic
10.2.1 Europe is the Second Largest Market for Domestic Automotive Logistics
10.3 International
10.3.1 Asia Oceania is the Largest Market for International Automotive Logistics
11 Global Market, By Region (Page No. - 88)
Note: The Chapter is Further Segmented By Logistics Service (Inbound Logistics, Outbound Logistics, Reverse Logistics and Aftermarket Logistics)
11.1 Introduction
11.1.1 Research Methodology
11.1.2 Assumptions
11.1.3 Industry Insights
11.2 Asia Oceania
11.2.1 China
11.2.1.1 Outbound Logistics has the Second Largest Share in China
11.2.2 India
11.2.2.1 Inbound Logistics is the Largest Segment in India
11.2.3 Japan
11.2.3.1 Reverse Logistics has the Smallest Share in Japan
11.2.4 South Korea
11.2.4.1 Inbound Logistics is the Largest Segment in South Korea
11.2.5 Rest of Asia Oceania
11.2.5.1 Outbound Logistics is the Second Largest Segment in Rest of Asia Oceania
11.3 Europe
11.3.1 Germany
11.3.1.1 Inbound Logistics is the Largest Segment in Germany
11.3.2 UK
11.3.2.1 Outbound Logistics is the Second Largest Segment in the Uk
11.3.3 France
11.3.3.1 Aftermarket Logistics is the Fastest Growing Segment in France
11.3.4 Spain
11.3.4.1 Inbound Logistics is the Largest Segment in Spain
11.3.5 Turkey
11.3.5.1 Outbound Logistics is the Second Largest Segment in Turkey
11.3.6 Russia
11.3.6.1 Aftermarket Logistics is the Fastest Growing Segment in Russia
11.3.7 Rest of Europe
11.3.7.1 Reverse Logistics is the Smallest Segment in Rest of Europe
11.4 North America
11.4.1 US
11.4.1.1 Aftermarket Logistics is the Fastest Growing Segment in the Us
11.4.2 Mexico
11.4.2.1 Inbound Logistics is the Largest Segment in Mexico
11.4.3 Canada
11.4.3.1 Outbound Logistics is the Second Largest Segment in Canada
11.5 RoW
11.5.1 Brazil
11.5.1.1 Inbound Logistics is the Largest Segment in Brazil
11.5.2 South Africa
11.5.2.1 Outbound Logistics is the Second Largest Segment in South Africa
11.5.3 RoW Others
11.5.3.1 Reverse Logistics is the Smallest Segment in the RoW Others
12 Competitive Landscape (Page No. - 112)
12.1 Overview
12.2 Competitive Leadership Mapping
12.2.1 Introduction
12.2.2 Visionary Leaders
12.2.3 Innovators
12.2.4 Dynamic Differentiators
12.2.5 Emerging Companies
12.3 Competitive Leadership Mapping: Automotive Logistics Service Providers
12.3.1 Competitive Benchmarking
12.3.1.1 Company-Wise Business Strategy Analysis
12.3.1.2 Company-Wise Product Offering Analysis
12.4 Market Share Analysis
12.5 Competitive Scenario
12.5.1 New Product Developments
12.5.2 Expansions
12.5.3 Mergers & Acquisitions
12.5.4 Partnerships/Agreements/Supply Contracts/ Collaborations/Joint Ventures
13 Company Profiles (Page No. - 122)
(Business Overview, Products Offered, Recent Developments, SWOT Analysis, MnM View)*
13.1 DHL
13.2 XPO
13.3 SNCF
13.4 Kuehne + Nagel
13.5 DSV
13.6 Ryder
13.7 CEVA
13.8 Imperial
13.9 Panalpina
13.10 Expeditors
13.11 Additional Company Profiles
13.11.1 North America
13.11.1.1 Blg Logistics
13.11.1.2 Penske Logistics
13.11.1.3 Neovia
13.11.2 Europe
13.11.2.1 Dachser Intelligent Logistics
13.11.2.2 Gefco
13.11.2.3 Schnellecke
13.11.2.4 Db Schenker
13.11.3 Asia Oceania
13.11.3.1 Hitachi Transport System
13.11.3.2 Yusen Logistics
13.11.3.3 Kintetsu
*Details on Business Overview, Products Offered, Recent Developments, SWOT Analysis, MnM View Might Not Be Captured in Case of Unlisted Companies.
14 Appendix (Page No. - 161)
14.1 Primary Insights
14.2 Discussion Guide
14.3 Knowledge Store: Marketsandmarkets’ Subscription Portal
14.4 Available Customization
14.4.1 Global Market, By Country, By Mode of Transport
14.4.1.1 Roadways Logistics
14.4.1.2 Railways Logistics
14.4.1.3 Maritime Logistics
14.4.1.4 Airways Logistics
14.5 Related Reports
14.6 Author Details
List of Tables (65 Tables)
Table 1 Currency Exchange Rates (W.R.T. USD)
Table 2 Key Players Competitive Benchmarking
Table 3 Automotive Logistics Market Dynamics and Periodic Impact Analysis
Table 4 Logistics Performance Index (Lpi) for Key Countries, 2018
Table 5 Market, By Activity, 2016–2025 (USD Billion)
Table 6 Warehousing: Market, By Region, 2016–2025 (USD Billion)
Table 7 Transportation: Market, By Region, 2016–2025 (USD Billion)
Table 8 Asia Oceania: Market, By Activity, 2016–2025 (USD Billion)
Table 9 Europe: Market, By Activity, 2016–2025 (USD Billion)
Table 10 North America: Market, By Activity, 2016–2025 (USD Billion)
Table 11 RoW: Market, By Activity, 2016–2025 (USD Billion)
Table 12 Global Market, By Logistics Service, 2016–2025 (USD Billion)
Table 13 Inbound: Market, By Region, 2016–2025 (USD Billion)
Table 14 Outbound: Market, By Region, 2016–2025 (USD Billion)
Table 15 Reverse: Market, By Region, 2016–2025 (USD Billion)
Table 16 Aftermarket: Market, By Region, 2016–2025 (USD Billion)
Table 17 Asia Oceania: Market, By Logistics Service, 2016–2025 (USD Billion)
Table 18 Europe: Market, By Logistics Service, 2016–2025 (USD Billion)
Table 19 North America: Market, By Logistics Service, 2016–2025 (USD Billion)
Table 20 RoW: Market, By Logistics Service, 2016–2025 (USD Billion)
Table 21 Global Market, By Mode of Transport, 2016–2025 (USD Billion)
Table 22 Roadways: Market, By Region, 2016–2025 (USD Billion)
Table 23 Railways: Market, By Region, 2016–2025 (USD Billion)
Table 24 Maritime: Market, By Region, 2016–2025 (USD Billion)
Table 25 Airways: Market, By Region, 2016–2025 (USD Billion)
Table 26 Asia Oceania: Market, By Mode of Transport, 2016–2025 (USD Billion)
Table 27 Europe: Market, By Mode of Transport, 2016–2025 (USD Billion)
Table 28 North America: Market, By Mode of Transport, 2016–2025 (USD Billion)
Table 29 RoW: Market, By Mode of Transport, 2016–2025 (USD Billion)
Table 30 Global Market, By Distribution, 2016–2025 (USD Billion)
Table 31 Domestic: Market, By Region, 2016–2025 (USD Billion)
Table 32 International: Market, By Region, 2016–2025 (USD Billion)
Table 33 Asia Oceania: Market, By Distribution, 2016–2025 (USD Billion)
Table 34 Europe: Market, By Distribution, 2016–2025 (USD Billion)
Table 35 North America: Market, By Distribution, 2016–2025 (USD Billion)
Table 36 RoW: Automotive Logistics Market, By Distribution, 2016–2025 (USD Billion)
Table 37 Global Market, By Region, 2016–2025 (USD Billion)
Table 38 Global Market, By Logistics Service, 2016–2025 (USD Billion)
Table 39 Asia Oceania: Market, By Country, 2016–2025 (USD Billion)
Table 40 Asia Oceania: Market, By Logistics Service, 2016–2025 (USD Billion)
Table 41 China: Market, By Logistics Service, 2016–2025 (USD Billion)
Table 42 India: Market, By Logistics Service, 2016–2025 (USD Billion)
Table 43 Japan: Market, By Logistics Service, 2016–2025 (USD Billion)
Table 44 South Korea: Market, By Logistics Service, 2016–2025 (USD Billion)
Table 45 Rest of Asia Oceania: Market, By Logistics Service, 2016–2025 (USD Billion)
Table 46 Europe: Market, By Country, 2016–2025 (USD Billion)
Table 47 Europe: Market, By Logistics Service, 2016–2025 (USD Billion)
Table 48 Germany: Market, By Logistics Service, 2016–2025 (USD Billion)
Table 49 UK: Market, By Logistics Service, 2016–2025 (USD Billion)
Table 50 France: Market, By Logistics Service, 2016–2025 (USD Billion)
Table 51 Spain: Market, By Logistics Service, 2016–2025 (USD Billion)
Table 52 Turkey: Market, By Logistics Service, 2016–2025 (USD Billion)
Table 53 Russia: Market, By Logistics Service, 2016–2025 (USD Billion)
Table 54 Rest of Europe: Market, By Logistics Service, 2016–2025 (USD Billion)
Table 55 North America: Market, By Country, 2016–2025 (USD Billion)
Table 56 North America: Market, By Logistics Service, 2016–2025 (USD Billion)
Table 57 US: Market, By Logistics Service, 2016–2025 (USD Billion)
Table 58 Mexico: Market, By Logistics Service, 2016–2025 (USD Billion)
Table 59 Canada: Market, By Logistics Service, 2016–2025 (USD Billion)
Table 60 RoW: Market, By Country, 2016–2025 (USD Billion)
Table 61 RoW: Market, By Logistics Service, 2016–2025 (USD Billion)
Table 62 Brazil: Market, By Logistics Service, 2016–2025 (USD Billion)
Table 63 South Africa: Market, By Logistics Service, 2016–2025 (USD Billion)
Table 64 RoW Others: Market, By Logistics Service, 2016–2025 (USD Billion)
Table 65 Automotive Logistics Market Share, for Key Players, 2017
List of Figures (50 Figures)
Figure 1 Automotive Logistics Market Segmentation
Figure 2 Market: Research Design
Figure 3 Research Methodology Model
Figure 4 Breakdown of Primary Interviews
Figure 5 Automotive Logistic Market: Top-Down Approach
Figure 6 Automotive Logistic Market: Bottom-Up Approach
Figure 7 Automotive Logistics: Market Outlook
Figure 8 Market, By Region, 2018 vs 2025 (USD Billion)
Figure 9 Increasing Vehicle Production to Drive this Market
Figure 10 Inbound Logistics and China Accounted for the Largest Share in the Asia Oceania Market, By Logistics Service and Country, Respectively, in 2018 (USD Billion)
Figure 11 India, Turkey, and Mexico Expected to Grow at the Highest Rate During the Forecast Period
Figure 12 Transportation Segment Expected to Hold the Largest Share of the Market, By Activity, 2018 vs 2025 (USD Billion)
Figure 13 Domestic Distribution Expected to Lead the Market, By Distribution, 2018 vs 2025 (USD Billion)
Figure 14 Inbound Logistics to Hold the Largest Share in the Market, 2018 vs 2025 (USD Billion)
Figure 15 Roadways to Hold the Largest Share in the Market, 2018 vs 2025 (USD Billion)
Figure 16 Automotive Logistics Ecosystem
Figure 17 Automotive Logistics: Market Dynamics
Figure 18 Global Vehicle Production, By Vehicle Type, 2015–2025 (Million Units)
Figure 19 Region-Wise Bus Production, 2015–2017 ('000 Units)
Figure 20 BEV & HEV Sales, 2017 vs 2020 vs 2025 (‘000 Units)
Figure 21 EU Motor Vehicle Imports From Major Countries in 2017 (Units)
Figure 22 Road Infrastructure Investment for Key Countries, 2010–2015 (USD Billion)
Figure 23 Levels of Automation
Figure 24 Automotive Logistic Market:Value Chain
Figure 25 Key Trends and Their Impact on Logistics Service Provider’s Revenue
Figure 26 Transportation to Hold the Largest Share in the Market, 2018 vs 2025 (USD Billion)
Figure 27 Inbound to Hold the Largest Share in the Market, 2018 vs 2025 (USD Billion)
Figure 28 Roadways to Hold the Largest Share in the Market, 2016–2025 (USD Billion)
Figure 29 Domestic Automotive Logistics to Hold the Largest Share in the Market, 2016–2025 (USD Billion)
Figure 30 Market, By Region, 2018 vs 2022 vs 2025 (USD Billion)
Figure 31 Asia Oceania: Automotive Logistic Market Snapshot
Figure 32 Europe: Market, By Country, 2018 vs 2022 vs 2025 (USD Billion)
Figure 33 North America: Market, By Country, 2018 vs 2025, (USD Billion)
Figure 34 RoW: Automotive Logistics Market, By Country, 2018 vs 2025, (USD Billion)
Figure 35 Companies Adopted Expansion as A Key Growth Strategy
Figure 36 DHL: Company Snapshot
Figure 37 DHL: SWOT Analysis
Figure 38 XPO: Company Snapshot
Figure 39 XPO: SWOT Analysis
Figure 40 SNCF: Company Snapshot
Figure 41 SNCF: SWOT Analysis
Figure 42 Kuehne + Nagel: Company Snapshot
Figure 43 Kuehne + Nagel: SWOT Analysis
Figure 44 DSV: Company Snapshot
Figure 45 DSV: SWOT Analysis
Figure 46 Ryder: Company Snapshot
Figure 47 CEVA: Company Snapshot
Figure 48 Imperial: Company Snapshot
Figure 49 Panalpina: Company Snapshot
Figure 50 Expeditors: Company Snapshot
The study involves 4 main activities for estimating the current size of the automotive logistics market. Exhaustive secondary research was done to collect information on the market for automotive logistics services. The next step was to validate these findings, assumptions, and market analysis with industry experts across value chains through primary research. Bottom-up and top-down approaches were employed to estimate the complete market size for different segments considered under this study.
Secondary Research
The secondary sources referred for this research study include reports on the Cargo Handling Equipment Market, IoT Fleet Management Market, and automotive logistics associations. The secondary data has been collected and analyzed to arrive at the overall market size, which has been further validated through primary research. Some of the key secondary sources used are American Association of Port Authorities (AAPA), American Trucking Association (ATA), Association of European Vehicle Logistics (ECG), and Society of Indian Automobile Manufacturers (SIAM).
Primary Research
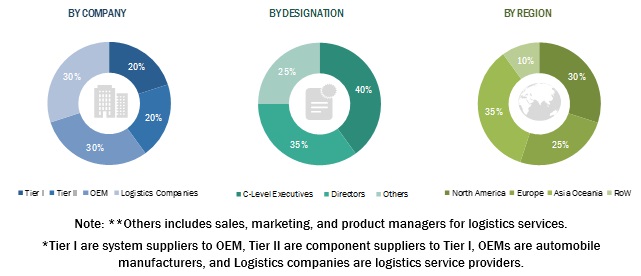
Extensive primary research has been conducted after acquiring an understanding of this market scenario through secondary research. Several primary interviews have been conducted with market experts from both the demand- and supply-side players across 4 major regions, namely, North America, Europe, Asia Oceania, and the Rest of the World (Latin America and Africa). Primary data has been collected through questionnaires, emails, and telephonic interviews. In the canvassing of primaries, we have strived to cover various departments within organizations, such as sales, operations, and administration, to provide a holistic viewpoint in our report.
After interacting with industry experts, we have also conducted brief sessions with highly experienced independent consultants to reinforce the findings from our primaries.
To know about the assumptions considered for the study, download the pdf brochure
Market Size Estimation
The top-down and bottom-up approaches have been used to estimate and validate the size of the global market.
The top-down approach has been used to determine the market size, by value, of the regional automotive logistics market. It has been derived by identifying the region-wise utilization rate or usage pattern of automotive logistics based on regional vehicle production. The regional market has been further segmented by activity and distribution.
The bottom-up approach has been used at the country level to estimate the market size by mode of transport and logistics services. The country-wise demand for logistics services and mode of transport are used to determine the regional level market. These are added to derive the global market.
Data Triangulation
All percentage shares, splits, and breakdowns have been determined using secondary sources and verified through primary sources. All parameters that are said to affect the markets covered in this research study have been accounted for, viewed in extensive detail, verified through primary research, and analyzed to get the final quantitative and qualitative data. The data has been consolidated, enhanced with detailed inputs and analysis from MarketsandMarkets, and presented in this report.
Report Objectives
- To define, describe, and forecast the global market based on mode of transport, activity, logistics services, distribution, and region
- To forecast the automotive logistics market size, by value, based on the mode of transport (roadways, airways, maritime, and railways)
- To forecast the country-level market size, by value, based on logistics services (inbound logistics, outbound logistics, reverse logistics, and aftermarket logistics)
- To forecast the global market size, by value, based on transportation and distribution network (domestic and international)
- To forecast the automotive logistic market size, by value, based on activity (warehouse and transportation)
- To forecast the automotive logistic market size, by value, with respect to 4 main regions (along with key countries)—Asia Oceania, Europe, North America, and RoW
- To provide detailed information on the major factors influencing the growth of the market (drivers, restraints, opportunities, and industry-specific challenges)
- To analyze the opportunities in the market for stakeholders and provide details of the competitive landscape for market leaders
- To strategically profile key players and comprehensively analyze their market shares and core competencies
- To track and analyze competitive developments such as joint ventures, mergers & acquisitions, new product developments, and R&D in the automotive logistics market
Available Customizations
With the given market data, MarketsandMarkets offers customizations according to the company’s specific needs.
The following customization options are available for the report:
Automotive Logistics Market, By Country, By Mode of Transport
- Roadways Logistics
- Railways Logistics
- Maritime Logistics
- Airways Logistics
(Note: Countries that are included in the study: China, India, Japan, South Korea, France, Germany, Italy, Spain, Russia, UK, Turkey, Canada, US, Mexico, Brazil, South Africa)


Growth opportunities and latent adjacency in Automotive Logistics Market
Does this report cover country-level information and market size on Automotive Logistics segments? Especially China, India and the US.
I am interested to understand the impact of COVID-19 specifically on automotive logistics market. Is this something that will be covered in the report?
I would like to understand the automotive logistics industry trends (especially in North America, Europe and Japan) and competitive landscape in greater details.