Bio-Insecticides Market for Thrips Control by Crop (Fruits, Vegetables & Flowers), Formulation (Liquid, Water-dispersible Granules, Wettable Powder & Pellets), Active Ingredients (Predators, Parasites & Biorationals), and by Region - Global Forecasts to 2020


The bio-insecticides market for thrips control is estimated to be valued at USD 170.6 Million in 2015. The market is projected to reach USD 418.3 Million by 2020 at a CAGR of 19.7% from 2015 to 2020. The bio-insecticides market for thrips control is segmented on the basis of its crop type, formulation, and active ingredient. It is further segmented on the basis of regions, such as North America, Europe, Asia-Pacific, Latin America, and Rest of the World (RoW). With the increasing demand for enhanced quality agricultural output and rising need for organic and environment-friendly crop protection solutions, the use of bio-insecticides is expected to enhance the market growth.
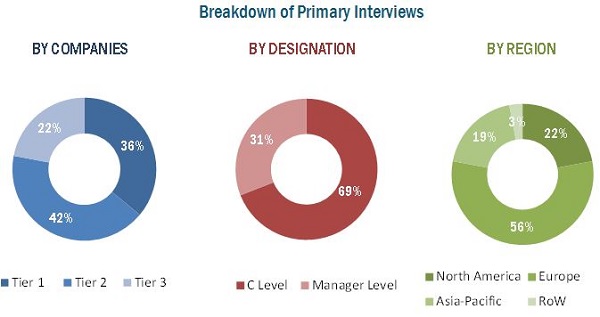
This report includes estimations of market sizes for value (USD million) with the base year as 2014, and the forecast period from 2015 to 2020. Top-down and bottom-up approaches have been used to estimate and validate the size of the bio-insecticides market for thrips control and the size of various other dependent submarkets. Key players in the market have been identified through secondary research, and their market share in respective regions has been determined through primary and secondary research. All percentage shares, splits, and breakdowns have been determined using secondary sources and were verified through primary sources.
To know about the assumptions considered for the study, download the pdf brochure
This report provides both qualitative and quantitative analyses of the bio-insecticides market for thrips control, the competitive landscape, and the preferred development strategies of key players. The key players preferred partnerships, collaborations, expansions, and acquisitions as favored strategies to gain a larger share in the market. The report also analyzes the market dynamics and issues faced by leading players.
The report is targeted toward the existing players in the industry, which include chemical manufacturers, bio-insecticide suppliers, traders & distributors, bio-insecticide exporters & importers, and research institutions. Key participants in the supply chain of bio-insecticides market for thrips control are raw material suppliers, government bodies, distributors, exporters related to bio-insecticides, and end users such as farmers engaged in agribusiness. Upstream players offering bio-insecticides to other manufacturers involved in biological pest control manufacturing and treating have also been included in this report.
�The study answers several questions for stakeholders, primarily which market segments to focus on in the next two to five years for prioritizing efforts and investments.�
Get online access to the report on the World's First Market Intelligence Cloud
Request Sample Scope of the Report

On the basis of Crop Type, the market is segmented as follows:
- Fruits
- Vegetables
- Flowers
- Others (including field crops, forest crops, fiber crops, and sugar crops)
On the basis of Formulation, the market is segmented as follows:
- Liquid formulation
- Water-dispersible granules
- Wettable powder
- Pellets
On the basis of Active Ingredients, the market is segmented as follows:
- Predators
- Parasites
- Biorationals
On the basis of Region, the market is segmented as follows:
- North America
- Europe
- Asia-Pacific
- Latin America
- RoW
Available Customizations
With the given market data, MarketsandMarkets offers customizations according to the client-specific needs.
The following customization options are available for the report:
Product Analysis
- Product matrix, which gives a detailed comparison of the product portfolio of each company
Company Information
- Detailed analysis and profiling of additional market players (up to five)
The bio-insecticides market for thrips control is projected to grow at a CAGR of 19.7% from 2015 to reach a projected value of USD 418.3 Million by 2020. The market growth is driven by increasing demand for biological pest controls, increasing awareness toward the impact of chemicals used for pest control, rising world population resulting into increased food consumption and demand, and the promising results of using bio-insecticides for controlling infection caused by thrips. Along with these factors, the use of biological solutions for pest controls enhances the crop quality and productivity with minimum environmental hazards and toxicity, thus increasing their preference among the farmers.
Among the types of crops on which bio-insecticides are applied for controlling the infection caused by thrips, the fruits segment dominated the market. It was followed by vegetables and flowers. The commercial value of fruits highly depends on its appearance which is largely damaged by the thrips infection making it less saleable in the market. Thus, bio-insecticides are applied on fruits on a large scale for thrips control. Being environment friendly and less toxic, there is an increasing preference for bio-insecticides by farmers cultivating fruits and vegetables.
Among the formulations of bio-insecticides such as liquid formulations, water-dispensable granules, wettable powder, and pellets, the liquid formulations accounted for the largest share followed by water-dispensable granules and wettable powder. Liquid formulations are cost-effective, eco-friendly, and sustainable. Also, they offer a longer shelf-life with easy handling, transportation, and application. Companies are investing in the technological development of liquid formulation-based bio-insecticides, thus increasing their market share.
Bio-insecticides are made from three major active ingredients which are predators, biorationals, and parasites. The biorationals active ingredients accounted for the highest market share followed by parasites and predators. The demand for biorationals is increasing due to easy availability and increasing effectiveness in making bio-insecticides with active ingredients such as spinosad.
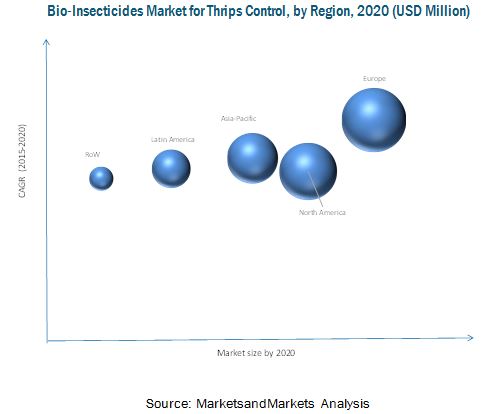
By 2020, Europe is projected to dominate the market for bio-insecticides for thrips control followed by North America and Asia-Pacific. Spain is projected to be the largest country-wise market in Europe by 2020. The growing resistance among pests toward chemicals has reduced the effect of synthetic insecticides in controlling thrips and other pests, accordingly increasing the application of biological solutions for the same in the European region. With the increasing importance of bio-insecticides in thrips control which helps to protect the crop and improve crop yield, bio-insecticides are progressively used as an important biological solution by the farmers to minimize the damage, thus increasing their demand in Europe. The bio-insecticides market for thrips control in the Asia-Pacific region is projected to grow with investments from several multinational manufacturers and promotion of biological solutions for crop protection especially in countries such as China, India, and Japan.
Variable efficiency and lower shelf life of bio-insecticides for thrips control and barriers in the adoption of bio-insecticides due to dominating chemical pesticide industry and stubborn perception of growers are hindering the growth of bio-insecticides for thrips control.
The key players identified in the bio-insecticides market for thrips control include BASF SE (Germany), Bayer CropScience AG (Germany), Canson Biotechnologies Limited (India), The DOW Chemical Company (U.S.), and Marrone Bio Innovations Inc. (U.S.). Most key participants have been exploring new regions through new product launches, collaborations, and various agreements across the globe to avail a competitive advantage through combined synergies. Since 2011, the bio-insecticides market for thrips control has witnessed an increase in demand, especially in developing nations such as India, China, Mexico, and Brazil.
To speak to our analyst for a discussion on the above findings, click Speak to Analyst
Table of Contents
1 Introduction (Page No. - 15)
1.1 Objectives of the Study
1.2 Market Definition
1.3 Study Scope
1.3.1 Years Considered
1.4 Currency
1.5 Limitations
1.6 Stakeholders
2 Research Methodology (Page No. - 18)
2.1 Research Data
2.1.1 Secondary Data
2.1.1.1 Key Data From Secondary Sources
2.1.2 Primary Data
2.1.2.1 Key Data From Primary Sources
2.1.2.2 Key Industry Insights
2.1.2.3 Breakdown of Primary Interviews
2.2 Factor Analysis
2.2.1 Introduction
2.2.2 Demand-Side Analysis
2.2.2.1 Demand for Crop Protection and Developments
2.2.2.2 Population Growth and Demand for Fresh Fruits & Vegetables
2.2.3 Supply-Side Analysis
2.2.3.1 Parent Market Analysis: Biopesticides Market Growth
2.3 Market Size Estimation
2.3.1 Bottom-Up Approach
2.3.2 Top-Down Approach
2.4 Market Breakdown & Data Triangulation
2.5 Research Assumptions & Limitations
2.5.1 Assumptions
2.5.2 Limitations
3 Executive Summary (Page No. - 29)
4 Premium Insights (Page No. - 33)
4.1 Attractive Opportunities in this Market
4.2 Fruits: Leading Segment By Crop
4.3 Bio-Insecticides Market for Thrips Control: Developed vs Developing Nations, 2015 & 2020 (USD Million)
4.4 North America: Largest Bio-Insecticides Market for Thrips Control
4.5 Natural-Extracts: Fastest-Growing Biorationals in Bio-Insecticides Market for Thrips Control
4.6 Liquid Formulation: Dominating Segment in Bio-Insecticides Market for Thrips Control, By Formulation
4.7 Life Cycle Analysis: By Region
5 Market Overview (Page No. - 39)
5.1 Introduction
5.2 Evolution
5.3 Global Market Scenario: Strawberry Crop
5.3.1 Strawberry � Area Harvested
5.3.2 Strawberry � Production
5.4 Methods & List of Products to Control Thrips in Strawberry Crop
5.4.1 Chemical Method
5.4.2 Biological Method
5.4.3 Other Control Measures
5.4.4 List of Products to Control Thrips in Strawberry Crop
5.5 Market Segmentation
5.5.1 By Crop
5.5.2 By Formulation
5.5.3 By Active Ingredient
5.5.4 By Region
5.6 Market Dynamics
5.6.1 Drivers
5.6.1.1 Increasing Market for Biological Pest Control
5.6.1.2 Rising World Population
5.6.1.3 Increasing Awareness Towards Impact of Chemicals Used for Pest Control
5.6.1.4 Promising Results in Quality and Productivity
5.6.2 Restraints
5.6.2.1 Variable Efficacy and Lower Shelf Life
5.6.2.2 Availability of Bio-Insecticides
5.6.2.3 Barriers in Adoption of Bio-Insecticides
5.6.3 Opportunities
5.6.3.1 Growing Asia-Pacific and Latin American Markets
5.6.3.2 Innovative Products Targeting Specific Pests
5.6.3.3 Growing Resistance to Pesticides
5.6.4 Challenges
5.6.4.1 Requirement of New Skills and Understanding of Insects
5.6.4.2 Highly Fragmented Market
5.6.5 Burning Issues
5.6.5.1 Growth in Adoption of Gm Crops
6 Industry Trends (Page No. - 56)
6.1 Value Chain Analysis
6.2 Supply Chain Analysis
6.2.1 Prominent Companies
6.2.2 Small & Medium Enterprises
6.2.3 End Users (Governments/Farmers/ Researchers)
6.2.4 Key Influencers
6.3 Porter�s Five Forces Analysis
6.3.1 Intensity of Competitive Rivalry
6.3.2 Bargaining Power of Suppliers
6.3.3 Bargaining Power of Buyers
6.3.4 Threat of New Entrants
6.3.5 Threats of Substitutes
7 Parent Market Analysis (Page No. - 63)
7.1 Introduction
7.2 Evolution of Bio-Pesticides
7.3 Market Segmentation
7.3.1 By Type
7.3.2 By Mode of Application
7.3.3 By Crop Type
7.3.4 By Formulation
7.3.5 By Origin
7.3.6 By Region
7.4 Biopesticides Market, By Type
7.4.1 Bioinsecticides
7.4.2 Biofungicides
7.4.3 Bioherbicides
7.4.4 Bionematicides
7.5 Bio-Pesticides Market, By Mode of Application
7.5.1 Seed Treatment
7.5.2 Soil Treatment
7.5.3 Foliar Spray
7.5.4 Post Harvest
7.6 Biopesticides Market, By Origin
7.6.1 Microbial Pesticides
7.6.2 Biochemical Pesticides
7.6.3 Beneficial Insects
7.7 Biopesticides Market, By Crop Type
7.7.1 Grains & Oilseeds
7.7.2 Fruits & Vegetables
7.7.3 Others
8 Bio-Insecticides Market for Thrips Control, By Crop (Page No. - 87)
8.1 Introduction
8.2 Fruits
8.3 Vegetables
8.4 Flowers
8.5 Other Crops
9 Bio-Insecticides Market for Thrips Control, By Formulation (Page No. - 94)
9.1 Introduction
9.2 Liquid Formulation
9.3 Water-Dispersible Granules
9.4 Wettable Powder
9.5 Pellets
10 Bio-Insecticides Market for Thrips Control, By Active Ingredient (Page No. - 99)
10.1 Introduction
10.2 Predators
10.3 Parasites
10.4 Biorationals
11 Bio-Insecticides Market for Thrips Control, By Region (Page No. - 110)
11.1 Introduction
11.2 North America
11.3 Europe
11.4 Asia-Pacific
11.5 Latin America
11.6 Rest of the World (RoW)
12 Competitive Landscape (Page No. - 123)
12.1 Overview
12.2 Bio-Insecticides Market for Thrips Control: List of Companies
12.3 New Product Launches: Company Strategy
12.4 Competitive Situation & Trends
12.4.1 Agreements
12.4.2 Expansions
12.4.3 Acquisitions
12.4.4 New Product Launches
12.4.5 Collaborations, Investments & Joint Ventures
13 Company Profiles (Page No. - 135)
13.1 Introduction
(Business Overview, Products & Services, Key Insights, Recent Developments, SWOT Analysis, Ratio Analysis, MnM View)*
13.2 BASF SE
13.3 Bayer Cropscience AG
13.4 Camson Bio Technologies Limited
13.5 The DOW Chemical Company
13.6 Marrone Bio Innovations Inc.
13.7 Valent Biosciences Corporation
13.8 Certis Usa L.L.C.
13.9 Koppert B.V.
13.10 W. Neudorff GmbH Kg
13.11 Bioworks, Inc.
13.12 The Gowan Company Inc.
*Details on Business Overview, Products & Services, Key Insights, Recent Developments, SWOT Analysis, MnM View Might Not Be Captured in Case of Unlisted Companies.
14 Appendix (Page No. - 166)
14.1 Insights of Industry Experts
14.2 Discussion Guide
14.3 Knowledge Store: Marketsandmarkets� Subscription Portal
14.4 Introducing RT: Real-Time Market Intelligence
14.5 Available Customizations
14.6 Related Reports
List of Tables (60 Tables)
Table 1 Global Population & Per Capita Land Available
Table 2 Impact of Key Drivers on the Bio-Insecticides for Thrips Control Market
Table 3 Impact of Key Restraints on the Bio-Insecticides for Thrips Control Market
Table 4 Opportunities for Bio-Insecticides Market for Thrips Control
Table 5 Challenges to the Bio-Insecticides Market for Thrips Control
Table 6 Biopesticides Market Size, By Type, 2013-2020 (USD Million)
Table 7 Bioinsecticides Market Size, By Region, 2013-2020 (USD Million)
Table 8 Biofungicides Market Size, By Region, 2013-2020 (USD Million)
Table 9 Bioherbicides Market Size, By Region, 2013-2020 (USD Million)
Table 10 Bionematicides Market Size, By Region, 2013-2020 (USD Million)
Table 11 Biopesticides Market, By Mode of Application, 2013-2020 (USD Million)
Table 12 Biopesticides in Seed Treatment Market, By Region, 2013-2020 (USD Million)
Table 13 Biopesticides in Soil Treatment Market, By Region, 2013-2020 (USD Million)
Table 14 Biopesticides in Foliar Spray Market, By Region, 2013-2020 (USD Million)
Table 15 Biopesticides in Post Harvest Market, By Region, 2013-2020 (USD Million)
Table 16 Pesticides Market, By Origin, 2013-2020 (USD Million)
Table 17 Microbial Pesticides Market, By Region, 2013-2020 (USD Million)
Table 18 Biochemical Pesticides Market, By Region, 2013-2020 (USD Million)
Table 19 Beneficial Insect Pesticides Market, By Region, 2013-2020 (USD Million)
Table 20 Biopesticides Market Size, By Crop Type, 2013-2020 (USD Million)
Table 21 Biopesticides in Grains & Oilseeds Market Size, By Region, 2013-2020 (USD Million)
Table 22 Biopesticides in Fruits & Vegetables Market Size, By Region, 2013-2020 (USD Million)
Table 23 Biopesticides in Others Market Size, By Region, 2013-2020 (USD Million)
Table 24 List of Thrips & Their Common Host Plants
Table 25 Bio-Insecticides Market for Thrips Control, By Crop, 2013�2020 (USD Million)
Table 26 Strawberry Production Data of Top Five Countries, 2013 (Metric Tons)
Table 27 Bio-Insecticides Market for Thrips Control in Fruits, 2013�2020 (USD Million)
Table 28 Tomato Production Data of Top Five Countries, 2013 (Metric Tons)
Table 29 Bio-Insecticides Market for Thrips Control in Vegetables, 2013�2020 (USD Million)
Table 30 List of Some Thrips Control Products, Their Formulations, and Companies
Table 31 Bio-Insecticides Market Size for Thrips Control, By Formulation, 2013�2020 (USD Million)
Table 32 List of Active Ingredients & Their Uses
Table 33 List of Some Thrips Control Products, Their Active Ingredients, and Companies
Table 34 Bio-Insecticides Market for Thrips Control, By Active Ingredient, 2013�2020 (USD Million)
Table 35 Bio-Insecticides Market for Thrips Control, By Predator, 2013�2020 (USD Million)
Table 36 Predators: Bio-Insecticides Market Size for Thrips Control, By Region, 2013-2020 (USD Million)
Table 37 Bio-Insecticides Market for Thrips Control, By Parasite, 2013�2020 (USD Million)
Table 38 Parasites: Bio-Insecticides Market Size for Thrips Control, By Region, 2013-2020 (USD Million)
Table 39 Bio-Insecticides Market for Thrips Control, By Biorational, 2013�2020 (USD Million)
Table 40 Biorationals: Bio-Insecticides Market Size for Thrips Control, By Region, 2013-2020 (USD Million)
Table 41 Bio-Insecticides Market Size for Thrips Control, By Region, 2013�2020 (USD Million)
Table 42 List of Bio-Insecticides Commercially Available in the U.S.
Table 43 North America: Bio-Insecticides Market Size for Thrips Control, By Country, 2013�2020 (USD Million)
Table 44 North America: Market Size for Thrips Control, By Active Ingredient, 2013-2020 (USD Million)
Table 45 List of Bio-Insecticides Commercially Available in Europe
Table 46 Europe: Bio-Insecticides Market Size for Thrips Control, By Country, 2013�2020 (USD Million)
Table 47 Europe: Market Size for Thrips Control, By Active Ingredient, 2013�2020 (USD Million)
Table 48 Asia-Pacific: Bio-Insecticides Market Size for Thrips Control, By Country, 2013�2020 (USD Million)
Table 49 Asia-Pacific: Market Size for Thrips Control, By Active Ingredient, 2013�2020 (USD Million)
Table 50 Latin America: Bio-Insecticides Market Size for Thrips Control, By Country, 2013�2020 (USD Million)
Table 51 Latin America: Market Size for Thrips Control, By Active Ingredient, 2013�2020 (USD Million)
Table 52 RoW: Bio-Insecticides Market Size for Thrips Control, By Country, 2013�2020 (USD Million)
Table 53 RoW: Market Size for Thrips Control, By Active Ingredient, 2013�2020 (USD Million)
Table 54 Companies Manufacturing Bio-Insecticides
Table 55 New Products Launched
Table 56 Agreements , 2010�2015
Table 57 Expansions, 2010�2015
Table 58 Acquisitions, 2010�2015
Table 59 New Product Launches, 2010�2015
Table 60 Collaborations, Investments & Joint Ventures, 2010�2015
List of Figures (80 Figures)
Figure 1 Bio-Insecticides Market Segmentation for Thrips Control
Figure 2 Research Design
Figure 3 Losses Along the Food Chain
Figure 4 Population Growth Trend, 1950�2050 (Billion)
Figure 5 Consumption of Store-Bought Fresh Fruits and Vegetables, 2004�2014
Figure 6 Arriving at Market Size Estimation Methodology: Bottom-Up Approach
Figure 7 Market Size Estimation Methodology: Top-Down Approach
Figure 8 Data Triangulation
Figure 9 Bio-Insecticides Market for Thrips Control, By Crop, 2015 vs 2020 (USD Million)
Figure 10 Bio-Insecticides Market Size for Thrips Control, By Region, 2015�2020 (USD Million)
Figure 11 Bio-Insecticides Market Size for Thrips Control, By Formulation, 2015 vs 2020 (USD Million)
Figure 12 Bio-Insecticides Market Size for Thrips Control, By Active Ingredient, 2015 vs 2020 (USD Million)
Figure 13 Bio-Insecticides Market Share (Value) for Thrips Control, By Region, 2014 (%)
Figure 14 Trend in Bio-Insecticides Market for Thrips Control, 2015-2020 (USD Million)
Figure 15 Fruits Projected to Be the Largest Segment
Figure 16 U.S.: Largest Market for the Next Five Years
Figure 17 Biorationals Segment Accounted for Largest Share in The North American Bio-Insecticides Market for Thrips Control, 2014
Figure 18 Natural-Extracts Segment Dominated Biorationals Bio-Insecticides Market for Thrips Control, 2014
Figure 19 Liquid Formulation Segment to Account for Largest Share in this Market
Figure 20 Europe Fastest Growing Region in Bio-Insecticides Market for Thrips Control During the Forecast Period
Figure 21 Evolution of Bio-Insecticides
Figure 22 Area Under Strawberry Harvest, By Region, 2013 (% Share)
Figure 23 Area Under Strawberry Harvest � Top 10 Countries in 2013 (�000 Hectare)
Figure 24 Strawberry Productivity, Top 10 Countries, 2013 (Tons/Hectare)
Figure 25 Strawberry Production, By Region, 2013 (%Share)
Figure 26 Top 10 Strawberry Producing Countries, 2013 (Million Tons)
Figure 27 China: Strawberry Harvest Area and Production Trend, 1995-2013 (KT)
Figure 28 Bio-Insecticides Market for Thrips Control, By Crop
Figure 29 Market, By Formulation
Figure 30 Market, By Active Ingredient
Figure 31 Market , By Region
Figure 32 Growth in Demand for Biological Pest Control Solutions and Increasing Awareness About Impact of Chemicals Drives Growth of Bio-Insecticides Market for Thrips Control
Figure 33 Area Under Biotech Crops, By Region (%Share)
Figure 34 Registration & Formulation and Manufacturing Contribute the Most to Overall Value of Bio-Insecticides
Figure 35 Distribution Channel Plays A Vital Role in the Supply Chain for Bio-Insecticides
Figure 36 Porter�s Five Forces Analysis: Bio-Insecticides Market for Thrips Control
Figure 37 Bio-Pesticides Market Evolution and Milestones Chart
Figure 38 Biopesticides Market, By Type, 2015 vs 2020 (USD Million)
Figure 39 Bioinsecticides Market, By Region 2015 vs 2020 (USD Million)
Figure 40 Biofungicides Market, By Region, 2015 vs 2020 (USD Million)
Figure 41 Bioherbicides Market, By Region, 2015 vs 2020 (USD Million)
Figure 42 Bionematicides Market, By Region, 2015 vs 2020 (USD Million)
Figure 43 Biopesticides Market, By Mode of Application, 2015 vs 2020 (USD Million)
Figure 44 Biopesticides in Seed Treatment Market, By Region, 2015 vs 2020 (USD Million)
Figure 45 Biopesticides in Soil Treatment Market, By Region, 2015 vs 2020 (USD Million)
Figure 46 Biopesticides in Foliar Spray Market, By Region, 2015 vs 2020 (USD Million)
Figure 47 Biopesticides in Post Harvest Market, By Region, 2015 vs 2020 (USD Million)
Figure 48 Pesticides Market, By Origin, 2015 vs 2020 (USD Million)
Figure 49 Microbial Pesticides Market, By Region, 2015 vs 2020 (USD Million)
Figure 50 Biochemical Pesticides Market, By Region, 2015 vs 2020 (USD Million)
Figure 51 Beneficial Insect Pesticides Market, By Region, 2015 vs 2020 (USD Million)
Figure 52 Biopesticides Market, By Crop Type, 2015 vs 2020 (USD Million)
Figure 53 Biopesticides in Grains & Oilseeds Market, By Region, 2015 vs 2020 (USD Million)
Figure 54 Biopesticides in Fruits & Vegetables Market, By Region, 2015 vs 2020 (USD Million)
Figure 55 Biopesticides in Others Market, By Region, 2015 vs 2020 (USD Million)
Figure 56 Bio-Insecticides Market for Thrips Control, By Crop, 2015 vs 2020 (USD Million)
Figure 57 Bio-Insecticides Market for Thrips Control in Fruits, 2015 vs 2020 (USD Million)
Figure 58 Bio-Insecticides Market for Thrips Control in Vegetables, 2015 vs 2020 (USD Million)
Figure 59 Bio-Insecticides Market for Thrips Control, By Formulation, 2015 vs 2020 (USD Million)
Figure 60 Bio-Insecticides Market for Thrips Control, By Active Ingredient, 2015 vs 2020 (USD Million)
Figure 61 Bio-Insecticides Market for Thrips Control, By Predator, 2015 vs 2020 (USD Million)
Figure 62 Bio-Insecticides Market for Thrips Control, By Parasite, 2015 vs 2020 (USD Million)
Figure 63 Bio-Insecticides Market for Thrips Control, By Biorational, 2015 vs 2020 (USD Million)
Figure 64 Geographic Snapshot: Rapidly Growing Markets are Emerging as New Hot Spots, 2015�2020 (%)
Figure 65 Snapshot : North American Bio-Insecticides Market for Thrips Control
Figure 66 Snapshot : European Bio-Insecticides Market for Thrips Control
Figure 67 Agreements: Most Preferred Approach of Key Companies
Figure 68 Expanding Revenue Base Through Business Agreements 2014�2015
Figure 69 Agreements: the Key Strategy, 2010�2015 (%)
Figure 70 Geographical Revenue Mix of Top Five Market Players
Figure 71 BASF SE: Company Snapshot
Figure 72 BASF SE: SWOT Analysis
Figure 73 Bayer Cropscience AG: Company Snapshot
Figure 74 Bayer Cropscience AG: SWOT Analysis
Figure 75 Camson Bio Technologies Limited: Company Snapshot
Figure 76 Camson Bio Technologies Limited: SWOT Analysis
Figure 77 The DOW Chemical Company: Company Snapshot
Figure 78 The DOW Chemical Company: SWOT Analysis
Figure 79 Marrone Bio Innovations Inc.: Company Snapshot
Figure 80 Marrone Bio Innovations Inc.: SWOT Analysis


Growth opportunities and latent adjacency in Bio-Insecticides Market