This research study involved the extensive use of secondary sources, directories, and databases, such as Dun & Bradstreet (D&B) Hoovers and Bloomberg BusinessWeek, to identify and collect information useful for a technical, market-oriented, and commercial study of the wireless broadband in public safety market. The primary sources have been mainly industry experts from the core and related industries and preferred suppliers, manufacturers, distributors, service providers, technology developers, alliances, and organizations related to all segments of the value chain of this market. In-depth interviews have been conducted with various primary respondents, including key industry participants, subject matter experts, C-level executives of key market players, and industry consultants to obtain and verify critical qualitative and quantitative information.
Secondary Research
The market for companies offering wireless broadband in public safety solutions and services to different verticals has been estimated and projected based on the secondary data made available through paid and unpaid sources, as well as by analyzing their product portfolios in the ecosystem of the wireless broadband in public safety market. It also involved rating company products based on their performance and quality. In the secondary research process, various sources such as Wireless Global Congress 2023, The Public Safety Innovation Summit 2023, 6th IEEE 5G Workshop on First Responder and Tactical Networks 2023 have been referred to for identifying and collecting information for this study on the market. The secondary sources included annual reports, press releases investor presentations of companies, white papers, journals, and certified publications and articles by recognized authors, directories, and databases. Secondary research has been mainly used to obtain key information about the supply chain of the market, the total pool of key players, market classification, segmentation according to industry trends to the bottommost level, regional markets, and key developments from both market- and technology-oriented perspectives that have been further validated by primary sources.
Primary Research
In the primary research process, various primary sources from both the supply and demand sides were interviewed to obtain qualitative and quantitative information on the market. The primary sources from the supply side included various industry experts, including Chief Experience Officers (CXOs); Vice Presidents (VPs); directors from business development, marketing, and product development/innovation teams; related key executives from wireless broadband in public safety solution vendors, SIs, professional service providers, and industry associations; and key opinion leaders. Primary interviews were conducted to gather insights, such as market statistics, revenue data collected from solutions and services, market breakups, market size estimations, market forecasts, and data triangulation. Primary research also helped understand various trends related to technologies, applications, deployments, and regions. Stakeholders from the demand side, such as Chief Information Officers (CIOs), Chief Technology Officers (CTOs), Chief Strategy Officers (CSOs), and end users using wireless broadband in public safety solutions, were interviewed to understand the buyer’s perspective on suppliers, products, service providers, and their current usage of wireless broadband in public safety solutions which would impact the overall wireless broadband in public safety market.

To know about the assumptions considered for the study, download the pdf brochure
Market Size Estimation
Multiple approaches were adopted to estimate and forecast the size of the wireless broadband in public safety market. The first approach involves estimating market size by summing up the revenue generated by companies through the sale of wireless broadband in public safety offerings.
Both top-down and bottom-up approaches were used to estimate and validate the total size of the market. These methods were extensively used to estimate the size of various segments in the market. The research methodology used to estimate the market size includes the following:
-
Key players in the market have been identified through extensive secondary research.
-
In terms of value, the industry’s supply chain and market size have been determined through primary and secondary research processes.
-
All percentage shares, splits, and breakups have been determined using secondary sources and verified through primary sources.
Wireless broadband in public safety Market Size: Bottom-Up Approach

To know about the assumptions considered for the study, Request for Free Sample Report
Wireless broadband in public safety Market Size: Top-Down Approach

Data Triangulation
After arriving at the overall market size, the wireless broadband in public safety market was divided into several segments and subsegments. A data triangulation procedure was used to complete the overall market engineering process and arrive at the exact statistics for all segments and subsegments, wherever applicable. The data was triangulated by studying various factors and trends from the demand and supply sides. Along with data triangulation and market breakdown, the market size was validated by the top-down and bottom-up approaches.
Market Definition
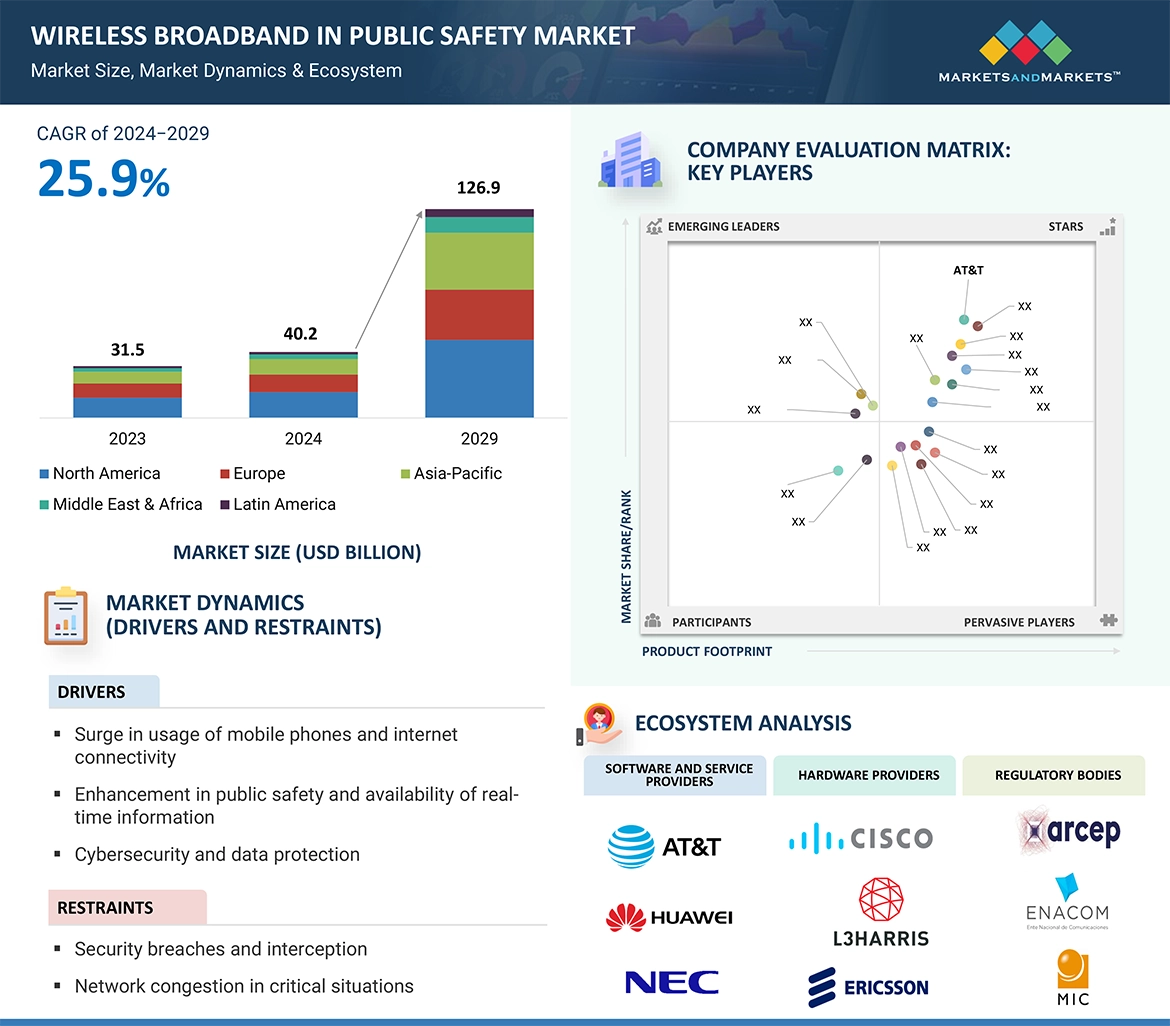
Wireless broadband public safety network delivers seamless communications between public safety agencies, local and state governments, federal agencies, and private companies that respond to incidents and disasters. This network meets the public safety grade operational requirements for reliable and secure communication. It is a platform comprising a wide range of equipment and applications that are technologically advanced. Due to the high-speed transmission of data, voice, and video over the Internet and other networks, wireless broadband is increasingly being used by the public to use new services and applications on devices such as laptops, smartphones, and digital tablets. Therefore, its applications can potentially increase emergency preparedness and response capabilities to meet the needs of emergency responders.
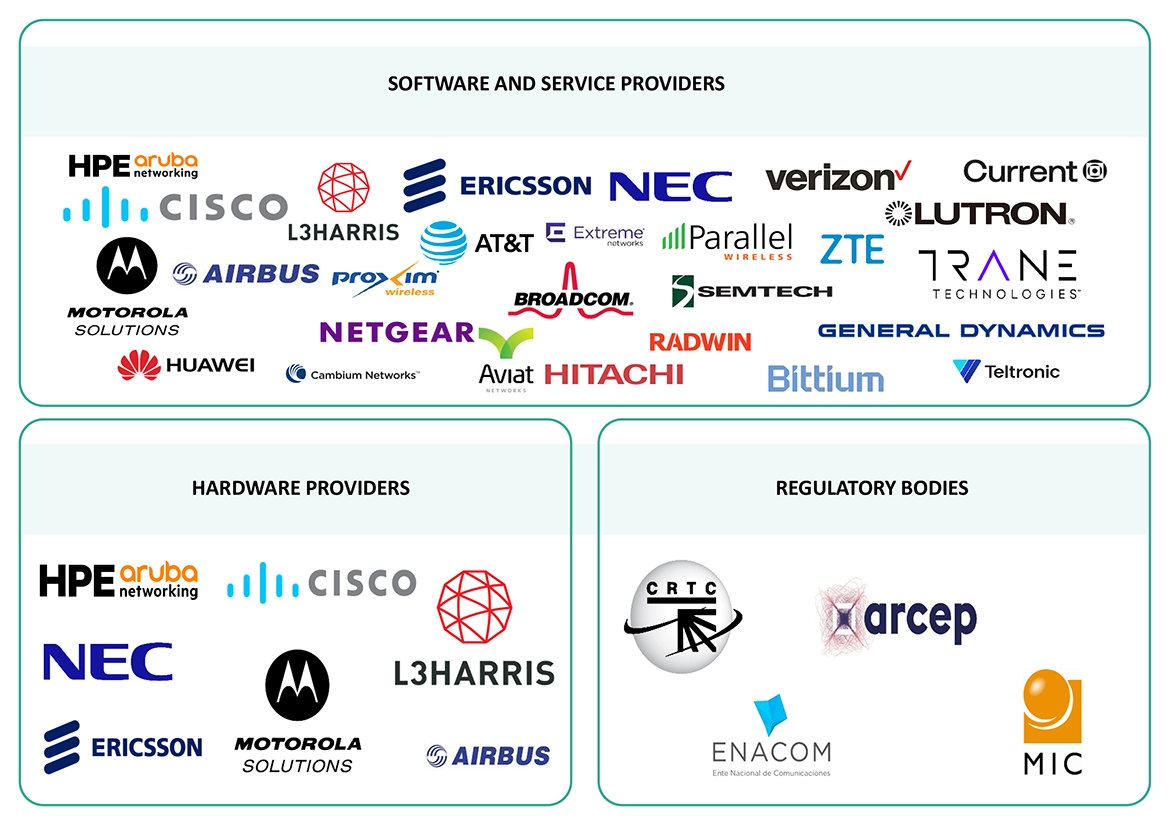
Key Stakeholders
-
Government Bodies and Public Safety Agencies
-
IT and Telecommunication Companies
-
Network Infrastructure Developers
-
Mobile Network Operators
-
Software and Hardware Manufacturers
-
Communication and Computing Device Manufacturers
-
Emergency Public Safety Service Providers
-
Chief Information/Technology Officers
-
State Broadband Task Force
-
Commercial Broadband Vendors
-
Urban Area Security Imitative (UASI) Representative
-
Regional Interoperability Committees
-
Statewide Interoperability Governing Body (SIGB)
-
Federal Agencies, especially Federal Emergency Responders
Report Objectives
-
To determine, segment, and forecast the wireless broadband in public safety market on the basis of offering, technology, end user, application, and region in terms of value
-
To forecast the size of the market segments with respect to 5 main regions: North America, Europe, Asia Pacific, Middle East & Africa, and Latin America
-
To provide detailed information about the major factors (drivers, restraints, opportunities, and challenges) influencing the growth of the market
-
To study the complete value chain and related industry segments and perform a value chain analysis of the market landscape
-
To strategically analyze the macro and micromarkets1 with respect to individual growth trends, prospects, and contributions to the total market
-
To analyze the industry trends, pricing data, patents, and innovations related to the market
-
To analyze the opportunities for stakeholders by identifying the high-growth segments of the market
-
To profile the key players in the market and comprehensively analyze their market share/ranking and core competencies2
-
To track and analyze competitive developments, such as mergers & acquisitions, product launches & developments, partnerships, agreements, collaborations, business expansions, and R&D activities.
Available Customizations
With the given market data, MarketsandMarkets offers customizations as per the company’s specific needs. The following customization options are available for the report:
Country-wise information
-
Analysis for additional countries (up to five)
Company Information
-
Detailed analysis and profiling of additional market players (up to 5)
Geographic Analysis
-
Further breakup of the Asia Pacific market into countries contributing 75% to the regional market size
-
Further breakup of the North American market into countries contributing 75% to the regional market size
-
Further breakup of the Latin American market into countries contributing 75% to the regional market size
-
Further breakup of the Middle East & Africa market into countries contributing 75% to the regional market size
-
Further breakup of the European market into countries contributing 75% to the regional market size


Growth opportunities and latent adjacency in Wireless Broadband in Public Safety Market