Clinical Risk Grouping Solutions Market by Product (Scorecard & Visualization Tools, Dashboard Analytics, Risk Reporting), Deployment (Private Cloud, Public Cloud, Hybrid Cloud), End-User and Region - Global Forecast to 2024


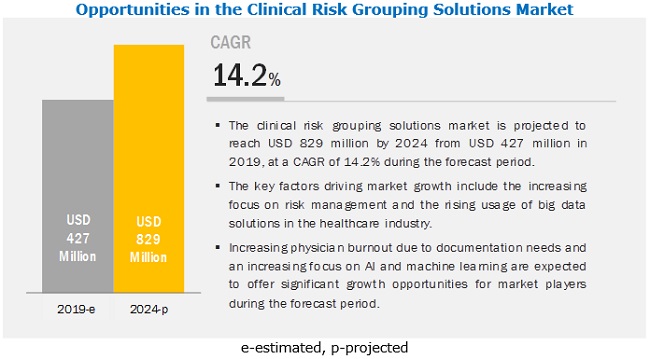
The global Clinical Risk Grouping Solutions Market is projected to reach USD USD 829 million by 2024, growing at a CAGR of 14.2%. Rising consumer awareness regarding risk management and implementation of big data solutions are driving the market for clinical risk grouping software. Mounting paperwork resulting in physician burnout and the increasing focus on AI & machine learning also present significant growth opportunities for market players.
The scorecard & visualization tools segment is expected to dominate the clinical risk grouping solutions market in 2019
Scorecard & visualization tools, dashboard analytics, and risk reporting are the three product types of clinical risk grouping solutions. Scorecard & visualization tools segment dominated the market with the largest share due to its ability to predict payment processes accurately and project per-patient risk. The rising need to reduce healthcare costs through these two channels is expected to augment the growth of the segment during the forecast period.
Hospitals are expected to be the largest end-user of market in 2019
Hospitals, payers, ambulatory care centers, and long-term care centers, among others are the end-users of clinical risk grouping solutions, of which hospitals accounted for the largest market share in 2018. Increasing adoption of big data solutions in healthcare facilities (such as hospitals and clinics), growing focus of caregivers on risk management, and the rising adoption of AI and machine learning in the healthcare industry are driving the growth of this segment.
Deployment via private cloud is estimated to account for the largest market share in 2019; however, the public cloud segment is expected to be the fastest-growing segment
Private cloud accounted for the largest share of the clinical risk grouping software market in 2018 as it offers the highest level of security for sensitive data making it a viable option for the highly sensitive clinical risk grouping data. This data has to be stored in a secure way to avoid any breach of data privacy, which can lead to legal ramifications. However, the public cloud segment is estimated to be the fastest-growing segment with the highest CAGR. Low cost of public cloud systems as compared to other deployment models and a high number of public cloud providers are driving growth in this segment.
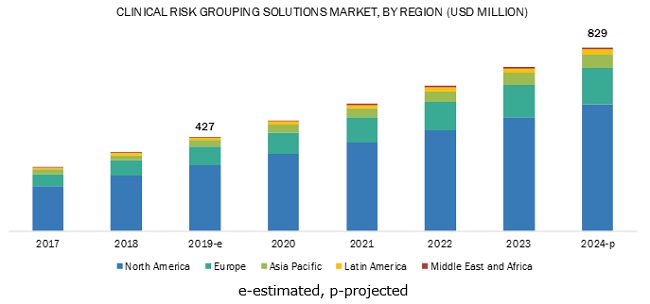
North America is expected to hold the largest market share in 2019
The clinical risk grouping software market in North America is driven by the growing focus on quality care, increasing focus on population health management, and cost containment in the healthcare industry. Also, a highly suitable healthcare IT infrastructure and rising adoption of clinical risk grouping solutions by healthcare payers in the region are supporting the growth of clinical risk grouping solutions in this region.
Clinical Risk Grouping Solutions Market Key Players
3M Corporation (US) and Optum, Inc. (US) dominated the global clinical risk grouping solutions market in 2018. The prominent players in the global market are Cerner Corporation (US), Conduent Inc. (US), Nuance Communications (US), Health Catalyst (US), HBI Solutions (US), Johns Hopkins University (US), Lightbeam Health Solutions (US), Dynamic Healthcare Systems (US), 4S Information Systems (US), Evolent Health (US), and PeraHealth (US).
3M Corporation (US) is a major player in the market with a wide range of product offerings across different industries. The company has over 30 years of experience in developing solutions for classification, grouping, and reimbursement calculation systems for inpatient, outpatient, and professional settings. This platform of innovative services along with a broad product portfolio for clinical risk grouping makes it a leading market player in the market. 3M relies on product innovation internally. For instance, the company’s R&D expenditure in 2018 was USD 1.82 billion, which accounts for 6% of its total revenue. In the adoption of business strategies, in October 2016, 3M entered into a partnership with Verily Life Sciences (US) (formerly known as Google Life Sciences) to develop a new population health measurement technology for the management of clinical and financial performance. Such developments show that the company is focused highly on research activities for the development of innovative new products.
Scope of the Report:
|
Report Metric |
Details |
|
Market Size Available for Years |
2017–2024 |
|
Base Year Considered |
2018 |
|
Forecast Period |
2019–2024 |
|
Forecast Unit |
Value (USD Million) |
|
Segments Covered |
Product, Deployment Model, End-User |
|
Geographies Covered |
|
|
Companies Covered |
3M Corporation (US), Optum Inc. (US), Cerner Corporation (US), Conduent Inc. (US), Nuance Communications (US), Health Catalyst (US), HBI Solutions (US), Johns Hopkins University (US), Lightbeam Health Solutions (US), Dynamic Healthcare Systems (US), 4S Information Systems (US), Evolent Health (US) and Pera Health (US). |
The research report categorizes the market into the following segments and subsegments:
By Product
- Scorecard & Visualization Tools
- Dashboard Analytics
- Risk Reporting
By Deployment Model
- Private Cloud
- Public Cloud
- Hybrid Cloud
By End User
- Hospitals
- Payers
- Ambulatory Care Centers
- Long- Term Care Centers
By Region
- North America
- Europe
- Asia Pacific
- Latin America
- Middle East & Africa
Recent Developments
- In June 2019, Optum, Inc. (US) acquired the DaVita Medical Group from DaVita Inc. (US). This will result in increased patient management programs, especially in the kidney care space.
- In May 2019, HBI Solutions (US) signed a partnership with Iatric Systems, Inc. (US) under which, HBI Solutions (US) will use Iatric’s AI systems for generating predictive risk scores of patients for healthcare providers.
- In April 2019, Health Catalyst (US) signed a partnership with Fullerton Healthcare Corporation (Singapore), which will combine Health Catalyst's analytical services with Fullerton's services in the Asia Pacific market.
- In March 2019, Evolent Health (US) and GlobalHealth (US) formed True Health as a joint venture between the two companies. True Health will focus on developing solutions for healthcare providers and payers.
Key Questions Addressed in the Report
- Who are the top 10 players operating in the market?
- What are the drivers, restraints, opportunities, and challenges in the market?
- What are the industry trends as well as the current scenario in the market?
- What are the growth trends in the market at the segmental and overall market levels?
- How is the market performing in different regions across the globe?
To speak to our analyst for a discussion on the above findings, click Speak to Analyst
 Exclusive indicates content/data unique to MarketsandMarkets and not available with any competitors.
Table of Contents
1 Introduction (Page No. - 15)
1.1 Objectives of the Study
1.2 Market Definition
1.3 Market Scope
1.3.1 Markets Covered
1.3.2 Years Considered for the Study
1.4 Currency
1.5 Stakeholders
1.6 Limitations
2 Research Methodology (Page No. - 18)
2.1 Research Approach
2.1.1 Secondary Research
2.1.1.1 Key Data From Secondary Sources
2.1.2 Primary Research
2.1.2.1 Key Data From Primary Sources
2.1.2.2 Breakdown of Primaries
2.1.2.3 Key Industry Insights
2.2 Market Size Estimation
2.3 Data Triangulation Approach
2.4 Market Share Estimation
2.5 Assumptions for the Study
3 Executive Summary (Page No. - 25)
4 Premium Insights (Page No. - 28)
4.1 Clinical Risk Grouping Solutions: Market Overview
4.2 Clinical Risk Grouping Solutions Market: Geographic Growth Opportunities
4.3 Regional Mix: Clinical Risk Grouping Solutions Market (2019–2024)
4.4 Clinical Risk Grouping Solutions Market: Developed vs Developing Markets
5 Market Overview (Page No. - 31)
5.1 Introduction
5.2 Market Dynamics
5.2.1 Market Drivers
5.2.1.1 Advantages of Risk Management Solutions
5.2.1.2 Rising Usage of Big Data Solutions
5.2.2 Restraints
5.2.2.1 Lack of Infrastructure
5.2.3 Opportunities
5.2.3.1 Increasing Physician Burnout Due to Documentation Needs
5.2.3.2 Increasing Focus on AI and Machine Learning
5.2.4 Challenges
5.2.4.1 Scarcity of Skilled Healthcare IT Professionals
5.2.4.2 Patient Data Privacy Concerns
5.2.5 Burning Issues
5.2.5.1 Implementation of Solutions Reduces Administrative Expenses But Increases the Burden on Patients
6 Clinical Risk Grouping Solutions Market, By Product (Page No. - 36)
6.1 Introduction
6.2 Scorecards & Visualization Tools
6.2.1 Need to Increase Patient Accuracy and Forecast Risks are Driving the Demand for Scorecards & Visualization Tools
6.3 Dashboard Analytics Solutions
6.3.1 Dashboard Analytics Solutions Segment to Register the Highest Growth During the Forecast Period
6.4 Risk Reporting Solutions
6.4.1 Increasing Adoption of Risk Reporting Solutions By Healthcare Providers to Fuel Market Growth
7 Clinical Risk Grouping Solutions Market, By Deployment Mode (Page No. - 43)
7.1 Introduction
7.2 Private Cloud
7.2.1 High Data Security of Private Cloud Models is Driving Market Growth
7.3 Public Cloud
7.3.1 Price-Effectiveness of Public Over Private Clouds has Driven End-User Preference
7.4 Hybrid Cloud
7.4.1 Hybrid Cloud Architecture Provides Flexibility and the Ability to Avoid Vendor Lock-In
8 Clinical Risk Grouping Solutions Market, By End User (Page No. - 48)
8.1 Introduction
8.2 Hospitals
8.2.1 Hospitals are the Largest End Users of the Clinical Risk Grouping Solutions Market
8.3 Payers
8.3.1 Payers Can Identify Patterns in Claims and Intervene in Fraudulent Claims—A Major Factor Supporting the Adoption of Clinical Risk Grouping Solutions
8.4 Ambulatory Care Centers
8.4.1 Implementation of Mandates to Comply With Quality Measures to Support the Adoption of Clinical Risk Grouping Solutions in Ambulatory Care Centers
8.5 Long-Term Care Centers
8.5.1 Growing Number of Long-Term Care Centers to Drive Market Growth
8.6 Other End Users
9 Clinical Risk Grouping Solutions Market, By Region (Page No. - 58)
9.1 Introduction
9.2 North America
9.2.1 US
9.2.1.1 The US Dominates the North American Clinical Risk Grouping Solutions Market
9.2.2 Canada
9.2.2.1 Increasing Government Focus on Population Health Management Initiatives Will Propel Market Growth in Canada
9.3 Europe
9.3.1 Germany
9.3.1.1 Infrastructural Development and Focus on Risk Management have Driven Market Growth in Germany
9.3.2 UK
9.3.2.1 Favorable Regulatory Outlook has Pushed the Adoption of Hcit Solutions in the UK
9.3.3 France
9.3.3.1 Initiatives Taken By the French Government to Promote the Use of Healthcare IT Solutions Will Drive Market Growth
9.3.4 Rest of Europe (RoE)
9.4 Asia Pacific
9.4.1 Asia is Expected to Witness High Growth in Population and Demand for Healthcare Services
9.5 Latin America
9.5.1 Countries Such as Brazil and Mexico are Exploring New Methods to Manage Clinical Information
9.6 Middle East & Africa
9.6.1 Middle Eastern Countries are Investing Significantly in Hcit Infrastructural Development
10 Competitive Landscape (Page No. - 83)
10.1 Introduction
10.2 Competitive Leadership Mapping
10.2.1 Visionary Leaders
10.2.2 Innovators
10.2.3 Dynamic Differentiators
10.2.4 Emerging Companies
10.3 Company Analysis, By Product and End User
10.4 Competitive Situations and Trends
11 Company Profiles (Page No. - 89)
(Business Overview, Products Offered, Recent Developments, SWOT Analysis, MnM View)*
11.1 3M Company
11.2 Optum Inc. (A Subsidiary of Unitedhealth Group Inc.)
11.3 Cerner Corporation
11.4 Nuance Communications
11.5 Conduent Incorporated
11.6 HBI Solutions, Inc.
11.7 4S Information Systems Ltd.
11.8 Johns Hopkins University
11.9 Lightbeam Health Solutions, LLC
11.10 Dynamic Healthcare Systems, Inc.
11.11 Perahealth, Inc.
11.12 Health Catalyst Inc.
11.13 Evolent Health
*Business Overview, Products Offered, Recent Developments, SWOT Analysis, MnM View Might Not Be Captured in Case of Unlisted Companies.
12 Appendix (Page No. - 118)
12.1 Market Sizing & Validation Approach
12.2 Discussion Guide
12.3 Knowledge Store: Marketsandmarkets’ Subscription Portal
12.4 Available Customizations
12.5 Related Reports
12.6 Author Details
List of Tables (66 Tables)
Table 1 Exchange Rates Utilized for Conversion to USD
Table 2 Clinical Risk Grouping Solutions Market, By Product, 2017–2024 (USD Million)
Table 3 Scorecards & Visualization Tools: Key Brands
Table 4 Scorecards & Visualization Tools Market, By Country, 2017–2024 (USD Million)
Table 5 Dashboard Analytics Solutions: Key Brands
Table 6 Dashboard Analytics Solutions Market, By Country, 2017–2024 (USD Million)
Table 7 Risk Reporting Solutions: Key Brands
Table 8 Risk Reporting Solutions Market, By Country, 2017–2024 (USD Million)
Table 9 Clinical Risk Grouping Solutions Market, By Deployment Mode, 2017–2024 (USD Million)
Table 10 Private Cloud-Deployed Clinical Risk Grouping Solutions Market, By Country, 2017–2024 (USD Million)
Table 11 Public Cloud-Deployed Clinical Risk Grouping Solutions Market, By Country, 2017–2024 (USD Million)
Table 12 Hybrid Cloud-Deployed Clinical Risk Grouping Solutions Market, By Country, 2017–2024 (USD Million)
Table 13 Clinical Risk Grouping Software Market, By End User, 2017–2024 (USD Million)
Table 14 Clinical Risk Grouping Solutions for Hospitals
Table 15 Clinical Risk Grouping Solutions Market for Hospitals, By Country, 2017–2024 (USD Million)
Table 16 Clinical Risk Grouping Solutions for Payers
Table 17 Clinical Risk Grouping Software Market for Payers, By Country, 2017–2024 (USD Million)
Table 18 Clinical Risk Grouping Solutions for Ambulatory Care Centers
Table 19 Clinical Risk Grouping Solutions Market for Ambulatory Care Centers, By Country, 2017–2024 (USD Million)
Table 20 Clinical Risk Grouping Solutions for Long-Term Care Centers
Table 21 Clinical Risk Grouping Software Market for Long-Term Care Centers, By Country, 2017–2024 (USD Million)
Table 22 Clinical Risk Grouping Solutions Market for Other End Users, By Country, 2017–2024 (USD Million)
Table 23 Clinical Risk Grouping Solutions Market, By Region, 2017–2024 (USD Million)
Table 24 North America: Clinical Risk Grouping Solutions Market, By Country, 2017–2024 (USD Million)
Table 25 North America: Clinical Risk Grouping Software Market, By Product, 2017–2024 (USD Million)
Table 26 North America: Clinical Risk Grouping Software Market, By Deployment Mode, 2017–2024 (USD Million)
Table 27 North America: Clinical Risk Grouping Software Market, By End User, 2017–2024 (USD Million)
Table 28 US: Key Macroindicators
Table 29 US: Clinical Risk Grouping Solutions Market, By Product, 2017–2024 (USD Million)
Table 30 US: Clinical Risk Grouping Software Market, By Deployment Mode, 2017–2024 (USD Million)
Table 31 US: Clinical Risk Grouping Software Market, By End User, 2017–2024 (USD Million)
Table 32 Canada: Key Macroindicators
Table 33 Canada: Clinical Risk Grouping Solutions Market, By Product, 2017–2024 (USD Million)
Table 34 Canada: Clinical Risk Grouping Software Market, By Deployment Mode, 2017–2024 (USD Million)
Table 35 Canada: Clinical Risk Grouping Solutions Market, By End User, 2017–2024 (USD Million)
Table 36 Europe: Clinical Risk Grouping Software Market, By Country, 2017–2024 (USD Million)
Table 37 Europe: Clinical Risk Grouping Solutions Market, By Product, 2017–2024 (USD Million)
Table 38 Europe: Clinical Risk Grouping Software Market, By Deployment Mode, 2017–2024 (USD Million)
Table 39 Europe: Clinical Risk Grouping Software Market, By End User, 2017–2024 (USD Million)
Table 40 Germany: Key Macroindicators
Table 41 Germany: Clinical Risk Grouping Solutions Market, By Product, 2017–2024 (USD Million)
Table 42 Germany: Clinical Risk Grouping Software Market, By Deployment Mode, 2017–2024 (USD Million)
Table 43 Germany: Clinical Risk Grouping Software Market, By End User, 2017–2024 (USD Million)
Table 44 UK: Key Macroindicators
Table 45 UK: Clinical Risk Grouping Solutions Market, By Product, 2017–2024 (USD Million)
Table 46 UK: Clinical Risk Grouping Software Market, By Deployment Mode, 2017–2024 (USD Million)
Table 47 UK: Clinical Risk Grouping Software Market, By End User, 2017–2024 (USD Million)
Table 48 France: Clinical Risk Grouping Solutions Market, By Product, 2017–2024 (USD Million)
Table 49 France: Clinical Risk Grouping Software Market, By Deployment Mode, 2017–2024 (USD Million)
Table 50 France: Clinical Risk Grouping Software Market, By End User, 2017–2024 (USD Million)
Table 51 RoE: Clinical Risk Grouping Solutions Market, By Product, 2017–2024 (USD Million)
Table 52 RoE: Clinical Risk Grouping Software Market, By Deployment Mode, 2017–2024 (USD Million)
Table 53 RoE: Clinical Risk Grouping Solutions Market, By End User, 2017–2024 (USD Million)
Table 54 Asia Pacific: Clinical Risk Grouping Solutions Market, By Product, 2017–2024 (USD Million)
Table 55 Asia Pacific: Clinical Risk Grouping Software Market, By Deployment Mode, 2017–2024 (USD Million)
Table 56 Asia Pacific: Clinical Risk Grouping Software Market, By End User, 2017–2024 (USD Million)
Table 57 Latin America: Clinical Risk Grouping Solutions Market, By Product, 2017–2024 (USD Million)
Table 58 Latin America: Clinical Risk Grouping Software Market, By Deployment Mode, 2017–2024 (USD Million)
Table 59 Latin America: Clinical Risk Grouping Solutions Market, By End User, 2017–2024 (USD Million)
Table 60 Middle East and Africa: Clinical Risk Grouping Software Market, By Product, 2017–2024 (USD Million)
Table 61 Middle East and Africa: Clinical Risk Grouping Solutions Market, By Deployment Mode, 2017–2024 (USD Million)
Table 62 Middle East and Africa: Clinical Risk Grouping Solutions Market, By End User, 2017–2024 (USD Million)
Table 63 Product Launches and Enhancements (2017–2019)
Table 64 Acquisitions, Joint Ventures, and Mergers (2017–2019)
Table 65 Collaborations, Agreements, and Partnerships (2018–2019)
Table 66 Expansions (2017)
List of Figures (31 Figures)
Figure 1 Clinical Risk Grouping Solutions Market Segmentation
Figure 2 Research Design
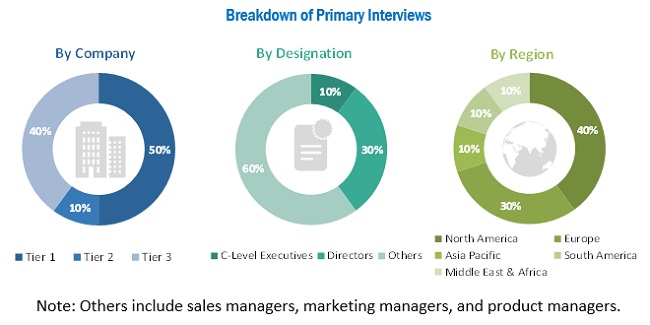
Figure 3 Breakdown of Primary Interviews: By Company Type, Designation, and Region
Figure 4 Bottom-Up Approach
Figure 5 Top-Down Approach
Figure 6 Data Triangulation Methodology
Figure 7 Clinical Risk Grouping Solutions Market, By Product, 2019 vs 2024 (USD Million)
Figure 8 Clinical Risk Grouping Software Market, By Deployment Mode, 2019 vs 2024 (USD Million)
Figure 9 Clinical Risk Grouping Solutions Market, By End User, 2019 vs 2024 (USD Million)
Figure 10 Geographical Snapshot of the Clinical Risk Grouping Solutions Market
Figure 11 Advantages of Risk Management Solutions to Drive Market Growth
Figure 12 Asia Pacific Market to Register the Highest Growth During the Forecast Period
Figure 13 North America Will Continue to Dominate the Clinical Risk Grouping Software Market in 2024
Figure 14 Asia Pacific to Register Higher Growth Rates During the Forecast Period
Figure 15 Clinical Risk Grouping Solutions Market: Drivers, Restraints, Opportunities, and Challenges
Figure 16 Healthcare Data Breaches in the US (2016–2019)
Figure 17 Scorecards & Visualization Tools Segment to Dominate the Clinical Risk Grouping Solutions Market in 2019
Figure 18 Private Cloud to Hold the Largest Share of the Clinical Risk Grouping Solutions Market During the Forecast Period
Figure 19 Hospitals to Dominate the Clinical Risk Grouping Solutions Market During the Forecast Period
Figure 20 Clinical Risk Grouping Solutions Market: Geographic Snapshot
Figure 21 North America: Clinical Risk Grouping Solutions Market Snapshot
Figure 22 Europe: Clinical Risk Grouping Software Market Snapshot
Figure 23 Key Developments in the Clinical Risk Grouping Solutions Market Between 2016 and 2019
Figure 24 Clinical Risk Grouping Solutions Market Competitive Leadership Mapping, 2018
Figure 25 3M and Optum are the Leading Players in the Clinical Risk Grouping Solutions Market
Figure 26 3M Company: Company Snapshot (2018)
Figure 27 Optum Inc.: Company Snapshot (2018)
Figure 28 Cerner: Company Snapshot (2018)
Figure 29 Nuance Communications: Company Snapshot (2018)
Figure 30 Conduent Incorporated: Company Snapshot (2018)
Figure 31 Evolent Health: Company Snapshot (2018)
The study involved four major activities in estimating the current market size for clinical risk grouping solutions market. Exhaustive secondary research was done to collect information on the market as well as its peer and parent markets. The next step was to validate these findings, assumptions, and sizing with industry experts across the value chain through primary research. Both the top-down and bottom-up approaches were employed to estimate the complete market size. After that, market breakdown and data triangulation were used to estimate the market size of segments and sub-segments.
Secondary Research
This research study involved the use of comprehensive secondary sources; directories; databases such as D&B Hoover’s, Bloomberg Business, and Factiva; white papers; annual reports; companies’ house documents; and SEC filings. Secondary research was used to identify and collect information for this extensive, technical, market-oriented, and commercial study of the global market. It was also used to obtain important information about the top players, market classification, and segmentation according to industry trends to the bottom-most level, geographic markets, key developments related to market, and technology perspectives. A database of the key industry leaders was also prepared using secondary research.
Primary Research
In the primary research process, various sources from both supply and demand sides were interviewed to obtain qualitative and quantitative information for this report. The primary sources from the supply side include industry experts such as CEOs, vice presidents, marketing and sales directors, technology & innovation directors, and related key executives from various key companies operating in the clinical risk grouping solutions market. The primary sources from the demand side include experts from health systems and healthcare payers.
Primary research was conducted to validate the market segmentation, identify key players in the market, and gather insights on key industry trends and burning issues, and key market dynamics such as market drivers, challenges, and opportunities.
To know about the assumptions considered for the study, download the pdf brochure
Market Share Estimation
The market shares for clinical risk grouping solutions companies was arrived at after detailed assessment of their revenues from the clinical risk grouping solutions business by secondary data available through paid and unpaid sources. Owing to data limitations, in certain cases revenue share was arrived at after detailed assessment of the product portfolios of major companies and their respective sales performance. At each point, this data was validated through primary interviews w
After arriving at the overall market size—using the market size estimation processes as explained above—the market was split into several segments and subsegments. To complete the overall market engineering process and arrive at the exact statistics of each market segment and subsegment, the data triangulation, and market breakdown procedures were employed, wherever applicable. The data was triangulated by studying various factors and trends from both the demand and supply sides.
Objectives of the Study
- To define, describe, segment, and forecast the global market based on product, deployment model, end-user, and region
- To provide detailed information regarding the major factors influencing the growth of the market (such as drivers, restraints, opportunities, and industry-specific challenges)
- To analyze micromarkets1 with respect to individual growth trends, future prospects, and contributions to the overall clinical risk grouping solutions market
- To analyze the opportunities in the market for stakeholders and provide details of the competitive landscape for market players
- To forecast the size of the market, in five main regions —North America, Europe, the Asia Pacific, Latin America, and the Middle East and Africa
- To profile key players in the global market and comprehensively analyze their core competencies and market shares
- To track and analyze competitive developments such as mergers and acquisitions; new product/technology launches; expansions; collaborations and agreements; and R&D activities of the leading players in the global market
Available customizations
With the given market data, MarketsandMarkets offers customizations as per the company’s specific needs. The following customization options are available for the report:
Geographic Analysis
- Further breakdown of the Asia Pacific clinical risk grouping solutions market into Australia, New Zealand, and others
- Further breakdown of the Latin American market into Brazil, Mexico, and others
Company Information
- Detailed analysis and profiling of additional market players

 Generating Response ...


Growth opportunities and latent adjacency in Clinical Risk Grouping Solutions Market