Closed Molding Composites Market by Fiber Type (Carbon, Glass), Application (Aerospace & Defense, Transportation, Construction, Wind, E&E), Process (Vacuum Infusion & Bagging, Compression Molding, Pultrusion, Injection Molding) - Global Forecast to 2021


[161 Pages Report] The closed molding composites is estimated to grow from USD 46.48 Billion in 2016 to USD 66.58 Billion by 2021, at a CAGR of 7.45% between 2016 and 2021. The base year considered for the study is 2015 and the market size is projected between 2016 and 2021. Increase in use of composites in aerospace & defense and wind energy applications are driving the market.
Objectives of the Study:
The report analyzes the global closed molding composites market, in terms of volume (kiloton) and value (USD million).The report also estimates the market size and growth potential of the closed molding composites across different segments such as fiber type, manufacturing process, application, and region. It forecasts the market size in terms of regions, namely, Asia-Pacific, North America, Europe, and the Middle East & Africa, and Latin America. The study also covers market opportunities and competitive landscape for stakeholders and market leaders.
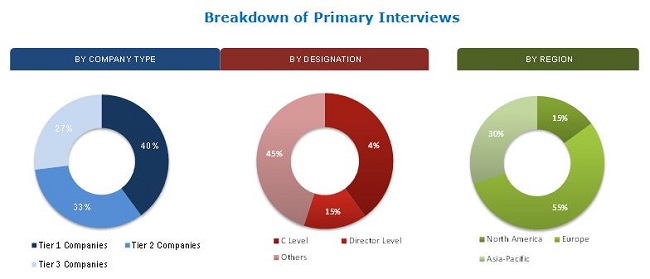
The research methodology used to estimate and forecast the closed molding composites begins with gathering data of the key company revenues and raw material costs through secondary sources such as Factiva, Hoovers, Manta, and others. The product offerings are also taken into consideration to determine the market segmentation. The bottom-up approach has been used to arrive at the overall market size of closed molding composites from the revenue of the key players. After arriving at the total market size, the overall market has been split into several segments and subsegments, which have then been verified through primary research by conducting extensive interviews with CEOs, VPs, directors, and executives. Data triangulation and market breakdown procedures have been used to complete the overall market engineering process and arrive at the exact statistics for all segments and sub-segments. The breakdown of profiles of primary interviewees is shown in the figure below:
To know about the assumptions considered for the study, download the pdf brochure
The closed molding composites value chain includes manufacturers of resin, fiber, and adhesive. Resin manufacturers include Huntsman Corporation (U.S.), Gurit Holding AG (Switzerland), Scott Bader Co. Ltd. (U.K.). The major fiber manufacturers include Teijin Ltd. (Japan), Royal TenCate N.V. (Netherlands), and others. The key manufacturers of closed molding composites are A. Schulman (U.S), Strongwell Corp. (U.S.), Continental Structural Plastics Inc. (U.S.), Core Molding Technologies (U.S.), Royal TenCate N.V. (Netherlands), Menzolit GmbH (Germany), GKN Aerospace (U.K.), and others. The applications of closed molding composites mainly include transportation, aerospace & defense, electrical & electronics, construction, and wind energy.
Target Audience
- Closed molding composite manufacturers
- Raw material suppliers
- Distributors & suppliers
- Industry associations
�The study answers several questions for the stakeholders, primarily which market segments to focus on in the next two to five years for prioritizing the efforts and investments.�
Scope of the Report
The research report segments the closed molding composites into the following submarkets:
By Fiber Type:
- Glass fiber composites
- Carbon fiber composites
- Chopped carbon fiber
- Continuous carbon Fiber
- Other fiber composites
- Aramid fiber composites
- Natural fiber composites
By Application:
- Transportation
- Interiors
- Exteriors
- Aerospace & defense
- Interiors
- Exteriors
- Wind Energy
- Electrical & Electronics
- Construction
- Industrial
- Housing
- Civil Engineering
- Others
- Marine
- Sporting Goods
By Process:
- Vacuum Infusion & Bagging
- Compression Molding
- Injection Molding
- Reaction Injection Molding
- Pultrusion
- Resin Transfer Molding (RTM)
- Light Resin Transfer Molding (LRTM)
- Vacuum Assisted Resin Transfer Molding (VARTM)
- Others
- Centrifugal Casting
- Continuous Lamination
By Region:
- North America
- Europe
- Asia-Pacific
- Middle East & Africa
- Latin America
Available Customizations
With the given market data, MarketsandMarkets offers customizations according to the company�s specific needs. The following customization options are available for the report:
Product Analysis
- Product matrix, which gives a detailed comparison of product portfolio of each company
Regional Analysis
- Further breakdown of the North American closed molding composites market
- Further breakdown of the European closed molding composites market
- Further breakdown of the Asia-Pacific closed molding composites market
- Further breakdown of the Middle East & Africa closed molding composites market
- Further breakdown of the Latin American closed molding composites market
- Company Information
- Detailed analysis and profiling of additional market players
The global closed molding composites market is projected to grow from USD 46.48 Billion in 2016 to USD 66.58 Billion by 2021, at a CAGR of 7.45% during the forecast period. The closed molding composites market is growing because high demand from the aerospace & defense industry, as they have the ability to reduce weight and increase fuel efficiency. Closed molding process improves productivity through innovative engineering approaches, minimizes energy consumption, and reduces VOC emission level. The market witnessed a strong growth in the past few years considering the use of composites in the U.S., Germany, and developing countries such as China, Brazil, and Japan.
The closed molding composites market is segmented on the basis of manufacturing process into vacuum infusion & bagging, compression molding, pultrusion, injection molding, RTM, and others. Vacuum infusion & bagging is the most preferred closed molding process to manufacture composites that accounted for a major share, in terms of value, in 2015. This is because of its use in manufacturing components for aerospace & defense, transportation, and wind energy applications. The process produces strong, lightweight laminates, and offers substantial emission reductions. The demand for closed molding composites manufactured by compression molding process is increasing in applications such as transportation, construction, and electrical & electronics, as they require good surface finish and non-corrosive properties, which are provided by these composites.
The closed molding composites market in aerospace interior is also segmented by application, which includes transportation, aerospace & defense, wind energy, electrical & electronics, construction, and others. Aerospace & defense accounts for the highest market share in terms of value owing to the factors such as rise in monthly production of Boeing�s 787 from 10 aircraft to 12 aircraft in 2016 (Composites World); it is expected to reach 16 aircraft per month by 2019. This is likely to increase the demand for closed molding composites from Boeing, as they account for nearly 50% of the structural components of Boeing aircraft.
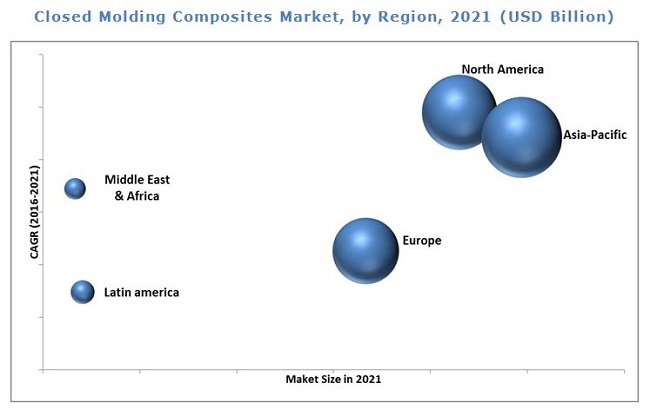
Currently, Asia-Pacific is the largest consumer of closed molding composites. Japan and China are also the major markets due to the growing wind energy industry in China, which witnessed the highest number of wind energy installations in 2015. This increases the RTM process, as it is mainly involved in manufacturing closed molding composites for this industry.
High cost of raw materials and high investment costs restrain the growth of the closed molding composites market.
Royal TenCate N.V (Netherlands), Core Molding Technologies Inc. (U.S) and Strongwell Corp. (U.S) are some of the leading players in the closed molding composites market. Royal TenCate N.V has been able to hold a leading position in the market by tapping various global markets. It has undertaken strategic alliances with local distribution centers of emerging markets to increase its market share and customer base. As a part of the closed molding composites company growth strategy, it is mainly focused on agreements and partnership strategies.
To speak to our analyst for a discussion on the above findings, click Speak to Analyst
 Exclusive indicates content/data unique to MarketsandMarkets and not available with any competitors.
Table of Contents
1 Introduction (Page No. - 14)
1.1 Objectives of the Study
1.2 Market Definition
1.3 Market Scope
1.3.1 Markets Covered
1.3.2 Years Considered for the Study
1.4 Currency
1.5 Limitations
1.6 Stakeholders
2 Research Methodology (Page No. - 17)
2.1 Research Data
2.1.1 Secondary Data
2.1.1.1 Key Data From Secondary Sources
2.1.2 Primary Data
2.1.2.1 Key Data From Primary Sources
2.1.2.2 Key Industry Insights
2.1.2.3 Breakdown of Primary Interviews
2.2 Market Size Estimation
2.2.1 Bottom-Up Approach
2.2.2 Top-Down Approach
2.3 Data Triangulation
2.3.1 Research Assumptions
3 Executive Summary (Page No. - 26)
4 Premium Insights (Page No. - 31)
4.1 Significant Growth Opportunities for Closed Molding Composites Market
4.2 Closed Molding Composites Market, By Manufacturing Process
4.3 Aerospace & Defense Application Accounted for the Largest Share of Closed Molding Composites Market in 2015
4.4 Closed Molding Composites Market, By Country
4.5 Closed Molding Composites Market, By Process Type
4.6 Glass Fiber Composites to Outpace Other Fibers in Closed Molding Composites Market
5 Market Overview (Page No. - 35)
5.1 Introduction
5.2 Market Segmentation
5.2.1 Closed Molding Composites Market, By Fiber Type
5.2.2 Closed Molding Composites Market, By Manufacturing Process
5.2.3 Closed Molding Composites Market, By Application
5.3 Market Dynamics
5.3.1 Drivers
5.3.1.1 Use of Eco-Friendly Processes for Manufacturing Composites
5.3.1.2 Increase in Use of Composites in Aerospace & Defense Industry
5.3.1.3 Reduction in Cycle Time and Labor Costs
5.3.2 Restraints
5.3.2.1 High Investment Costs
5.3.2.2 High Cost of Raw Materials
5.3.3 Opportunities
5.3.3.1 Increase in Use of Closed Molding Composites in New Applications
5.3.4 Challenges
5.3.4.1 Need for Reducing Cost of Carbon Fiber
5.4 Porter�s Five Forces Analysis
5.4.1 Threat of New Entrants
5.4.2 Threat of Substitutes
5.4.3 Bargaining Power of Suppliers
5.4.4 Bargaining Power of Buyers
5.4.5 Intensity of Competitive Rivalry
6 Macroeconomic Overview and Key Trends (Page No. - 45)
6.1 Introduction
6.2 Trends and Forecast of GDP
6.3 Per Capita GDP vs Per Capita Composite Materials Demand
6.4 Trends and Forecast of Construction Industry
6.4.1 Trends and Forecast of Construction Industry in North America
6.4.2 Trends and Forecast of Construction Industry in Europe
6.4.3 Trends and Forecast of Construction Industry in Asia-Pacific
6.4.4 Trends and Forecast of Construction Industry in ME&A
6.4.5 Trends and Forecast of Construction Industry in Latin America
6.5 Trends of Wind Energy Industry
6.6 Trends of Aerospace Industry
6.7 Trends of Automotive Industry
7 Closed Molding Composites Market, By Fiber Type (Page No. - 58)
7.1 Introduction
7.2 Carbon Fiber Closed Molding Composites
7.2.1 Chopped Carbon Fiber
7.2.2 Continuous Carbon Fiber
7.3 Glass Fiber Closed Molding Composites
7.4 Other Fiber Closed Molding Composites
7.4.1 Aramid Fiber Closed Molding Composites
7.4.2 Natural Fiber Closed Molding Composites
8 Closed Molding Composites Market, By Manufacturing Process (Page No. - 67)
8.1 Introduction
8.2 Vacuum Infusion & Bagging
8.2.1 Vacuum Infusion
8.2.2 Vacuum Bagging
8.3 Injection Molding Process
8.3.1 Reaction Injection Molding
8.4 Pultrusion Process
8.5 Compression Molding Process
8.6 Resin Transfer Molding Process
8.6.1 Light RTM
8.6.2 Vartm
8.7 Other Processes
8.7.1 Centrifugal Casting
8.7.2 Continuous Lamination
9 Closed Molding Composites Market, By Application (Page No. - 79)
9.1 Introduction
9.2 Transportation
9.2.1 Interiors
9.2.2 Exteriors
9.3 Aerospace & Defense
9.3.1 Interiors
9.3.2 Exteriors
9.4 Electrical & Electronics
9.5 Wind Energy
9.6 Construction & Infrastructure
9.6.1 Industrial
9.6.2 Housing
9.6.3 Civil Engineering
9.7 Other Applications
9.7.1 Marine
9.7.2 Consumer Good
10 Closed Molding Composites Market, By Region (Page No. - 93)
10.1 Introduction
10.2 North America
10.2.1 U.S.
10.2.2 Canada
10.3 Europe
10.3.1 Germany
10.3.2 France
10.3.3 U.K.
10.3.4 Italy
10.3.5 Austria
10.3.6 Netherlands
10.3.7 Poland
10.3.8 Sweden
10.3.9 Spain
10.3.10 Russia
10.3.11 Turkey
10.4 Asia-Pacific
10.4.1 China
10.4.2 India
10.4.3 Japan
10.4.4 South Korea
10.4.5 Australia & New Zealand
10.4.6 Malaysia
10.4.7 Thailand
10.5 Middle East & Africa (ME&A)
10.5.1 Uae
10.5.2 South Africa
10.6 Latin America
10.6.1 Brazil
10.6.2 Mexico
10.6.3 Argentina
11 Competitive Landscape (Page No. - 119)
11.1 Introduction
11.2 Competitive Situations and Trends
11.2.1 Investments & Expansions
11.2.2 Agreements, Joint Ventures, & Partnerships
11.2.3 New Product Developments
11.2.4 Mergers & Acquisitions
12 Company Profiles (Page No. - 127)
(Company at A Glance, Business Overview, Products Offered, Key Strategy, Recent Developments, SWOT Analysis & MnM View)*
12.1 A. Schulman, Inc.
12.2 Royal Tencate N.V.
12.3 Polynt S.P.A
12.4 Exel Composites
12.5 Core Molding Technologies, Inc.
12.6 Strongwell Corporation
12.7 Menzolit GmbH
12.8 Continental Structural Plastics, Inc.
12.9 Saertex
12.10 GKN Aerospace
12.11 List of Other Companies
*Details on Company at A Glance, Recent Financials, Products Offered, Strategies & Insights, & Recent Developments Might Not Be Captured in Case of Unlisted Companies.
13 Appendix (Page No. - 154)
13.1 Insights From Industry Experts
13.2 Knowledge Store: Marketsandmarkets� Subscription Portal
13.3 Discussion Guide
13.4 Introducing RT: Real-Time Market Intelligence
13.5 Available Customizations
13.6 Related Reports
List of Tables (80 Tables)
Table 1 Closed Molding Composites Market Size, in Terms of Value and Volume, 2014�2021
Table 2 Trends and Forecast of GDP, USD Billion (2015�2021)
Table 3 Per Capita GDP vs Per Capita Composite Materials Demand, 2015
Table 4 Contribution of Construction Industry to North American GDP, USD Billion (2014�2021)
Table 5 Contribution of Construction Industry to European GDP, USD Billion (2014�2021)
Table 6 Contribution of Construction Industry to GDP in Asia-Pacific, USD Billion (2014�2021)
Table 7 Contribution of Construction Industry to GDP in ME&A, USD Billion (2014�2021)
Table 8 Contribution of Construction Industry to GDP in Latin America, USD Billion (2014�2021)
Table 9 Wind Energy Installation, MW (2011�2015)
Table 10 New Airplane Deliveries, 2014
Table 11 Automotive Production, Million Units (2011�2015)
Table 12 Closed Molding Composites Market Size, By Fiber Type, 2014�2021 (USD Million)
Table 13 Closed Molding Composites Market Size, By Fiber Type, 2014�2021 (Kiloton)
Table 14 Carbon Fiber Closed Molding Composites Market Size, By Region, 2014�2021 (USD Million)
Table 15 Carbon Fiber Closed Molding Composites Market Size, By Region, 2014�2021 (Kiloton)
Table 16 Glass Fiber Closed Molding Composites Market Size, By Region, 2014�2021 (USD Million)
Table 17 Glass Fiber Closed Molding Composites Market Size, By Region, 2014�2021 (Kiloton)
Table 18 Other Fiber Closed Molding Composites Market Size, By Region, 2014�2021 (USD Million)
Table 19 Others Fiber Closed Molding Composites Market Size, By Region, 2014�2021 (Kiloton)
Table 20 Closed Molding Composites Market Size, By Manufacturing Process, 2014�2021 (USD Million)
Table 21 Closed Molding Composites Market Size, By Manufacturing Process, 2014�2021 (Kiloton)
Table 22 Vacuum Infusion & Bagging Market Size, By Region, 2014�2021 (USD Million)
Table 23 Vacuum Infusion & Bagging Market Size, By Region, 2014�2021 (Kiloton)
Table 24 Injection Molding Process Market Size, By Region, 2014�2021 (USD Million)
Table 25 Injection Molding Process Market Size, By Region, 2014�2021 (Kiloton)
Table 26 Pultrusion Process Market Size, By Region, 2014�2021 (USD Million)
Table 27 Pultrusion Process Market Size, By Region, 2014�2021 (Kiloton)
Table 28 Compression Molding Process Market Size, By Region, 2014�2021 (USD Million)
Table 29 Compression Molding Process Market Size, By Region, 2014�2021 (Kiloton)
Table 30 RTM Process Market Size, By Region, 2014�2021 (USD Million)
Table 31 RTM Process Market Size, By Region, 2014�2021 (Kiloton)
Table 32 Other Manufacturing Processes Market Size, By Region, 2014�2021 (USD Million)
Table 33 Other Manufacturing Processes Market Size, By Region, 2014�2021 (Kiloton)
Table 34 Closed Molding Composites Market Size, By Application, 2014�2021 (USD Million)
Table 35 Closed Molding Composites Market Size, By Application, 2014�2021 (Kiloton)
Table 36 Closed Molding Composites Market Size in Transportation Application, By Region, 2014�2021 (USD Million)
Table 37 Closed Molding Composites Market Size in Transportation Application, By Region, 2014�2021 (Kiloton)
Table 38 Demand Forecast for New Airplanes By 2034
Table 39 Closed Molding Composites Market Size in Aerospace & Defense Application, By Region, 2014�2021 (USD Million)
Table 40 Closed Molding Composites Market Size in Aerospace & Defense Application, By Region, 2014�2021 (Kiloton)
Table 41 Closed Molding Composites Market Size in Electrical & Electronics Application, By Region, 2014�2021 (USD Million)
Table 42 Closed Molding Composites Market Size in Electrical & Electronics Application, By Region, 2014�2021 (Kiloton)
Table 43 Germany: Annual Wind Energy Installations, 2012�2015 (MW)
Table 44 France: Annual Wind Energy Installations, 2012�2015 (MW)
Table 45 U.K.: Annual Wind Energy Installations, 2012�2015 (MW)
Table 46 Asia-Pacific: Annual Wind Energy Installations, 2014 and 2015 (MW)
Table 47 Closed Molding Composites Market Size in Wind Energy Application, By Region, 2014�2021 (USD Million)
Table 48 Closed Molding Composites Market Size in Wind Energy Application, By Region, 2014�2021 (Kiloton)
Table 49 Closed Molding Composites Market Size in Construction & Infrastructure Application, By Region, 2014�2021 (USD Million)
Table 50 Closed Molding Composites Market Size in Construction & Infrastructure Application, By Region, 2014�2021 (Kiloton)
Table 51 Closed Molding Composites Market Size in Other Applications, By Region, 2014�2021 (USD Million)
Table 52 Closed Molding Composites Market Size in Other Applications, By Region, 2014�2021 (Kiloton)
Table 53 Closed Molding Composites Market Size, By Region, 2014�2021 (USD Million)
Table 54 Closed Molding Composites Market Size, By Region, 2014�2021 (Kiloton)
Table 55 North America: Closed Molding Composites Market Size, By Country, 2014�2021 (USD Million)
Table 56 North America: Closed Molding Composites Market Size, By Country, 2014�2021 (Kiloton)
Table 57 North America: Closed Molding Composites Market Size, By Manufacturing Process, 2014�2021 (USD Million)
Table 58 North America: Closed Molding Composites Market Size, By Manufacturing Process, 2014�2021 (Kiloton)
Table 59 North America: Closed Molding Composites Market Size, By Fiber Type, 2014�2021 (USD Million)
Table 60 North America: Closed Molding Composites Market Size, By Fiber Type, 2014�2021 (Kiloton)
Table 61 Europe: Closed Molding Composites Market Size, By Country, 2014�2021 (USD Million)
Table 62 Europe: Closed Molding Composites Market Size, By Country, 2014�2021 (Kiloton)
Table 63 Europe: Closed Molding Composites Market Size, By Manufacturing Process, 2014�2021 (USD Million)
Table 64 Europe: Closed Molding Composites Market Size, By Manufacturing Process, 2014�2021 (Kiloton)
Table 65 Asia-Pacific: Closed Molding Composites Market Size, By Country, 2014�2021 (USD Million)
Table 66 Asia-Pacific: Closed Molding Composites Market Size, By Country, 2014�2021 (Kiloton)
Table 67 Asia-Pacific: Closed Molding Composites Market Size, By Manufacturing Process, 2014�2021 (USD Million)
Table 68 Asia-Pacific: Closed Molding Composites Market Size, By Manufacturing Process, 2014�2021 (Kiloton)
Table 69 Middle East & Africa: Closed Molding Composites Market Size, By Country, 2014�2021 (USD Million)
Table 70 Middle East & Africa: Closed Molding Composites Market Size, By Country, 2014�2021 (Kiloton)
Table 71 Middle East & Africa: Closed Molding Composites Market Size, By Manufacturing Process, 2014�2021 (USD Million)
Table 72 Middle East & Africa: Closed Molding Composites Market Size, By Manufacturing Process, 2014�2021 (Kiloton)
Table 73 Latin America: Closed Molding Composites Market Size, By Country, 2014�2021 (USD Million)
Table 74 Latin America: Closed Molding Composites Market Size, By Country, 2014�2021 (Kiloton)
Table 75 Latin America: Closed Molding Composites Market Size, By Manufacturing Process, 2014�2021 (USD Million)
Table 76 Latin America: Closed Molding Composites Market Size, By Manufacturing Process, 2014�2021 (Kiloton)
Table 77 Investments & Expansions, 2012�2016
Table 78 Agreements, Joint Ventures & Partnerships, 2012�2016
Table 79 New Product Developments, 2012�2016
Table 80 Mergers & Acquisitions , 2012�2016
List of Figures (51 Figures)
Figure 1 Closed Molding Composites: Market Segmentation
Figure 2 Years Considered for the Study
Figure 3 Closed Molding Composites Market: Research Methodology
Figure 4 Market Size Estimation Methodology: Bottom-Up Approach
Figure 5 Market Size Estimation Methodology: Top-Down Approach
Figure 6 Data Triangulation: Methodology
Figure 7 Aerospace & Defense to Drive Closed Molding Composites Market
Figure 8 Asia-Pacific Dominated Closed Molding Composites Market, By Value (2015)
Figure 9 India to Be the Fastest-Growing Closed Molding Composites Market in Asia-Pacific
Figure 10 Vacuum Infusion & Bagging Dominates Closed Molding Composites Market
Figure 11 Attractive Opportunities for Market Players
Figure 12 Aerospace & Defense: the Fastest Growing Application Segment of Closed Molding Composites Market
Figure 13 Asia-Pacific: the Largest Market for Closed Molding Composites, in Terms of Value
Figure 14 Asia-Pacific to Be the Fastest-Growing Market, 2016�2021
Figure 15 Vacuum Infusion & Bagging to Be the Fastest-Growing Process in Closed Molding Composites Market
Figure 16 Carbon Fiber to Be the Fastest-Growing Segment
Figure 17 Drivers, Restraints, Opportunities, and Challenges of Closed Molding Composites Market
Figure 18 Porter�s Five Forces Analysis: Low Threat of New Entrants Due to Capital-Intensiveness
Figure 19 Trends and Forecast of GDP, USD Billion (2016�2021)
Figure 20 Per Capita GDP vs Per Capita Composite Materials Demand
Figure 21 Trends and Forecast of Construction Industry Contribution to North American GDP, USD Billion
Figure 22 Construction Industry in U.K. Contributes the Maximum to the GDP of Europe, USD Billion, 2015 vs 2021
Figure 23 Construction Industry in China Contributes the Maximum to the GDP of Asia-Pacific, 2015 vs 2021
Figure 24 Construction Industry in Saudi Arabia Contributes the Maximum to the GDP of ME&A, 2015 vs 2021
Figure 25 Construction Industry in Brazil Contributes the Maximum to the Latin American GDP, 2015 vs 2021
Figure 26 Wind Energy Installed Capacity, MW (2014�2015)
Figure 27 New Airplane Deliveries, By Region, 2014
Figure 28 Automotive Production in Key Countries, Million Units (2011 vs 2015)
Figure 29 Glass Fiber Dominates Closed Molding Composites Market
Figure 30 Asia-Pacific Dominates Glass Fiber Closed Molding Composites Market
Figure 31 Vacuum Infusion & Bagging Manufacturing Process Dominates the Closed Molding Composite Market
Figure 32 Asia-Pacific to Drive Closed Molding Composites Market for Injection Molding Process
Figure 33 RTM Process to Register the Highest CAGR in Asia-Pacific
Figure 34 Closed Molding Composites Market in Aerospace & Defense Applications to Witness Highest Growth
Figure 35 North America to Dominate the Closed Molding Composites Market in Aerospace & Defense Application
Figure 36 Asia-Pacific Dominated the Closed Molding Composites Market in Wind Energy Application
Figure 37 China and India Projected to Drive the Closed Molding Composites Market in Asia-Pacific
Figure 38 U.S. is the Most Lucrative Market in North America
Figure 39 Germany is the Fastest-Growing Closed Molding Composites Market in Europe
Figure 40 China is the Biggest Closed Molding Composites Market in Asia-Pacific
Figure 41 Vacuum Infusion is the Most Preferred Process for Manufacture of Closed Molding Composites in Latin America
Figure 42 Key Companies Preferred Agreements, Joint Ventures, & Partnerships Between 2012 and 2016
Figure 43 Application Mapping By Key Players of the Closed Molding Composites Market
Figure 44 Agreements, Joint Ventures & Partnerships: Most Preferred Strategy Between 2011 and 2016
Figure 45 Maximum Number of Developments Observed in 2015
Figure 46 A. Schulman, Inc.: Company Snapshot
Figure 47 Royal Tencate N.V.: Company Snapshot
Figure 48 Polynt S.P.A: Company Snapshot
Figure 49 Polynt S.P.A.: SWOT Analysis
Figure 50 Exel Composites: Company Snapshot
Figure 51 Core Molding Technologies, Inc.: Company Snapshot


Growth opportunities and latent adjacency in Closed Molding Composites Market