Cloud ITSM Market

Cloud ITSM Market by Components ( Solutions (Service Portfolio Management, Configuration & Change Management, Service Desk Software) And Services), Vertical (BFSI, IT & ITeS, Retail & Consumer Goods), Organization Size, and Region - Global Forecast to 2025

Report Code: TC 4348 Dec, 2020, by marketsandmarkets.com

[210 Pages Report] The global Cloud IT Service Management Market size is estimated to reach USD 12.2 billion by 2025, at a Compound Annual Growth Rate (CAGR) of 21.2%. The market for Cloud ITSM was valued USD 4.7 billion in 2020.

The growth of Cloud ITSM Market will be stagnant post-COVID-19 as cloud ITSM market is a matured market. While technology spending in APAC has increased, the setback due to the recent COVID-19 pandemic is imminent.

Cloud ITSM Market

To know about the assumptions considered for the study, Request for Free Sample Report

COVID-19 Impact

COVID-19 has globally changed the dynamics of business operations. Although the COVID-19 outbreak has showcased weaknesses in business models across sectors, it has also offered several opportunities to cloud ITSM vendors to expand their business across enterprises as the adoption of the cloud has increased in lockdown due to COVID-19. Amid lockdown, several companies are reducing their IT spending in 2020. They are strategically reconsidering their CAPEX spending. According to one of the primary respondents, companies are showing a keen interest to invest in CAPEX models if required persistently, otherwise they opt for OPEX models. To achieve these strategies and avoid capital spending in these difficult financial times, organizations are moving to the public cloud. This situation is favorable for cloud ITSM vendors as they offer more opportunities with a huge client base in untapped markets.

Market Dynamics

Drivers: Increasing shift to cloud-based technologies

With the rising adoption of cloud-based technologies, there has been a growth in opportunities for cloud-based ITSM vendors. Organizations wish to obtain IT services externally at a cost that is aligned with their usage of IT services, rather than building and maintaining these services on-premises. Previously, ITSM solutions were considered to be a complex and costly on-premises affair, but currently, cloud-based versions of these solutions are easily available for SMEs. Large enterprises are opting for cloud-based ITSM solutions to manage their IT resources better and align their IT services with real world business needs. As cloud technology is gaining traction, more enterprises are shifting their workloads to the cloud. To manage this increasing heavy traffic of applications and services on the cloud, there is a significant need for ITSM services. The deployment of ITSM solutions on the cloud provides great opportunities for market growth as they help streamline operations. By moving applications of enterprises and their ITSM operations to the cloud, organizations save huge infrastructure costs. Hence, cost-effectiveness, agility, and scalability of cloud services are proving to be profitable for organizations and inspiring them to move beyond on-premises ITSM solutions, thereby opening the gates for cloud-based ITSM in the next few years.

Restraints: Security and privacy concerns for confidential data and business processes

Data security is one of the most important aspects of business continuity. In today’s digital world, access to critical information leads to a number of challenges. One of these challenges is that enterprises storing sensitive data are the major targets for cybercriminals. Maintaining the privacy and confidentiality of organizational data plays a crucial role in enterprises. Hence, companies are reluctant to move their data as well as business operations to the cloud and prefer using on-premises ITSM solutions, which inhibit the growth of the cloud ITSM market. Though cloud-based ITSM solutions have evolved in recent years, data security capabilities of such solutions pose a major challenge for this market. Enterprises are extremely sensitive when it comes to their communication channels, as it directly affects the security and privacy of the organizational data. In the cloud ITSM marketspace, this security-related concern is substantial as the customer’s business is fully dependent on the security and privacy of organizational data and the available IT services. In case of any disruption to organizational data, clients’ businesses will suffer a major setback. Hence, cloud ITSM processes need to be monitored continuously to minimize risks and improve the security features of these solutions. Cloud ITSM solutions must ensure the safety of sensitive data while interacting via systems and services.

Challenges: Lack of standard procedures and integration concerns with traditional architectures

Integration is the process of connecting two or more IT systems, which is one of the major challenges faced by organizations. The lack of standard procedures and the integration concerns for different IT systems and their communication protocols are some of the major issues that enterprises deal with while transferring information. Over the last few years, companies have been growing through partnerships, mergers, and acquisitions and gaining complex and heterogeneous IT environment components. In such a scenario, shifting to the cloud becomes a prominent problem for several organizations. Enterprises struggle to figure out the best cloud ITSM solutions and ways to efficiently implement the same keeping in mind their current IT architecture. As more and more companies are turning their operations to the cloud, they need to overcome the challenge of integrating cloud ITSM solutions with their complex heterogeneous environment, which comes at an increased overhead cost.

Opportunities: Growing demand among small and medium-sized enterprises

The adoption of cloud-based ITSM solutions reduces the CAPEX and OPEX of enterprises, which has led to a rise in the demand for these solutions among SMEs and startups. As on-premises ITSM solutions require huge CAPEX as well as increased OPEX to setup IT infrastructure and deploy the solution, SMEs and startups are reluctant to adopt them. SMEs opt for public cloud services to meet their business requirements and prefer to invest in revenue-generating services since they have a smaller budget as compared to large enterprises. The pay-per-use and license-based models are more feasible for SMEs and startups as per their business needs. The ITSM system can promptly be set up and configured in a SaaS-based environment by ITSM solution providers. Additional benefits of cloud-based ITSM solutions are driving the growth of the overall market, which is increasing the popularity of these solutions among startups and SMEs.

Market Ecosystem

Cloud ITSM Market  by Region

To know about the assumptions considered for the study, download the pdf brochure

Based on component, solutions segment to be a larger contributor to the cloud ITSM market growth during the forecast period

ITSM solutions focus on the management of IT infrastructures, components, business applications, and associated processes. Various industry groups have defined recommendations on services and processes to implement ITSM that can be referred to address the business need or requirement, such as ITIL, Control Objectives for Information and Related Technology (COBIT), and the emerging IT4IT by The Open Group. Enterprises are migrating enterprise applications to the cloud at a fast pace. Organizations demand secure, stable, and reliable cloud infrastructure to gain agility, reduce operational costs, and stay compliant with ITSM. Cloud ITSM offers various benefits, such as minimal investments as the service can be purchased using a subscription model. SMEs leverage a low-cost implementation of ITSM to build the IT help desk that can be easily scaled depending on enterprises' requirements. Few cloud ITSM providers offer services based on the number of users that access the system, proving beneficial to SMEs that have limited users. Cloud ITSM solutions are gaining popularity among enterprises of different size as it offers integrated capabilities, such as dashboards, notifications alerts, service level management, and connection between data and management services. Vendors, such as ServiceNow, BMC, Cherwell Software, Ivanti, Broadcom, and IBM, offer cloud ITSM solutions.

Based on organization size, the large netrprise segment to be a larger contributor to the Cloud ITSM market growth during the forecast period

Large enterprises are enterprises that have more than 1,000 employees. The large enterprises are utilizing the cloud ITSM offerings to delivery services to customers effectively. The adoption of cloud ITSM solutions among large enterprises is high due to the ever-increasing demand for cloud automation, and the trend is expected to continue during the forecast period. Large enterprises are heavily investing in advanced technologies to increase overall productivity and efficiency. With the ever-increasing amount of data, large enterprises need to invest in their IT infrastructure and technical expertise for automating various tasks regularly. To reduce CAPEX and OPEX of infrastructure, large enterprises are widely adopting cloud ITSM solutions. Large enterprises are expected to invest significantly to implement suitable cloud ITSM solutions, which would enable enterprises to save on infrastructure costs, improve business functioning, and sustain themselves in intense competition.

Asia Pacific (APAC) to grow at the highest CAGR during the forecast period

In APAC, the demand for loud ITSM solutions is on the rise due to low costs and greater agility. With the implementation of advanced technologies, APAC is expected to grow considerably, resulting in better opportunities for service providers. Improved business functioning and reduced operational expenses are the major drivers for the significant adoption of cloud ITSM solutions in this region. However, the lack of technical expertise acts as a barrier to the adoption of cloud management solutions and services. Some of the key players in this region are IBM, HPE,and Microsoft.

The cloud ITSM market is dominated by companies such as ServiceNow (US), BMC Software (US), Cherwell Software (US), Broadcom (US), Ivanti (US), HPE (US), IBM (US), Axios Systems (US), Citrix Systems (US), Hornbill (UK), Microsoft (US), EasyVista (US), Micro Focus (UK), Atlassian (Australia), Alemba (UK), SysAid (Israel), Freshworks (US), LogMeIn (US), ManageEngine (US), Efecte (Finland), EZOfficeInventory (US), Mint Service Desk (Poland), Device42 (US), LeanIX (Germany), Aisera (US), ITSM (Australia), Electric (US), InfraSight Labs (Sweden), Symphony SummitAI (US), and ITarian (US). These vendors have a large customer base and strong geographic footprint along with organized distribution channels, which helps them to increase revenues.

Scope of the Report

Report Metrics

Details

Market size available for years

2016-2025

Base year considered

2019

Forecast period

2020-2025

Forecast units

Value (USD Million)

Segments covered

Component (solutions and services), Solutions, Organization Size, Verticals, and Regions

Regions covered

North America, Europe, APAC, MEA, and Latin America

Companies covered

ServiceNow (US), BMC Software (US), Cherwell Software (US), Broadcom (US), Ivanti (US), HPE (US), IBM (US), Axios Systems (US), Citrix Systems (US), Hornbill (UK), Microsoft (US), EasyVista (US), Micro Focus (UK), Atlassian (Australia), Alemba (UK), SysAid (Israel), Freshworks (US), LogMeIn (US), ManageEngine (US), Efecte (Finland), EZOfficeInventory (US), Mint Service Desk (Poland), Device42 (US), LeanIX (Germany), Aisera (US), ITSM (Australia), Electric (US), InfraSight Labs (Sweden), Symphony SummitAI (US), and ITarian (US)..

This research report categorizes the Cloud ITSM market to forecast revenue and analyze trends in each of the following submarkets:

Based on the component:

  • Solutions
  • Services

Based on the solutions:

Based on organization size:

  • Small and Medium-sized Enterprises (SMEs)
  • Large Enterprises

Based on verticals:

  • Banking, Financial Services, and Insurance (BFSI)
  • Telecommunications
  • IT and ITeS
  • Government and Public Sector
  • Retail and Consumer Goods
  • Manufacturing
  • Energy and Utilities
  • Media and Entertainment
  • Healthcare and Life Sciences
  • Others (education, travel and hospitality, and transportation and logistics)

Based on regions:

  • North America
    • US
    • Canada
  • Europe
    • UK
    • Germany
    • France
    • Rest of Europe
  • APAC
    • China
    • Japan
    • Australia
    • Rest of APAC
  • MEA
    • Saudi Arabia
    • UAE
    • South Africa
    • Rest of MEA
  • Latin America
    • Brazil
    • Mexico
    • Rest of Latin America

Recent Developments

In June 2020, ServiceNow to expand its data center capacity in the UK and Ireland. ServiceNow is developing new data center facilities in two locations: Newport, UK, and Dublin, Ireland. This expansion will increase the company's footprint in Europe and continue to ensure the scalability of its cloud services.

Frequently Asked Questions (FAQ):

To speak to our analyst for a discussion on the above findings, click Speak to Analyst


TABLE OF CONTENTS

1 INTRODUCTION (Page No. - 23)
    1.1 INTRODUCTION TO COVID-19
    1.2 COVID-19 HEALTH ASSESSMENT
           FIGURE 1 COVID-19: GLOBAL PROPAGATION
           FIGURE 2 COVID-19 PROPAGATION: SELECT COUNTRIES
    1.3 COVID-19 ECONOMIC ASSESSMENT
           FIGURE 3 REVISED GROSS DOMESTIC PRODUCT FORECASTS FOR SELECT G20 COUNTRIES IN 2020
           1.3.1 COVID-19 ECONOMIC IMPACT—SCENARIO ASSESSMENT
                    FIGURE 4 FACTORS IMPACTING GLOBAL ECONOMY
                    FIGURE 5 SCENARIOS IN TERMS OF RECOVERY OF GLOBAL ECONOMY
    1.4 OBJECTIVES OF THE STUDY
    1.5 MARKET DEFINITION
           1.5.1 INCLUSIONS AND EXCLUSIONS
    1.6 MARKET SCOPE
           1.6.1 MARKET SEGMENTATION
           1.6.2 REGIONS COVERED
           1.6.3 YEARS CONSIDERED FOR THE STUDY
    1.7 CURRENCY CONSIDERED
           TABLE 1 UNITED STATES DOLLAR EXCHANGE RATE, 2017–2019
    1.8 STAKEHOLDERS
    1.9 SUMMARY OF CHANGES

2 RESEARCH METHODOLOGY (Page No. - 33)
    2.1 RESEARCH DATA
           FIGURE 6 CLOUD ITSM MARKET: RESEARCH DESIGN
           2.1.1 SECONDARY DATA
           2.1.2 PRIMARY DATA
                    2.1.2.1 Breakup of primary profiles
                               FIGURE 7 BREAKUP OF PRIMARY INTERVIEWS: BY COMPANY TYPE, DESIGNATION, AND REGION
                    2.1.2.2 Key industry insights
    2.2 DATA TRIANGULATION
    2.3 MARKET SIZE ESTIMATION
           FIGURE 8 CLOUD ITSM MARKET: TOP-DOWN AND BOTTOM-UP APPROACHES
           FIGURE 9 MARKET SIZE ESTIMATION METHODOLOGY – APPROACH 1 (SUPPLY SIDE): REVENUES OF SOLUTIONS AND SERVICES FROM VENDORS
           FIGURE 10 MARKET SIZE ESTIMATION METHODOLOGY – APPROACH 2 (SUPPLY SIDE): REVENUE GENERATED BY SALE OF CLOUD ITSM SOLUTION/ SERVICE OFFERINGS IN MARKET
           FIGURE 11 MARKET SIZE ESTIMATION METHODOLOGY – APPROACH 2 (DEMAND SIDE): REVENUE GENERATED FROM VERTICALS
    2.4 MARKET FORECAST
           TABLE 2 FACTOR ANALYSIS
    2.5 RESEARCH ASSUMPTIONS
    2.6 LIMITATIONS OF THE STUDY

3 EXECUTIVE SUMMARY (Page No. - 43)
    FIGURE 12 CLOUD ITSM MARKET: GLOBAL SNAPSHOT
    FIGURE 13 TOP-GROWING SEGMENTS IN MARKET
    FIGURE 14 OPERATIONS AND PERFORMANCE MANAGEMENT SEGMENT TO HOLD LARGEST MARKET SIZE DURING FORECAST PERIOD
    FIGURE 15 LARGE ENTERPRISES SEGMENT TO HOLD LARGER MARKET SIZE DURING FORECAST PERIOD
    FIGURE 16 BANKING, FINANCIAL SERVICES, AND INSURANCE VERTICAL TO HOLD LARGEST MARKET SIZE DURING FORECAST PERIOD
    FIGURE 17 CLOUD ITSM MARKET: REGIONAL SNAPSHOT

4 PREMIUM INSIGHTS (Page No. - 48)
    4.1 ATTRACTIVE GROWTH OPPORTUNITIES IN CLOUD ITSM MARKET
           FIGURE 18 FOCUS ON IMPROVING CUSTOMER EXPERIENCE AND SIMPLIFYING IT OPERATIONS WORKFLOW TO DRIVE ADOPTION OF MARKET
    4.2 MARKET, BY SOLUTION, 2020 VS. 2025
           FIGURE 19 SERVICE PORTFOLIO MANAGEMENT SEGMENT TO HOLD LARGEST MARKET SHARE DURING 2020–2025
    4.3 MARKET, BY ORGANIZATION SIZE, 2020 VS. 2025
           FIGURE 20 LARGE ENTERPRISES SEGMENT TO HOLD LARGER MARKET SHARE DURING 2020–2025
    4.4 MARKET, BY VERTICAL, 2020 VS. 2025
           FIGURE 21 BANKING, FINANCIAL SERVICES, AND INSURANCE VERTICAL TO HOLD LARGEST MARKET SHARE DURING 2020–2025
    4.5 MARKET: REGIONAL SCENARIO, 2020–2025
           FIGURE 22 ASIA PACIFIC TO EMERGE AS BEST MARKET FOR INVESTMENTS IN NEXT FIVE YEARS

5 MARKET OVERVIEW AND INDUSTRY TRENDS (Page No. - 51)
    5.1 INTRODUCTION
           FIGURE 23 DRIVERS, RESTRAINTS, OPPORTUNITIES, AND CHALLENGES: CLOUD ITSM MARKET
           5.1.1 DRIVERS
                    5.1.1.1 COVID-19—a catalyst to accelerate adoption of cloud-based ITSM solutions and services
                    5.1.1.2 Increasing shift to cloud-based technologies
                    5.1.1.3 Benefits of agile implementation, easy deployment, and OPEX model
           5.1.2 RESTRAINTS
                    5.1.2.1 Security and privacy concerns for confidential data and business processes
           5.1.3 OPPORTUNITIES
                    5.1.3.1 Growing demand among small and medium-sized enterprises
                    5.1.3.2 Widespread adoption of BYOD trend and increasing mobile workforce
           5.1.4 CHALLENGES
                    5.1.4.1 Lack of standard procedures and integration concerns with traditional architectures
    5.2 COVID-19-DRIVEN MARKET DYNAMICS
           5.2.1 DRIVERS AND OPPORTUNITIES
           5.2.2 RESTRAINTS AND CHALLENGES
    5.3 CASE STUDY ANALYSIS
           5.3.1 CASE STUDY 1: STREAMLINING IT PROCESSES
           5.3.2 CASE STUDY 2: REDUCING IT COSTS WITH DIGITAL TRANSFORMATION
           5.3.3 CASE STUDY 3: IMPROVING SUPPORT PROCESSES ACROSS THE BUSINESS
    5.4 ECOSYSTEM
           FIGURE 24 ECOSYSTEM: CLOUD ITSM MARKET
    5.5 TECHNOLOGY ANALYSIS
           5.5.1 ARTIFICIAL INTELLIGENCE
           5.5.2 ANALYTICS
    5.6 PRICING ANALYSIS
           TABLE 3 PRICING ANALYSIS: CLOUD ITSM VENDORS
    5.7 PATENT ANALYSIS

6 CLOUD ITSM MARKET, BY COMPONENT (Page No. - 61)
    6.1 INTRODUCTION
           FIGURE 25 SOLUTIONS SEGMENT TO HOLD LARGER MARKET SIZE IN 2020
           6.1.1 COMPONENTS: MARKET DRIVERS
           6.1.2 COMPONENTS: COVID-19 IMPACT
                    TABLE 4 MARKET SIZE, BY COMPONENT, 2016–2019 (USD MILLION)
                    TABLE 5 MARKET SIZE, BY COMPONENT, 2020–2025 (USD MILLION)
    6.2 SOLUTIONS
           TABLE 6 SOLUTIONS: MARKET SIZE, BY REGION, 2016–2019 (USD MILLION)
           TABLE 7 SOLUTIONS: MARKET SIZE, BY REGION, 2020–2025 (USD MILLION)
           TABLE 8 MARKET SIZE, BY SOLUTION, 2016–2019 (USD MILLION)
           TABLE 9 MARKET SIZE, BY SOLUTION, 2020–2025 (USD MILLION)
           6.2.1 SERVICE PORTFOLIO MANAGEMENT
                    6.2.1.1 Service level management
                    6.2.1.2 IT asset management
                    6.2.1.3 Financial management
                               TABLE 10 SERVICE PORTFOLIO MANAGEMENT: CLOUD ITSM MARKET SIZE, BY REGION, 2016–2019 (USD MILLION)
                               TABLE 11 SERVICE PORTFOLIO MANAGEMENT: MARKET SIZE, BY REGION, 2020–2025 (USD MILLION)
           6.2.2 CONFIGURATION AND CHANGE MANAGEMENT
                    6.2.2.1 Configuration management
                    6.2.2.2 Change and release management
                               TABLE 12 CONFIGURATION AND CHANGE MANAGEMENT: MARKET SIZE, BY REGION, 2016–2019 (USD MILLION)
                               TABLE 13 CONFIGURATION AND CHANGE MANAGEMENT: MARKET SIZE, BY REGION, 2020–2025 (USD MILLION)
           6.2.3 SERVICE DESK SOFTWARE
                    6.2.3.1 Event and incident management
                    6.2.3.2 Problem management
                    6.2.3.3 Access management
                    6.2.3.4 Request fulfillment and self-service solutions
                               TABLE 14 SERVICE DESK SOFTWARE: CLOUD ITSM MARKET SIZE, BY REGION, 2016–2019 (USD MILLION)
                               TABLE 15 SERVICE DESK SOFTWARE: MARKET SIZE, BY REGION, 2020–2025 (USD MILLION)
           6.2.4 OPERATIONS AND PERFORMANCE MANAGEMENT
                    6.2.4.1 Availability management
                    6.2.4.2 Performance monitoring and IT operations management
                    6.2.4.3 Workload automation
                               TABLE 16 OPERATIONS AND PERFORMANCE MANAGEMENT: MARKET SIZE, BY REGION, 2016–2019 (USD MILLION)
                               TABLE 17 OPERATIONS AND PERFORMANCE MANAGEMENT: MARKET SIZE, BY REGION, 2020–2025 (USD MILLION)
           6.2.5 DASHBOARD, REPORTING, AND ANALYTICS
                               TABLE 18 DASHBOARD, REPORTING, AND ANALYTICS: MARKET SIZE, BY REGION, 2016–2019 (USD MILLION)
                               TABLE 19 DASHBOARD, REPORTING, AND ANALYTICS: CLOUD ITSM MARKET SIZE, BY REGION, 2020–2025 (USD MILLION)
    6.3 SERVICES
           6.3.1 MANAGED SERVICES
           6.3.2 PROFESSIONAL SERVICES
                    TABLE 20 SERVICES: MARKET SIZE, BY REGION, 2016–2019 (USD MILLION)
                    TABLE 21 SERVICES: MARKET SIZE, BY REGION, 2020–2025 (USD MILLION)

7 CLOUD ITSM MARKET, BY ORGANIZATION SIZE (Page No. - 74)
    7.1 INTRODUCTION
           FIGURE 26 LARGE ENTERPRISES SEGMENT TO HOLD LARGER MARKET SIZE IN 2020
           7.1.1 ORGANIZATION SIZE: MARKET DRIVERS
           7.1.2 ORGANIZATION SIZE: COVID-19 IMPACT
                    TABLE 22 MARKET SIZE, BY ORGANIZATION SIZE, 2016–2019 (USD MILLION)
                    TABLE 23 MARKET SIZE, BY ORGANIZATION SIZE, 2020–2025 (USD MILLION)
    7.2 LARGE ENTERPRISES
           TABLE 24 LARGE ENTERPRISES: MARKET SIZE, BY REGION, 2016–2019 (USD MILLION)
           TABLE 25 LARGE ENTERPRISES: MARKET SIZE, BY REGION, 2020–2025 (USD MILLION)
    7.3 SMALL AND MEDIUM-SIZED ENTERPRISES
           TABLE 26 SMALL AND MEDIUM-SIZED ENTERPRISES: MARKET SIZE, BY REGION, 2016–2019 (USD MILLION)
           TABLE 27 SMALL AND MEDIUM-SIZED ENTERPRISES: MARKET SIZE, BY REGION, 2020–2025 (USD MILLION)

8 CLOUD ITSM MARKET, BY VERTICAL (Page No. - 79)
    8.1 INTRODUCTION
           FIGURE 27 BANKING FINANCIAL SERVICES AND INSURANCE VERTICAL TO GROW AT HIGHEST CAGR DURING FORECAST PERIOD
           8.1.1 VERTICALS: MARKET DRIVERS
           8.1.2 VERTICALS: COVID-19 IMPACT
                    TABLE 28 MARKET SIZE, BY VERTICAL, 2016–2019 (USD MILLION)
                    TABLE 29 MARKET SIZE, BY VERTICAL, 2020–2025 (USD MILLION)
    8.2 BANKING, FINANCIAL SERVICES, AND INSURANCE
           TABLE 30 BANKING, FINANCIAL SERVICES, AND INSURANCE: CLOUD ITSM MARKET SIZE, BY REGION, 2016–2019 (USD MILLION)
           TABLE 31 BANKING, FINANCIAL SERVICES, AND INSURANCE: MARKET SIZE, BY REGION, 2020–2025 (USD MILLION)
           TABLE 32 BANKING, FINANCIAL SERVICES, AND INSURANCE: MARKET SIZE, BY COMPONENT, 2016–2019 (USD MILLION)
           TABLE 33 BANKING, FINANCIAL SERVICES, AND INSURANCE: MARKET SIZE, BY COMPONENT, 2020–2025 (USD MILLION)
           TABLE 34 BANKING, FINANCIAL SERVICES, AND INSURANCE: MARKET SIZE, BY ORGANIZATION SIZE, 2016–2019 (USD MILLION)
           TABLE 35 BANKING, FINANCIAL SERVICES, AND INSURANCE: MARKET SIZE, BY ORGANIZATION SIZE, 2020–2025 (USD MILLION)
    8.3 TELECOMMUNICATIONS
           TABLE 36 TELECOMMUNICATIONS: CLOUD ITSM MARKET SIZE, BY REGION, 2016–2019 (USD MILLION)
           TABLE 37 TELECOMMUNICATIONS: MARKET SIZE, BY REGION, 2020–2025 (USD MILLION)
           TABLE 38 TELECOMMUNICATIONS: MARKET SIZE, BY COMPONENT, 2016–2019 (USD MILLION)
           TABLE 39 TELECOMMUNICATIONS: MARKET SIZE, BY COMPONENT, 2020–2025 (USD MILLION)
           TABLE 40 TELECOMMUNICATIONS: MARKET SIZE, BY ORGANIZATION SIZE, 2016–2019 (USD MILLION)
           TABLE 41 TELECOMMUNICATIONS: MARKET SIZE, BY ORGANIZATION SIZE, 2020–2025 (USD MILLION)
    8.4 IT AND ITES
           TABLE 42 IT AND ITES: CLOUD ITSM MARKET SIZE, BY REGION, 2016–2019 (USD MILLION)
           TABLE 43 IT AND ITES: MARKET SIZE, BY REGION, 2020–2025 (USD MILLION)
           TABLE 44 IT AND ITES: MARKET SIZE, BY COMPONENT, 2016–2019 (USD MILLION)
           TABLE 45 IT AND ITES: MARKET SIZE, BY COMPONENT, 2020–2025 (USD MILLION)
           TABLE 46 IT AND ITES: MARKET SIZE, BY ORGANIZATION SIZE, 2016–2019 (USD MILLION)
           TABLE 47 IT AND ITES: MARKET SIZE, BY ORGANIZATION SIZE, 2020–2025 (USD MILLION)
    8.5 GOVERNMENT AND PUBLIC SECTOR
           TABLE 48 GOVERNMENT AND PUBLIC SECTOR: CLOUD ITSM MARKET SIZE, BY REGION, 2016–2019 (USD MILLION)
           TABLE 49 GOVERNMENT AND PUBLIC SECTOR: MARKET SIZE, BY REGION, 2020–2025 (USD MILLION)
           TABLE 50 GOVERNMENT AND PUBLIC SECTOR: MARKET SIZE, BY COMPONENT, 2016–2019 (USD MILLION)
           TABLE 51 GOVERNMENT AND PUBLIC SECTOR: MARKET SIZE, BY COMPONENT, 2020–2025 (USD MILLION)
           TABLE 52 GOVERNMENT AND PUBLIC SECTOR: MARKET SIZE, BY ORGANIZATION SIZE, 2016–2019 (USD MILLION)
           TABLE 53 GOVERNMENT AND PUBLIC SECTOR: MARKET SIZE, BY ORGANIZATION SIZE, 2020–2025 (USD MILLION)
    8.6 RETAIL AND CONSUMER GOODS
           TABLE 54 RETAIL AND CONSUMER GOODS: CLOUD ITSM MARKET SIZE, BY REGION, 2016–2019 (USD MILLION)
           TABLE 55 RETAIL AND CONSUMER GOODS: MARKET SIZE, BY REGION, 2020–2025 (USD MILLION)
           TABLE 56 RETAIL AND CONSUMER GOODS: MARKET SIZE, BY COMPONENT, 2016–2019 (USD MILLION)
           TABLE 57 RETAIL AND CONSUMER GOODS: MARKET SIZE, BY COMPONENT, 2020–2025 (USD MILLION)
           TABLE 58 RETAIL AND CONSUMER GOODS: MARKET SIZE, BY ORGANIZATION SIZE, 2016–2019 (USD MILLION)
           TABLE 59 RETAIL AND CONSUMER GOODS: MARKET SIZE, BY ORGANIZATION SIZE, 2020–2025 (USD MILLION)
    8.7 MANUFACTURING
           TABLE 60 MANUFACTURING: CLOUD ITSM MARKET SIZE, BY REGION, 2016–2019 (USD MILLION)
           TABLE 61 MANUFACTURING: MARKET SIZE, BY REGION, 2020–2025 (USD MILLION)
           TABLE 62 MANUFACTURING: MARKET SIZE, BY COMPONENT, 2016–2019 (USD MILLION)
           TABLE 63 MANUFACTURING: MARKET SIZE, BY COMPONENT, 2020–2025 (USD MILLION)
           TABLE 64 MANUFACTURING: MARKET SIZE, BY ORGANIZATION SIZE, 2016–2019 (USD MILLION)
           TABLE 65 MANUFACTURING: MARKET SIZE, BY ORGANIZATION SIZE, 2020–2025 (USD MILLION)
    8.8 ENERGY AND UTILITIES
           TABLE 66 ENERGY AND UTILITIES: CLOUD ITSM MARKET SIZE, BY REGION, 2016–2019 (USD MILLION)
           TABLE 67 ENERGY AND UTILITIES: MARKET SIZE, BY REGION, 2020–2025 (USD MILLION)
           TABLE 68 ENERGY AND UTILITIES: MARKET SIZE, BY COMPONENT, 2016–2019 (USD MILLION)
           TABLE 69 ENERGY AND UTILITIES: MARKET SIZE, BY COMPONENT, 2020–2025 (USD MILLION)
           TABLE 70 ENERGY AND UTILITIES: MARKET SIZE, BY ORGANIZATION SIZE, 2016–2019 (USD MILLION)
           TABLE 71 ENERGY AND UTILITIES: MARKET SIZE, BY ORGANIZATION SIZE, 2020–2025 (USD MILLION)
    8.9 MEDIA AND ENTERTAINMENT
           TABLE 72 MEDIA AND ENTERTAINMENT: CLOUD ITSM MARKET SIZE, BY REGION, 2016–2019 (USD MILLION)
           TABLE 73 MEDIA AND ENTERTAINMENT: MARKET SIZE, BY REGION, 2020–2025 (USD MILLION)
           TABLE 74 MEDIA AND ENTERTAINMENT: MARKET SIZE, BY COMPONENT, 2016–2019 (USD MILLION)
           TABLE 75 MEDIA AND ENTERTAINMENT: MARKET SIZE, BY COMPONENT, 2020–2025 (USD MILLION)
           TABLE 76 MEDIA AND ENTERTAINMENT: MARKET SIZE, BY ORGANIZATION SIZE, 2016–2019 (USD MILLION)
           TABLE 77 MEDIA AND ENTERTAINMENT: MARKET SIZE, BY ORGANIZATION SIZE, 2020–2025 (USD MILLION)
    8.10 HEALTHCARE AND LIFE SCIENCES
           TABLE 78 HEALTHCARE AND LIFE SCIENCES: CLOUD ITSM MARKET SIZE, BY REGION, 2016–2019 (USD MILLION)
           TABLE 79 HEALTHCARE AND LIFE SCIENCES: MARKET SIZE, BY REGION, 2020–2025 (USD MILLION)
           TABLE 80 HEALTHCARE AND LIFE SCIENCES: MARKET SIZE, BY COMPONENT, 2016–2019 (USD MILLION)
           TABLE 81 HEALTHCARE AND LIFE SCIENCES: MARKET SIZE, BY COMPONENT, 2020–2025 (USD MILLION)
           TABLE 82 HEALTHCARE AND LIFE SCIENCES: MARKET SIZE, BY ORGANIZATION SIZE, 2016–2019 (USD MILLION)
           TABLE 83 HEALTHCARE AND LIFE SCIENCES: MARKET SIZE, BY ORGANIZATION SIZE, 2020–2025 (USD MILLION)
    8.11 OTHER VERTICALS
                    TABLE 84 OTHER VERTICALS: CLOUD ITSM MARKET SIZE, BY REGION, 2016–2019 (USD MILLION)
                    TABLE 85 OTHER VERTICALS: MARKET SIZE, BY REGION, 2020–2025 (USD MILLION)
                    TABLE 86 OTHER VERTICALS: MARKET SIZE, BY COMPONENT, 2016–2019 (USD MILLION)
                    TABLE 87 OTHER VERTICALS: MARKET SIZE, BY COMPONENT, 2020–2025 (USD MILLION)
                    TABLE 88 OTHER VERTICALS: MARKET SIZE, BY ORGANIZATION SIZE, 2016–2019 (USD MILLION)
                    TABLE 89 OTHER VERTICALS: MARKET SIZE, BY ORGANIZATION SIZE, 2020–2025 (USD MILLION)

9 CLOUD ITSM MARKET, BY REGION (Page No. - 103)
    9.1 INTRODUCTION
           FIGURE 28 NORTH AMERICA TO HOLD LARGEST MARKET SIZE DURING FORECAST PERIOD
           TABLE 90 MARKET SIZE, BY REGION, 2016–2019 (USD MILLION)
           TABLE 91 MARKET SIZE, BY REGION, 2020–2025 (USD MILLION)
    9.2 NORTH AMERICA
           9.2.1 NORTH AMERICA: MARKET DRIVERS
           9.2.2 NORTH AMERICA: COVID-19 IMPACT
           9.2.3 NORTH AMERICA: REGULATIONS
                    FIGURE 29 NORTH AMERICA: MARKET SNAPSHOT
                    TABLE 92 NORTH AMERICA: CLOUD ITSM MARKET SIZE, BY COMPONENT, 2016–2019 (USD MILLION)
                    TABLE 93 NORTH AMERICA: MARKET SIZE, BY COMPONENT, 2020–2025 (USD MILLION)
                    TABLE 94 NORTH AMERICA: MARKET SIZE, BY SOLUTION, 2016–2019 (USD MILLION)
                    TABLE 95 NORTH AMERICA: MARKET SIZE, BY SOLUTION, 2020–2025 (USD MILLION)
                    TABLE 96 NORTH AMERICA: MARKET SIZE, BY ORGANIZATION SIZE, 2016–2019 (USD MILLION)
                    TABLE 97 NORTH AMERICA: MARKET SIZE, BY ORGANIZATION SIZE, 2020–2025 (USD MILLION)
                    TABLE 98 NORTH AMERICA: MARKET SIZE, BY VERTICAL, 2016–2019 (USD MILLION)
                    TABLE 99 NORTH AMERICA: MARKET SIZE, BY VERTICAL, 2020–2025 (USD MILLION)
                    TABLE 100 NORTH AMERICA: MARKET SIZE, BY COUNTRY, 2016–2019 (USD MILLION)
                    TABLE 101 NORTH AMERICA: MARKET SIZE, BY COUNTRY, 2020–2025 (USD MILLION)
           9.2.4 UNITED STATES
                    TABLE 102 UNITED STATES: CLOUD ITSM MARKET SIZE, BY COMPONENT, 2016–2019 (USD MILLION)
                    TABLE 103 UNITED STATES: MARKET SIZE, BY COMPONENT, 2020–2025 (USD MILLION)
                    TABLE 104 UNITED STATES: MARKET SIZE, BY ORGANIZATION SIZE, 2016–2019 (USD MILLION)
                    TABLE 105 UNITED STATES: MARKET SIZE, BY ORGANIZATION SIZE, 2020–2025 (USD MILLION)
           9.2.5 CANADA
                    TABLE 106 CANADA: CLOUD ITSM MARKET SIZE, BY COMPONENT, 2016–2019 (USD MILLION)
                    TABLE 107 CANADA: MARKET SIZE, BY COMPONENT, 2020–2025 (USD MILLION)
                    TABLE 108 CANADA: MARKET SIZE, BY ORGANIZATION SIZE, 2016–2019 (USD MILLION)
                    TABLE 109 CANADA: MARKET SIZE, BY ORGANIZATION SIZE, 2020–2025 (USD MILLION)
    9.3 EUROPE
           9.3.1 EUROPE: MARKET DRIVERS
           9.3.2 EUROPE: COVID-19 IMPACT
           9.3.3 EUROPE: REGULATIONS
                    TABLE 110 EUROPE: CLOUD ITSM MARKET SIZE, BY COMPONENT, 2016–2019 (USD MILLION)
                    TABLE 111 EUROPE: MARKET SIZE, BY COMPONENT, 2020–2025 (USD MILLION)
                    TABLE 112 EUROPE: MARKET SIZE, BY SOLUTION, 2016–2019 (USD MILLION)
                    TABLE 113 EUROPE: MARKET SIZE, BY SOLUTION, 2020–2025 (USD MILLION)
                    TABLE 114 EUROPE: MARKET SIZE, BY ORGANIZATION SIZE, 2016–2019 (USD MILLION)
                    TABLE 115 EUROPE: MARKET SIZE, BY ORGANIZATION SIZE, 2020–2025 (USD MILLION)
                    TABLE 116 EUROPE: MARKET SIZE, BY VERTICAL, 2016–2019 (USD MILLION)
                    TABLE 117 EUROPE: MARKET SIZE, BY VERTICAL, 2020–2025 (USD MILLION)
                    TABLE 118 EUROPE: MARKET SIZE, BY COUNTRY, 2016–2019 (USD MILLION)
                    TABLE 119 EUROPE: MARKET SIZE, BY COUNTRY, 2020–2025 (USD MILLION)
           9.3.4 UNITED KINGDOM
                    TABLE 120 UNITED KINGDOM: CLOUD ITSM MARKET SIZE, BY COMPONENT, 2016–2019 (USD MILLION)
                    TABLE 121 UNITED KINGDOM: MARKET SIZE, BY COMPONENT, 2020–2025 (USD MILLION)
                    TABLE 122 UNITED KINGDOM: MARKET SIZE, BY ORGANIZATION SIZE, 2016–2019 (USD MILLION)
                    TABLE 123 UNITED KINGDOM: MARKET SIZE, BY ORGANIZATION SIZE, 2020–2025 (USD MILLION)
           9.3.5 GERMANY
                    TABLE 124 GERMANY: CLOUD ITSM MARKET SIZE, BY COMPONENT, 2016–2019 (USD MILLION)
                    TABLE 125 GERMANY: MARKET SIZE, BY COMPONENT, 2020–2025 (USD MILLION)
                    TABLE 126 GERMANY: MARKET SIZE, BY ORGANIZATION SIZE, 2016–2019 (USD MILLION)
                    TABLE 127 GERMANY: MARKET SIZE, BY ORGANIZATION SIZE, 2020–2025 (USD MILLION)
           9.3.6 FRANCE
                    TABLE 128 FRANCE: MARKET SIZE, BY COMPONENT, 2016–2019 (USD MILLION)
                    TABLE 129 FRANCE: MARKET SIZE, BY COMPONENT, 2020–2025 (USD MILLION)
                    TABLE 130 FRANCE: MARKET SIZE, BY ORGANIZATION SIZE, 2016–2019 (USD MILLION)
                    TABLE 131 FRANCE: MARKET SIZE, BY ORGANIZATION SIZE, 2020–2025 (USD MILLION)
           9.3.7 REST OF EUROPE
                    TABLE 132 REST OF EUROPE: CLOUD ITSM MARKET SIZE, BY COMPONENT, 2016–2019 (USD MILLION)
                    TABLE 133 REST OF EUROPE: MARKET SIZE, BY COMPONENT, 2020–2025 (USD MILLION)
                    TABLE 134 REST OF EUROPE: MARKET SIZE, BY ORGANIZATION SIZE, 2016–2019 (USD MILLION)
                    TABLE 135 REST OF EUROPE: MARKET SIZE, BY ORGANIZATION SIZE, 2020–2025 (USD MILLION)
    9.4 ASIA PACIFIC
           9.4.1 ASIA PACIFIC: MARKET DRIVERS
           9.4.2 ASIA PACIFIC: COVID-19 IMPACT
           9.4.3 ASIA PACIFIC: REGULATIONS
                    FIGURE 30 ASIA PACIFIC: REGIONAL SNAPSHOT
                    TABLE 136 ASIA PACIFIC: CLOUD ITSM MARKET SIZE, BY COMPONENT, 2016–2019 (USD MILLION)
                    TABLE 137 ASIA PACIFIC: MARKET SIZE, BY COMPONENT, 2020–2025 (USD MILLION)
                    TABLE 138 ASIA PACIFIC: MARKET SIZE, BY SOLUTION, 2016–2019 (USD MILLION)
                    TABLE 139 ASIA PACIFIC: MARKET SIZE, BY SOLUTION, 2020–2025 (USD MILLION)
                    TABLE 140 ASIA PACIFIC: MARKET SIZE, BY ORGANIZATION SIZE, 2016–2019 (USD MILLION)
                    TABLE 141 ASIA PACIFIC: MARKET SIZE, BY ORGANIZATION SIZE, 2020–2025 (USD MILLION)
                    TABLE 142 ASIA PACIFIC: MARKET SIZE, BY VERTICAL, 2016–2019 (USD MILLION)
                    TABLE 143 ASIA PACIFIC: MARKET SIZE, BY VERTICAL, 2020–2025 (USD MILLION)
                    TABLE 144 ASIA PACIFIC: MARKET SIZE, BY COUNTRY, 2016–2019 (USD MILLION)
                    TABLE 145 ASIA PACIFIC: MARKET SIZE, BY COUNTRY, 2020–2025 (USD MILLION)
           9.4.4 CHINA
                    TABLE 146 CHINA: CLOUD ITSM MARKET SIZE, BY COMPONENT, 2016–2019 (USD MILLION)
                    TABLE 147 CHINA: MARKET SIZE, BY COMPONENT, 2020–2025 (USD MILLION)
                    TABLE 148 CHINA: MARKET SIZE, BY ORGANIZATION SIZE, 2016–2019 (USD MILLION)
                    TABLE 149 CHINA: MARKET SIZE, BY ORGANIZATION SIZE, 2020–2025 (USD MILLION)
           9.4.5 JAPAN
                    TABLE 150 JAPAN: MARKET SIZE, BY COMPONENT, 2016–2019 (USD MILLION)
                    TABLE 151 JAPAN: MARKET SIZE, BY COMPONENT, 2020–2025 (USD MILLION)
                    TABLE 152 JAPAN: MARKET SIZE, BY ORGANIZATION SIZE, 2016–2019 (USD MILLION)
                    TABLE 153 JAPAN: MARKET SIZE, BY ORGANIZATION SIZE, 2020–2025 (USD MILLION)
           9.4.6 AUSTRALIA
                    TABLE 154 AUSTRALIA: CLOUD ITSM MARKET SIZE, BY COMPONENT, 2016–2019 (USD MILLION)
                    TABLE 155 AUSTRALIA: MARKET SIZE, BY COMPONENT, 2020–2025 (USD MILLION)
                    TABLE 156 AUSTRALIA: MARKET SIZE, BY ORGANIZATION SIZE, 2016–2019 (USD MILLION)
                    TABLE 157 AUSTRALIA: MARKET SIZE, BY ORGANIZATION SIZE, 2020–2025 (USD MILLION)
           9.4.7 REST OF ASIA PACIFIC
                    TABLE 158 REST OF ASIA PACIFIC: CLOUD ITSM MARKET SIZE, BY COMPONENT, 2016–2019 (USD MILLION)
                    TABLE 159 REST OF ASIA PACIFIC: MARKET SIZE, BY COMPONENT, 2020–2025 (USD MILLION)
                    TABLE 160 REST OF ASIA PACIFIC: MARKET SIZE, BY ORGANIZATION SIZE, 2016–2019 (USD MILLION)
                    TABLE 161 REST OF ASIA PACIFIC: MARKET SIZE, BY ORGANIZATION SIZE, 2020–2025 (USD MILLION)
    9.5 MIDDLE EAST AND AFRICA
           9.5.1 MIDDLE EAST AND AFRICA: MARKET DRIVERS
           9.5.2 MIDDLE EAST AND AFRICA: COVID-19 IMPACT
           9.5.3 MIDDLE EAST AND AFRICA: REGULATIONS
                    TABLE 162 MIDDLE EAST AND AFRICA: CLOUD ITSM MARKET SIZE, BY COMPONENT, 2016–2019 (USD MILLION)
                    TABLE 163 MIDDLE EAST AND AFRICA: MARKET SIZE, BY COMPONENT, 2020–2025 (USD MILLION)
                    TABLE 164 MIDDLE EAST AND AFRICA: MARKET SIZE, BY SOLUTION, 2016–2019 (USD MILLION)
                    TABLE 165 MIDDLE EAST AND AFRICA: MARKET SIZE, BY SOLUTION, 2020–2025 (USD MILLION)
                    TABLE 166 MIDDLE EAST AND AFRICA: MARKET SIZE, BY ORGANIZATION SIZE, 2016–2019 (USD MILLION)
                    TABLE 167 MIDDLE EAST AND AFRICA: MARKET SIZE, BY ORGANIZATION SIZE, 2020–2025 (USD MILLION)
                    TABLE 168 MIDDLE EAST AND AFRICA: MARKET SIZE, BY VERTICAL, 2016–2019 (USD MILLION)
                    TABLE 169 MIDDLE EAST AND AFRICA: MARKET SIZE, BY VERTICAL, 2020–2025 (USD MILLION)
                    TABLE 170 MIDDLE EAST AND AFRICA: MARKET SIZE, BY COUNTRY, 2016–2019 (USD MILLION)
                    TABLE 171 MIDDLE EAST AND AFRICA: MARKET SIZE, BY COUNTRY, 2020–2025 (USD MILLION)
           9.5.4 SAUDI ARABIA
                    TABLE 172 SAUDI ARABIA: CLOUD ITSM MARKET SIZE, BY COMPONENT, 2016–2019 (USD MILLION)
                    TABLE 173 SAUDI ARABIA: MARKET SIZE, BY COMPONENT, 2020–2025 (USD MILLION)
                    TABLE 174 SAUDI ARABIA: MARKET SIZE, BY ORGANIZATION SIZE, 2016–2019 (USD MILLION)
                    TABLE 175 SAUDI ARABIA: MARKET SIZE, BY ORGANIZATION SIZE, 2020–2025 (USD MILLION)
           9.5.5 UNITED ARAB EMIRATES
                    TABLE 176 UNITED ARAB EMIRATES: CLOUD ITSM MARKET SIZE, BY COMPONENT, 2016–2019 (USD MILLION)
                    TABLE 177 UNITED ARAB EMIRATES: MARKET SIZE, BY COMPONENT, 2020–2025 (USD MILLION)
                    TABLE 178 UNITED ARAB EMIRATES: MARKET SIZE, BY ORGANIZATION SIZE, 2016–2019 (USD MILLION)
                    TABLE 179 UNITED ARAB EMIRATES: MARKET SIZE, BY ORGANIZATION SIZE, 2020–2025 (USD MILLION)
           9.5.6 SOUTH AFRICA
                    TABLE 180 SOUTH AFRICA: MARKET SIZE, BY COMPONENT, 2016–2019 (USD MILLION)
                    TABLE 181 SOUTH AFRICA: MARKET SIZE, BY COMPONENT, 2020–2025 (USD MILLION)
                    TABLE 182 SOUTH AFRICA: MARKET SIZE, BY ORGANIZATION SIZE, 2016–2019 (USD MILLION)
                    TABLE 183 SOUTH AFRICA: MARKET SIZE, BY ORGANIZATION SIZE, 2020–2025 (USD MILLION)
           9.5.7 REST OF MIDDLE EAST AND AFRICA
                    TABLE 184 REST OF MIDDLE EAST AND AFRICA: CLOUD ITSM MARKET SIZE, BY COMPONENT, 2016–2019 (USD MILLION)
                    TABLE 185 REST OF MIDDLE EAST AND AFRICA: MARKET SIZE, BY COMPONENT, 2020–2025 (USD MILLION)
                    TABLE 186 REST OF MIDDLE EAST AND AFRICA: MARKET SIZE, BY ORGANIZATION SIZE, 2016–2019 (USD MILLION)
                    TABLE 187 REST OF MIDDLE EAST AND AFRICA: MARKET SIZE, BY ORGANIZATION SIZE, 2020–2025 (USD MILLION)
    9.6 LATIN AMERICA
           9.6.1 LATIN AMERICA: MARKET DRIVERS
           9.6.2 LATIN AMERICA: COVID-19 IMPACT
           9.6.3 LATIN AMERICA: REGULATIONS
                    TABLE 188 LATIN AMERICA: CLOUD ITSM MARKET SIZE, BY COMPONENT, 2016–2019 (USD MILLION)
                    TABLE 189 LATIN AMERICA: MARKET SIZE, BY COMPONENT, 2020–2025 (USD MILLION)
                    TABLE 190 LATIN AMERICA: MARKET SIZE, BY SOLUTION, 2016–2019 (USD MILLION)
                    TABLE 191 LATIN AMERICA: MARKET SIZE, BY SOLUTION, 2020–2025 (USD MILLION)
                    TABLE 192 LATIN AMERICA: MARKET SIZE, BY ORGANIZATION SIZE, 2016–2019 (USD MILLION)
                    TABLE 193 LATIN AMERICA: MARKET SIZE, BY ORGANIZATION SIZE, 2020–2025 (USD MILLION)
                    TABLE 194 LATIN AMERICA: MARKET SIZE, BY VERTICAL, 2016–2019 (USD MILLION)
                    TABLE 195 LATIN AMERICA: MARKET SIZE, BY VERTICAL, 2020–2025 (USD MILLION)
                    TABLE 196 LATIN AMERICA: MARKET SIZE, BY COUNTRY, 2016–2019 (USD MILLION)
                    TABLE 197 LATIN AMERICA: MARKET SIZE, BY COUNTRY, 2020–2025 (USD MILLION)
           9.6.4 BRAZIL
                    TABLE 198 BRAZIL: MARKET SIZE, BY COMPONENT, 2016–2019 (USD MILLION)
                    TABLE 199 BRAZIL: MARKET SIZE, BY COMPONENT, 2020–2025 (USD MILLION)
                    TABLE 200 BRAZIL: MARKET SIZE, BY ORGANIZATION SIZE, 2016–2019 (USD MILLION)
                    TABLE 201 BRAZIL: MARKET SIZE, BY ORGANIZATION SIZE, 2020–2025 (USD MILLION)
           9.6.5 MEXICO
                    TABLE 202 MEXICO: CLOUD ITSM MARKET SIZE, BY COMPONENT, 2016–2019 (USD MILLION)
                    TABLE 203 MEXICO: MARKET SIZE, BY COMPONENT, 2020–2025 (USD MILLION)
                    TABLE 204 MEXICO: MARKET SIZE, BY ORGANIZATION SIZE, 2016–2019 (USD MILLION)
                    TABLE 205 MEXICO: MARKET SIZE, BY ORGANIZATION SIZE, 2020–2025 (USD MILLION)
           9.6.6 REST OF LATIN AMERICA
                    TABLE 206 REST OF LATIN AMERICA: CLOUD ITSM MARKET SIZE, BY COMPONENT, 2016–2019 (USD MILLION)
                    TABLE 207 REST OF LATIN AMERICA: CLOUD ITSM MARKET SIZE, BY COMPONENT, 2020–2025 (USD MILLION)
                    TABLE 208 REST OF LATIN AMERICA: CLOUD ITSM MARKET SIZE, BY ORGANIZATION SIZE, 2016–2019 (USD MILLION)
                    TABLE 209 REST OF LATIN AMERICA: CLOUD ITSM MARKET SIZE, BY ORGANIZATION SIZE, 2020–2025 (USD MILLION)

10 COMPETITIVE LANDSCAPE (Page No. - 152)
     10.1 INTRODUCTION
     10.2 MARKET EVALUATION FRAMEWORK
               FIGURE 31 MARKET EVALUATION FRAMEWORK
     10.3 MARKET SHARE OF TOP VENDORS
               FIGURE 32 VENDOR MARKET SHARE ANALYSIS
     10.4 REVENUE ANALYSIS OF TOP VENDORS
               FIGURE 33 REVENUE ANALYSIS
     10.5 COMPANY EVALUATION QUADRANT
             10.5.1 DEFINITIONS AND METHODOLOGY
                       TABLE 210 COMPANY EVALUATION QUADRANT: CRITERIA
             10.5.2 STAR
             10.5.3 EMERGING LEADER
             10.5.4 PERVASIVE
             10.5.5 PARTICIPANT
                       FIGURE 34 CLOUD ITSM MARKET (GLOBAL): VENDOR EVALUATION QUADRANT, 2020
     10.6 SME/STARTUP EVALUATION QUADRANT
             10.6.1 DEFINITIONS AND METHODOLOGY
                       TABLE 211 SME/START UP EVALUATION QUADRANT: CRITERIA
             10.6.2 PROGRESSIVE VENDORS
             10.6.3 RESPONSIVE VENDORS
             10.6.4 DYNAMIC VENDORS
             10.6.5 STARTING BLOCKS
                       FIGURE 35 CLOUD ITSM MARKET (GLOBAL): SME/STARTUP EVALUATION QUADRANT, 2020

11 COMPANY PROFILES (Page No. - 159)
     11.1 INTRODUCTION
(Business Overview, Platform, Solutions, Products & Services, Key Insights, Recent Developments, MnM View)*
     11.2 SERVICENOW
               FIGURE 36 SERVICENOW: COMPANY SNAPSHOT
     11.3 BMC SOFTWARE
     11.4 CHERWELL SOFTWARE
     11.5 BROADCOM
               FIGURE 37 BROADCOM: COMPANY SNAPSHOT
     11.6 IVANTI
     11.7 IBM
               FIGURE 38 IBM: COMPANY SNAPSHOT
     11.8 AXIOS SYSTEMS
     11.9 CITRIX SYSTEMS
               FIGURE 39 CITRIX SYSTEMS: COMPANY SNAPSHOT
     11.10 HORNBILL
     11.11 HPE
               FIGURE 40 HPE: COMPANY SNAPSHOT
     11.12 EASYVISTA
     11.13 MICRO FOCUS
     11.14 MICROSOFT
     11.15 FRESHWORKS
     11.16 MANAGEENGINE
     11.17 ATLASSIAN
     11.18 LOGMEIN
     11.19 ALEMBA
     11.20 SYSAID
     11.21 EFECTE
*Details on Business Overview, P Platform, Solutions, Products & Services, Key Insights, Recent Developments, MnM View) might not be captured in case of unlisted companies.
     11.22 SMES/STARTUP PROFILES
               11.22.1 EZOFFICEINVENTORY
               11.22.2 MINT SERVICE DESK
               11.22.3 DEVICE42
               11.22.4 LEANIX
               11.22.5 AISERA
               11.22.6 ITSM
               11.22.7 ELECTRIC
               11.22.8 INFRASIGHT LABS
               11.22.9 SYMPHONY SUMMITAI
               11.22.10 ITARIAN

12 ADJACENT MARKET (Page No. - 199)
     12.1 INTRODUCTION
     12.2 CLOUD APPLICATION MARKET
               TABLE 212 CLOUD APPLICATIONS MARKET SIZE, BY APPLICATION, 2018–2025 (USD MILLION)
               TABLE 213 CLOUD APPLICATIONS MARKET SIZE, BY VERTICAL, 2018–2025 (USD MILLION)
               TABLE 214 CLOUD APPLICATIONS MARKET SIZE, BY REGION, 2018–2025 (USD MILLION)

13 APPENDIX (Page No. - 201)
     13.1 DISCUSSION GUIDE
     13.2 KNOWLEDGE STORE: MARKETSANDMARKETS’ SUBSCRIPTION PORTAL
     13.3 AVAILABLE CUSTOMIZATIONS
     13.4 RELATED REPORTS
     13.5 AUTHOR DETAILS

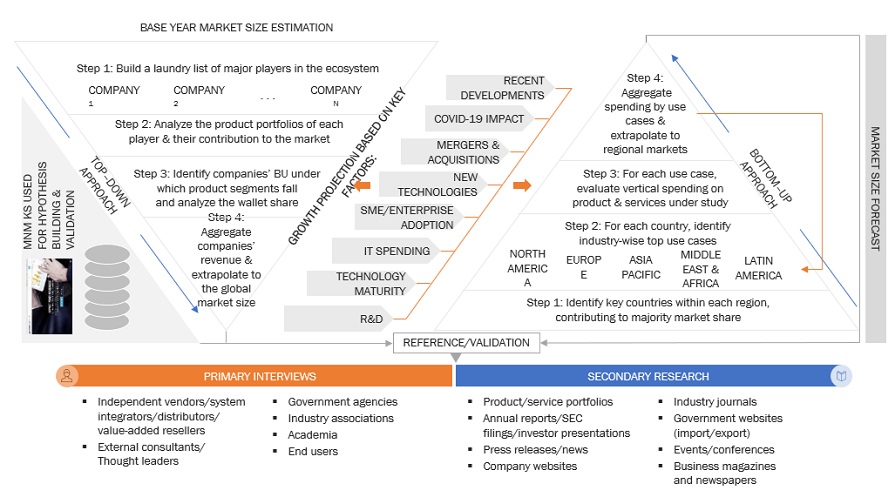
The study involved 4 major activities to estimate the current market size of cloud ITSM solutions. Exhaustive secondary research was done to collect information on the market, the peer market, and the parent market. The next step was to validate these findings, assumptions, and sizing with industry experts across the value chain through primary research. Both top-down and bottom-up approaches were employed to estimate the complete market size. After that, the market breakup and data triangulation procedures were used to estimate the market size of the segments and subsegments.

Secondary Research

In the secondary research process, various secondary sources were referred to for identifying and collecting information for this study. The secondary sources included annual reports, press releases, and investor presentations of companies; whitepapers such as Cisco Cloud Index; certified publications; and articles from recognized associations, such as data center knowledge and government publishing sources. The research study involved the use of extensive secondary sources, directories, and databases, such as D&B Hoovers, DiscoverOrg, Factiva, Bloomberg BusinessWeek, Statista.com, Cloud Computing Association, Asia Cloud Computing Association, The Software Alliance, Mena Cloud Alliance, The European Commission, Cloud Security Alliance, The European Cloud Alliance, EuroCloud to identify and collect information useful for this technical, market-oriented, and commercial study of the Cloud ITSM market. Secondary research was mainly used to obtain key information about the industry’s value chain, the total pool of key players, market classification and segmentation as per the industry trends to the bottom-most level, regional markets, and key developments from both market and technology-oriented perspectives.

Primary Research

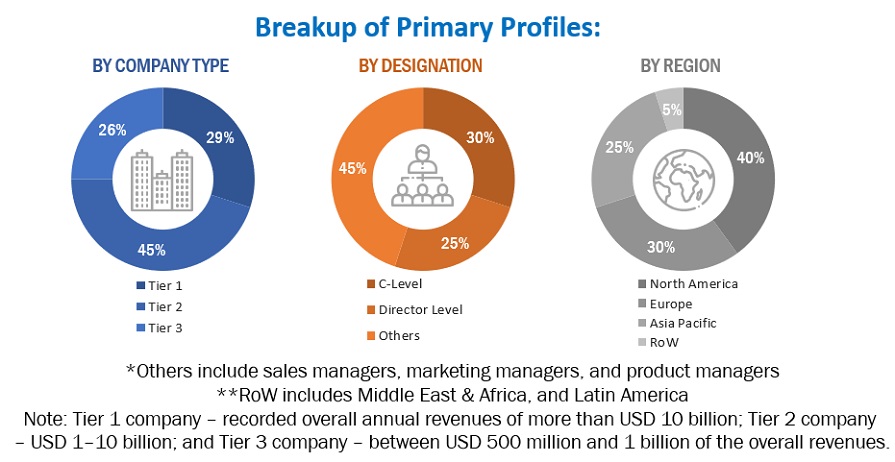
In the primary research process, various primary sources from both the supply and demand sides were interviewed to obtain qualitative and quantitative information for this report. Primary sources from the supply-side included industry experts, such as Chief Executive Officers (CEOs), Vice Presidents (VPs), marketing directors, technology and innovation directors, and related key executives from various key companies and organizations providing Cloud ITSM solutions. The primary sources from the demand side included the end-users of Cloud ITSM solutions, which included Chief Information Officers (CIOs), IT technicians and technologists, and IT managers at public and investor-owned utilities.

The following figure depicts the breakup of the primary profiles:

Cloud ITSM Market  Size, and Share

To know about the assumptions considered for the study, download the pdf brochure

Market Size Estimation

Both top-down and bottom-up approaches were used to estimate and validate the total size of the cloud ITSM market. They were also used extensively to estimate the size of various subsegments in the market. The research methodology used to estimate the market size includes the following:

  • The key players in the industry and markets have been identified through extensive secondary research.
  • The industry’s supply chain and market size, in terms of value, have been determined through primary and secondary research processes.
  • All percentage shares, splits, and breakdowns have been determined using secondary sources and verified through primary sources.

Data Triangulation

After arriving at the overall market size—using the market size estimation processes as explained above—the market was split into several segments and subsegments. To complete the overall market engineering process and arrive at the exact statistics of each market segment and subsegment, the data triangulation and market breakup procedures were employed, wherever applicable. The data was triangulated by studying several factors and trends from both, the demand and supply sides, in the cloud ITSM market.

Report Objectives

  • To define, segment, and project the global market size of the cloud ITSM market
  • To understand the structure of the cloud ITSM market by identifying its various subsegments
  • To provide detailed information about the key factors (drivers, restraints, opportunities, and industry-specific challenges) influencing the growth of the market
  • To analyze the micromarkets with respect to individual growth trends, prospects, and their contribution to the total market
  • To project the size of the market and its submarkets, in terms of value, with respect to the 5 major regions (along with their respective key countries)
  • To profile key players and comprehensively analyze their core competencies
  • To understand the competitive landscape and identify major growth strategies adopted by players across key regions
  • To analyze the competitive developments, such as expansions and investments, new product launches, mergers and acquisitions, joint ventures, and agreements, in the Cloud ITSM market

Available Customizations

With the given market data, MarketsandMarkets offers customizations as per the company’s specific needs and on best effort basis for profiling of additional market players.

Custom Market Research Services

We will customize the research for you, in case the report listed above does not meet with your exact requirements. Our custom research will comprehensively cover the business information you require to help you arrive at strategic and profitable business decisions.

Request Customization
Report Code
TC 4348
Published ON
Dec, 2020
Choose License Type
BUY NOW
  • SHARE
X
Request Customization
Speak to Analyst
Speak to Analyst
OR FACE-TO-FACE MEETING
PERSONALIZE THIS RESEARCH
  • Triangulate with your Own Data
  • Get Data as per your Format and Definition
  • Gain a Deeper Dive on a Specific Application, Geography, Customer or Competitor
  • Any level of Personalization
REQUEST A FREE CUSTOMIZATION
LET US HELP YOU!
  • What are the Known and Unknown Adjacencies Impacting the Cloud ITSM Market
  • What will your New Revenue Sources be?
  • Who will be your Top Customer; what will make them switch?
  • Defend your Market Share or Win Competitors
  • Get a Scorecard for Target Partners
CUSTOMIZED WORKSHOP REQUEST
+1-888-600-6441
  • Call Us
  • +1-888-600-6441 (Corporate office hours)
  • +1-888-600-6441 (US/Can toll free)
  • +44-800-368-9399 (UK office hours)
CONNECT WITH US
ABOUT TRUST ONLINE
©2024 MarketsandMarkets Research Private Ltd. All rights reserved
DMCA.com Protection Status Website Feedback