Cloud Storage Market

Cloud Storage Market by Offering (Storage Type (Object, File, Block), Services), Use Case (Business Continuity, Application Management, Data Management), Deployment Model, Organization Size, Vertical and Region - Global Forecast to 2028

Report Code: TC 2410 Feb, 2024, by marketsandmarkets.com

The Cloud Storage market size is expected to grow from USD 99.2 billion in 2023 to USD 234.9 billion by 2028 at a Compound Annual Growth Rate (CAGR) of 18.8% during the forecast period. The impact of the recession (before, during, and after the recession) on the market is covered throughout the report. Increasing data storage requirements, availability of secure, scalable, enterprise-friendly private cloud storage, reliable, seamless monitoring facilitated, affordable public cloud storage, convenient customization offered, greater user-control or user-friendly, SME-friendly hybrid cloud storage, proliferation and robust adoption of Cloud storage solutions worldwide, are few fundamental factors/forces that drive the global Cloud Storage market.

Cloud Storage Market

To know about the assumptions considered for the study, Request for Free Sample Report

Cloud Storage Market Opportunities

To know about the assumptions considered for the study, download the pdf brochure

Recession Impact on the global Cloud Storage Market 

A recession can significantly impact the Cloud Storage market across organizations, industry verticals, and regions. Businesses may delay investments in these technologies as they prioritize cost-cutting over innovation. Startups in the field may struggle to secure funding as investors become more risk-averse. However, Cloud Storage technologies can find resilience in some sectors, like gaming and entertainment, as people seek entertainment options during recessions. On the positive side, these technologies can facilitate remote work and collaboration, which may increase demand in a remote-work-focused economy. Government stimulus and investments in technology development can also help mitigate the recession's impact. In the end, the extent of the effect varies by region, industry, and the severity of the economic downturn.

Cloud Storage Market Dynamics

Drivers: Cloud storage providers of services driven by growth in data generation

Several key factors drive the growth of the cloud storage market providing services. The exponential surge in data generation, with the demand for low CAPEX and OPEX on IT hardware, plays a crucial role. The cloud storage market is witnessing significant growth due to the expanding realms of IoT and big data. Cloud storage services offer an agile, flexible, and scalable model for data storage on the Internet, managed and operated by service providers. This model provides enterprises with advantages such as rapid deployment, scalability, reduced CAPEX, and uninterrupted business continuity.

Restraints: Surge in metadata

Experts in cloud storage claim that metadata is essential to the cloud storage sector. The amount of metadata in the modern world is growing startlingly and unprecedentedly. Due to the inevitable explosion of unstructured data, its problems will only worsen. Many businesses still recognize that their metadata exceeds the data they keep, which harms performance and scalability. It also affects database sharing and creates new problems that cost money and time. The metadata issue has forced IT companies to pay careful attention to their software stack. Consequently, they can ensure it suits modern, next-generation application demands.

Opportunities: Businesses have ample opportunities to delve into data encryption and edge computing

In the future (next 1-2 years commencing January 2024), cloud storage vendors will focus more on edge computing. Most people are unaware of how crucial it is to consider their location when choosing where to locate cloud services. Moreover, cloud service infrastructure will increase in cost with increased usage. But, providing a smooth link will also require additional work. For this reason, cloud storage vendors will concentrate on edge computing, in which providers try to make cloud resources available close to or close to users. To put it another way, edge computing forces companies to select a site for the service nearest to your address. This helps increase overall reliability and reduce latency.

Challenges: Threat of ransomware

Malware that encrypts access to the files and data of the target enterprise is known as ransomware. The hackers/cybercriminals then demand that the business pay a ransom—essentially an excessive amount in legal parlance—to access their files. This kind of malware could pose a severe threat to the business if it infiltrates the cloud storage used by the organization. A ransomware assault could prevent the company from accessing critical company data, potentially leading to the complete cessation of the company's business activities. Nonetheless, cloud storage companies have acknowledged this problem and are taking preventative measures to combat ransomware. Numerous cloud storage companies have created built-in malware scanning services that evaluate data once the user uploads them to ensure they are virus-free. The scanning services can automatically quarantine anything they find questionable.

Cloud Storage Market Ecosystem

Top Companies in Cloud Storage Market

Based on use cases, backup & Recovery will hold the highest market share in the Cloud Storage market during the forecast period.

Backup & Recovery is crucial in safeguarding data and ensuring business continuity. These applications are purpose-built to address the unique challenges of modern, dynamic, and often distributed IT environments. By seamlessly integrating with cloud technologies and containerized workloads, they provide a layer of resilience that protects data against loss, corruption, or disasters. These solutions enable organizations to efficiently create backups, perform granular recoveries, and maintain data integrity, thereby supporting cloud applications and services reliable and uninterrupted operation. In an era where data is a paramount asset, Backup & Recovery applications in cloud storage are indispensable for mitigating risks and ensuring the availability and integrity of critical information.

Based on offering, the services segment recorded a higher CAGR in the Cloud Storage market during the forecast period.

Services are essential to the cloud storage market because they support customers before and after cloud storage solutions are deployed. Service providers help their customers with cloud storage solutions at several stages, including designing, implementing, maintaining, and upgrading. The significance of cloud storage services, including consultancy, integration and implementation, training, support, and maintenance, is explained in the upcoming chapter.

North America will hold the largest market share in the cloud storage market during the forecast period.

Cloud Storage adoption in the North American region has gained considerable momentum, positioning the region as a leader in the field/market. According to experts, North America is expected to have the highest adoption rate of Cloud Storage solutions and associated services compared to other regions. This is due to the growing interest of American households in innovative technologies as well as the increasing investment of North American companies in advanced technologies such as commercial and industrial IoT, 5G, cloud computing, and AI. The advanced technology incorporated/run Cloud Storage solutions are used across companies to reduce latency, handle network traffic, and lower operational expenses.

North America leads the rest in terms of cloud storage market share. The US and Canada are the two leading North American nations influencing the expansion of cloud storage acceptance and usage. A study found that over 55% of businesses have implemented cloud solutions, and over 91% offer at least one cloud-based service. Decreased capital expenditure, simplified IT administration, enhanced flexibility, and safety are among the primary motivators propelling cloud computing expansion in North America, boosting cloud storage solutions' uptake and expansion pace. Major market participants, such as AWS, IBM, Dell, HPE, and Microsoft, are US-based.

North American Cloud Storage Market Size, and Share

Key Market Players

The Cloud Storage market is dominated both by established companies as well as startups such as AWS (US), IBM (US), Google (US), Microsoft (US), Alibaba Cloud (China), Oracle (US), Dell Technologies (US), HPE (US), Huawei (China),. These vendors have a large customer base, a strong geographic footprint, and organized distribution channels. They incorporate organic and inorganic growth strategies, including product launches, deals, and business expansions, boosting revenue generation.

The study includes an in-depth competitive analysis of these key players in the Cloud Storage market with their company profiles, recent developments, and key market strategies.

Get online access to the report on the World's First Market Intelligence Cloud

  • Easy to Download Historical Data & Forecast Numbers
  • Company Analysis Dashboard for high growth potential opportunities
  • Research Analyst Access for customization & queries
  • Competitor Analysis with Interactive dashboard
  • Latest News, Updates & Trend analysis
Request Sample

Scope of the Report

Report Metrics

Details

Market size available for years

2018-2028

Base year considered

2023

Forecast period

2023–2028

Forecast units

Value (USD Million)

Segments Covered

Offering, Use Case, Deployment Model, Organization Size, and Vertical

Regions covered

North America, Europe, Asia Pacific, Middle East & Africa, and Latin America

Companies covered

AWS (US), IBM (US), Google (US), Microsoft (US), Oracle (US), Alibaba Cloud (China), Huawei Cloud (China), Rackspace technology (US), HPE (US), MinIO (US), UpCloud (Finland), pCloud (Switzerland), Sync (Canada), Zadara (US), box (US), Dropbox (US), Tencent Cloud (China), Fujitsu (Japan), NetApp (US), VMware (US), Scality (US), Citrix (US), DigitalOcean (US), Vultr, Wasabi

This research report categorizes the Cloud Storage market to forecast revenue and analyze trends in each of the following submarkets:

Based on Offering:
  • Storage type
    • Block storage
    • Object storage
    • File storage
  • Services
    • Training and Consulting
    • Integration and implementation
    • Support and maintenance
Based on Deployment model:
  • Public cloud
  • Private cloud
  • Hybrid cloud
Based on Organization Size:
  • Large Enterprises
  • SMEs
Based on Vertical:
  • BFSI
  • Telecommunications
  • IT & ITeS
  • Government & Public sector
  • Energy & Utilities
  • Manufacturing
  • Retail & Consumer goods
  • Media & Entertainment
  • Healthcare & Life sciences
  • Education
  • Other Verticals (transportation)
Based on Region:
  • North America
    • US
    • Canada
  • Europe
    • UK
    • Germany
    • France
    • Italy
    • Rest of Europe
  • Asia Pacific
    • China
    • Japan
    • Australia
    • Rest of Asia Pacific
  • Middle East & Africa
    • Saudi Arabia
    • UAE
    • South Africa
    • Rest of the Middle East & Africa
  • Latin America
    • Brazil
    • Mexico
    • Rest of Latin America     

Recent Developments

  • In September 2023, with the addition of a new feature, Amazon FSx for Windows File Server, Amazon (AWS) now enables its users to select and update the level of I/O operations per second (IOPS) separately from the storage capacity on the file system. Earlier, the IOPS performance level for accessing data on a user's file Solid State Drive (SSD) storage disks was fixed at a ratio of 3 IOPS per Gigabyte (GB) of storage capacity. Now, customers can configure SSD IOPS independently from storage capacity up to a ratio of 500 IOPS per GB.
  • In September 2023, an MoU signed between Alibaba Cloud and Astra Tech will leverage Alibaba Cloud's Enterprise Mobile Application Studio (EMAS) mobile testing solution into Botim (which is underway to become an ultra-app) to enhance users' experience through unparalleled app performance, reliability, and seamless functionality. Botim is the Middle East & North Africa's leading communications platform.
  • The partnership between both entities where Botim has leveraged Alibaba Cloud's products and services, including Elastic Compute Service (ECS), storage, networking, and database services.
  • In August 2023, Google Cloud announced a private preview of a parallel file system named Parallelstore that helps users avoid/negate wasting precious GPU resources while parallelly waiting for storage I/O (Input/Output) by providing a high-performing parallel file storage solution for AI/ML and HPC (High-Performance Computing) workloads. The solution is based on the next-generation Intel Distributed Asynchronous Object Storage (DAOS) architecture.
  • In March 2023, the collaboration between IBM and Wasabi aimed to enable enterprises to run applications across any environment, be it on-premises, in the cloud, or at the edge, while allowing users to access and utilize critical business data and analytics in real-time with cost-effectiveness. The Boston Red Sox will be the first to leverage the joint power (collaboration) of IBM Cloud Satellite® and Wasabi hot cloud storage, designed to improve the club's operations across its entire business unit.

Frequently Asked Questions (FAQ):

To speak to our analyst for a discussion on the above findings, click Speak to Analyst

TABLE OF CONTENTS
 
1 INTRODUCTION (Page No. - 43)
    1.1 STUDY OBJECTIVES 
    1.2 MARKET DEFINITION 
           1.2.1 INCLUSIONS AND EXCLUSIONS
    1.3 MARKET SCOPE 
           1.3.1 MARKET SEGMENTATION
           1.3.2 REGIONS COVERED
           1.3.3 YEARS CONSIDERED
    1.4 CURRENCY CONSIDERED 
           TABLE 1 USD EXCHANGE RATES, 2018–2022
    1.5 STAKEHOLDERS 
    1.6 SUMMARY OF CHANGES 
           1.6.1 RECESSION IMPACT
 
2 RESEARCH METHODOLOGY (Page No. - 49)
    2.1 RESEARCH DATA 
           FIGURE 1 RESEARCH DESIGN
           2.1.1 SECONDARY DATA
                    2.1.1.1 Secondary sources
           2.1.2 PRIMARY DATA
                    2.1.2.1 Breakdown of primary interviews
                    2.1.2.2 Key industry insights
    2.2 MARKET FORECAST 
           TABLE 2 FACTOR ANALYSIS
    2.3 MARKET SIZE ESTIMATION 
           FIGURE 2 TOP-DOWN AND BOTTOM-UP APPROACHES
           2.3.1 TOP-DOWN APPROACH
                    FIGURE 3 TOP-DOWN APPROACH: REVENUE OF VENDORS OFFERING CLOUD STORAGE SOLUTIONS AND SERVICES
           2.3.2 BOTTOM-UP APPROACH
                    FIGURE 4 BOTTOM-UP APPROACH: REVENUE OF VENDORS FROM VERTICALS
                    FIGURE 5 BOTTOM-UP APPROACH (SUPPLY-SIDE): COLLECTIVE REVENUE OF CLOUD STORAGE VENDORS
                    FIGURE 6 MARKET SIZE ESTIMATION METHODOLOGY: CAGR PROJECTIONS FROM SUPPLY SIDE
    2.4 DATA TRIANGULATION 
    2.5 RESEARCH ASSUMPTIONS 
           TABLE 3 RESEARCH ASSUMPTIONS
    2.6 IMPACT OF RECESSION ON GLOBAL CLOUD STORAGE MARKET 
    2.7 RESEARCH LIMITATIONS 
 
3 EXECUTIVE SUMMARY (Page No. - 61)
    3.1 OVERVIEW OF RECESSION IMPACT 
           FIGURE 7 CLOUD STORAGE MARKET: RECESSION IMPACT
           FIGURE 8 TOP-GROWING SEGMENTS IN MARKET
           FIGURE 9 MARKET: REGIONAL SNAPSHOT
 
4 PREMIUM INSIGHTS (Page No. - 66)
    4.1 ATTRACTIVE GROWTH OPPORTUNITIES IN CLOUD STORAGE MARKET 
           FIGURE 10 FOCUS ON IMPROVING CUSTOMER EXPERIENCE AND SIMPLIFYING ENTERPRISE CLOUD STORAGE TO DRIVE ADOPTION OF MARKET
    4.2 MARKET, BY OFFERING, 2023 VS. 2028 
           FIGURE 11 STORAGE TYPE SEGMENT TO ACCOUNT FOR LARGEST MARKET SHARE DURING FORECAST PERIOD
    4.3 MARKET, BY STORAGE TYPE, 2023 VS. 2028 
           FIGURE 12 FILE STORAGE SEGMENT TO HOLD LARGEST MARKET SHARE DURING FORECAST PERIOD
    4.4 MARKET, BY DEPLOYMENT MODEL,  2023 VS. 2028 
           FIGURE 13 PUBLIC CLOUD SEGMENT TO HOLD LARGEST SHARE DURING FORECAST PERIOD
    4.5 MARKET, BY ORGANIZATION SIZE,  2023 VS. 2028 
           FIGURE 14 LARGE ENTERPRISES SEGMENT TO HOLD LARGER SHARE DURING FORECAST PERIOD
    4.6 MARKET, BY APPLICATION, 2023 VS. 2028 
           FIGURE 15 BACKUP & RECOVERY SEGMENT TO HOLD LARGEST SHARE DURING FORECAST PERIOD
    4.7 MARKET, BY VERTICAL, 2023 VS. 2028 
           FIGURE 16 BFSI SEGMENT TO HOLD LARGEST SHARE DURING FORECAST PERIOD
    4.8 MARKET: REGIONAL SCENARIO, 2023–2028 
           FIGURE 17 ASIA PACIFIC TO EMERGE AS BEST MARKET FOR INVESTMENTS IN  NEXT FIVE YEARS
 
5 MARKET OVERVIEW AND INDUSTRY TRENDS (Page No. - 70)
    5.1 INTRODUCTION 
    5.2 MARKET DYNAMICS 
           FIGURE 18 CLOUD STORAGE MARKET: DRIVERS, RESTRAINTS, OPPORTUNITIES,  AND CHALLENGES
           5.2.1 DRIVERS
                    5.2.1.1 Increasing trend of green IT worldwide
                    5.2.1.2 Surge in data generation
                               FIGURE 19 CLOUD STORAGE SOLUTION USERS, BY STORED FILE TYPE
                    5.2.1.3 Growing need for remote access to data
                               FIGURE 20 MOST USED CLOUD STORAGE SERVICES, 2020
                    5.2.1.4 On-demand availability and low cost of cloud storage
           5.2.2 RESTRAINTS
                    5.2.2.1 Lifetime storage and egress costs of public cloud environments
                    5.2.2.2 Latency and network outage issues
                    5.2.2.3 Growth of metadata
           5.2.3 OPPORTUNITIES
                    5.2.3.1 Rising adoption of hybrid cloud
                    5.2.3.2 Growing focus on edge computing
                    5.2.3.3 Emergence of storage area network architecture
                    5.2.3.4 Integration of artificial intelligence in cloud storage solutions
                    5.2.3.5 Incorporation of containerization technology in cloud storage solutions
           5.2.4 CHALLENGES
                    5.2.4.1 Data privacy issues, security concerns, and threat of ransomware
    5.3 CASE STUDY ANALYSIS 
           5.3.1 NIO PRIVATE CLOUD STORAGE FOR IMPROVED SECURITY
           5.3.2 IBM TO AID AUTOMATION OPERATIONS IN COFFEE COUNTY
           5.3.3 TIMELY MAINTENANCE AND DELIVERY OF DATA REPORTS USING GOOGLE CLOUD STORAGE
           5.3.4 AMAZON S3 DEPLOYED TO REDUCE MAINTENANCE COST
           5.3.5 SCALITY RING UTILIZED TO ADD AND STREAM CONTENT
    5.4 ECOSYSTEM ANALYSIS 
           FIGURE 21 ECOSYSTEM MAPPING
    5.5 SUPPLY CHAIN ANALYSIS 
           5.5.1 SOFTWARE/SOLUTION PROVIDERS
           5.5.2 SERVICE PROVIDERS
           5.5.3 SYSTEM INTEGRATORS
           5.5.4 DISTRIBUTORS
           5.5.5 END USERS
                    FIGURE 22 SUPPLY CHAIN ANALYSIS
    5.6 TECHNOLOGY ANALYSIS 
           5.6.1 KEY TECHNOLOGIES
                    5.6.1.1 Data encryption
                    5.6.1.2 Object storage
                    5.6.1.3 Content Delivery Networks (CDNs)
           5.6.2 COMPLEMENTARY TECHNOLOGIES
                    5.6.2.1 Data synchronization
                    5.6.2.2 Storage virtualization
                    5.6.2.3 Cloud migration
           5.6.3 ADJACENT TECHNOLOGIES
                    5.6.3.1 Blockchain
                    5.6.3.2 Artificial Intelligence/Machine Learning
                    5.6.3.3 5G Technology
    5.7 PRICING ANALYSIS 
           5.7.1 INDICATIVE PRICING ANALYSIS
                    TABLE 4 INDICATIVE PRICING ANALYSIS OF CLOUD STORAGE MARKET SOLUTIONS, BY KEY PLAYER
    5.8 BUSINESS MODEL ANALYSIS 
           5.8.1 SUBSCRIPTION-BASED MODELS
           5.8.2 CONSULTING AND IMPLEMENTATION SERVICES
           5.8.3 CLOUD-BASED AND USAGE-BASED PRICING
           5.8.4 PARTNERSHIPS AND ECOSYSTEMS
           5.8.5 CUSTOMER RETENTION AND UPSELLING
    5.9 PATENT ANALYSIS 
           FIGURE 23 NUMBER OF PATENTS PUBLISHED, 2012–2023
           FIGURE 24 TOP FIVE PATENT OWNERS (GLOBAL), 2023
           TABLE 5 TOP TEN PATENT OWNERS, 2023
           TABLE 6 PATENT ANALYSIS, 2021–2023
    5.10 PORTER'S FIVE FORCES ANALYSIS 
           FIGURE 25 PORTER'S FIVE FORCES ANALYSIS
           TABLE 7 IMPACT OF PORTER'S FIVE FORCES
           5.10.1 THREAT OF NEW ENTRANTS
           5.10.2 THREAT OF SUBSTITUTES
           5.10.3 BARGAINING POWER OF SUPPLIERS
           5.10.4 BARGAINING POWER OF BUYERS
           5.10.5 INTENSITY OF COMPETITIVE RIVALRY
           5.10.6 REGULATORY LANDSCAPE
                    TABLE 8 NORTH AMERICA: REGULATORY BODIES, GOVERNMENT AGENCIES, AND OTHER ORGANIZATIONS
                    TABLE 9 EUROPE: REGULATORY BODIES, GOVERNMENT AGENCIES, AND OTHER ORGANIZATIONS
                    TABLE 10 ASIA PACIFIC: REGULATORY BODIES, GOVERNMENT AGENCIES, AND OTHER ORGANIZATIONS
                    TABLE 11 REST OF THE WORLD: REGULATORY BODIES, GOVERNMENT AGENCIES, AND  OTHER ORGANIZATIONS
    5.11 KEY CONFERENCES AND EVENTS 
                    TABLE 12 KEY CONFERENCES AND EVENTS, 2024
    5.12 TRENDS AND DISRUPTIONS IMPACTING CUSTOMERS’ BUSINESSES 
                    FIGURE 26 REVENUE SHIFT AND NEW REVENUE POCKETS FOR PLAYERS IN CLOUD STORAGE MARKET
    5.13 KEY STAKEHOLDERS AND BUYING CRITERIA 
           5.13.1 KEY STAKEHOLDERS IN BUYING PROCESS
                    FIGURE 27 INFLUENCE OF STAKEHOLDERS ON BUYING PROCESS FOR TOP THREE VERTICALS
                    TABLE 13 INFLUENCE OF STAKEHOLDERS ON BUYING PROCESS FOR TOP THREE VERTICALS (%)
           5.13.2 BUYING CRITERIA
                    FIGURE 28 KEY BUYING CRITERIA FOR TOP THREE VERTICALS
                    TABLE 14 KEY BUYING CRITERIA FOR TOP THREE VERTICALS
 
6 CLOUD STORAGE MARKET, BY OFFERING (Page No. - 100)
    6.1 INTRODUCTION 
           6.1.1 OFFERING: MARKET DRIVERS
                    FIGURE 29 STORAGE TYPE ACCOUNTED FOR LARGER MARKET SIZE IN 2023
                    TABLE 15 MARKET, BY OFFERING, 2019–2022 (USD MILLION)
                    TABLE 16 MARKET, BY OFFERING, 2023–2028 (USD MILLION)
    6.2 STORAGE TYPE 
           FIGURE 30 FILE STORAGE DOMINATED MARKET IN 2023
           TABLE 17 MARKET, BY STORAGE TYPE, 2019–2022 (USD MILLION)
           TABLE 18 MARKET, BY STORAGE TYPE, 2023–2028 (USD MILLION)
           TABLE 19 STORAGE TYPE: MARKET, BY REGION, 2019–2022 (USD MILLION)
           TABLE 20 STORAGE TYPE: MARKET, BY REGION, 2023–2028 (USD MILLION)
           6.2.1 OBJECT STORAGE
                    6.2.1.1 Object storage systems to be highly scalable and can quickly grow to accommodate increasing data volumes
                               TABLE 21 OBJECT STORAGE: MARKET, BY REGION, 2019–2022 (USD MILLION)
                               TABLE 22 OBJECT STORAGE: CLOUD STORAGE MARKET, BY REGION, 2023–2028 (USD MILLION)
                    6.2.1.2 S3-compatible object storage
                    6.2.1.3 Swift-compatible object storage
           6.2.2 BLOCK STORAGE
                    6.2.2.1 Increasing demand for high-performance storage solutions to be fulfilled by block storage
                               TABLE 23 BLOCK STORAGE: MARKET, BY REGION, 2019–2022 (USD MILLION)
                               TABLE 24 BLOCK STORAGE: MARKET, BY REGION, 2023–2028 (USD MILLION)
                    6.2.2.2 SSD block storage
                    6.2.2.3 HDD block storage
           6.2.3 FILE STORAGE
                    6.2.3.1 File storage to provide flexibility to scale storage resources on-demand
                               TABLE 25 FILE STORAGE: MARKET, BY REGION, 2019–2022 (USD MILLION)
                               TABLE 26 FILE STORAGE: MARKET, BY REGION, 2023–2028 (USD MILLION)
                    6.2.3.2 NFS-based file storage
                    6.2.3.3 SMB-based file storage
    6.3 SERVICES 
           TABLE 27 SERVICES: CLOUD STORAGE MARKET, BY REGION, 2019–2022 (USD MILLION)
           TABLE 28 SERVICES: MARKET, BY REGION, 2023–2028 (USD MILLION)
           6.3.1 TRAINING & CONSULTING
                    6.3.1.1 Training & consulting to help implement access controls and ensure compliance with data protection regulations
           6.3.2 INTEGRATION & IMPLEMENTATION
                    6.3.2.1 Cloud storage solutions to ensure data persistence and scalability for containerized applications
           6.3.3 SUPPORT & MAINTENANCE
                    6.3.3.1 Support services to focus on securing data, implementing encryption access controls, and ensuring compliance
 
7 CLOUD STORAGE MARKET, BY APPLICATION (Page No. - 109)
    7.1 INTRODUCTION 
           7.1.1 APPLICATION: MARKET DRIVERS
                    FIGURE 31 BACKUP & RECOVERY DOMINATED MARKET IN 2023
                    TABLE 29 MARKET, BY APPLICATION, 2019–2022 (USD MILLION)
                    TABLE 30 MARKET, BY APPLICATION, 2023–2028 (USD MILLION)
    7.2 BUSINESS CONTINUITY 
           7.2.1 BACKUP & RECOVERY
                    7.2.1.1 Enabling faster and more efficient data recovery strategies based on historical patterns and real-time insights
                               TABLE 31 BACKUP & RECOVERY: MARKET, BY REGION,  2019–2022 (USD MILLION)
                               TABLE 32 BACKUP & RECOVERY: MARKET, BY REGION,  2023–2028 (USD MILLION)
           7.2.2 DATA ARCHIVING
                    7.2.2.1 Providing scalable and persistent storage solutions for serverless computing platforms
                               TABLE 33 DATA ARCHIVING: MARKET, BY REGION, 2019–2022 (USD MILLION)
                               TABLE 34 DATA ARCHIVING: MARKET, BY REGION, 2023–2028 (USD MILLION)
    7.3 DATA MANAGEMENT 
           7.3.1 BIG DATA & ANALYTICS
                    7.3.1.1 Cloud storage solutions to include tools and services for data integration and transformation
                               TABLE 35 BIG DATA & ANALYTICS: CLOUD STORAGE MARKET, BY REGION,  2019–2022 (USD MILLION)
                               TABLE 36 BIG DATA & ANALYTICS: MARKET, BY REGION,  2023–2028 (USD MILLION)
           7.3.2 DATABASE STORAGE MANAGEMENT
                    7.3.2.1 Integration of cloud storage solutions with Kubernetes for dynamic provisioning and orchestration of storage resources
                               TABLE 37 DATABASE STORAGE MANAGEMENT: MARKET, BY REGION,  2019–2022 (USD MILLION)
                               TABLE 38 DATABASE STORAGE MANAGEMENT: MARKET, BY REGION,  2023–2028 (USD MILLION)
    7.4 APPLICATION MANAGEMENT 
           7.4.1 CONTENT DELIVERY & DISTRIBUTION
                    7.4.1.1 AI-driven automation to optimize storage resource allocation and management
                               TABLE 39 CONTENT DELIVERY & DISTRIBUTION: MARKET, BY REGION,  2019–2022 (USD MILLION)
                               TABLE 40 CONTENT DELIVERY & DISTRIBUTION: MARKET, BY REGION,  2023–2028 (USD MILLION)
           7.4.2 OTHER APPLICATIONS
                    TABLE 41 OTHER APPLICATIONS: MARKET, BY REGION,  2019–2022 (USD MILLION)
                    TABLE 42 OTHER APPLICATIONS: MARKET, BY REGION,  2023–2028 (USD MILLION)
 
8 CLOUD STORAGE MARKET, BY ORGANIZATION SIZE (Page No. - 118)
    8.1 INTRODUCTION 
           8.1.1 ORGANIZATION SIZE: MARKET DRIVERS
                    FIGURE 32 LARGE ENTERPRISES DOMINATED MARKET IN 2023
                    TABLE 43 MARKET, BY ORGANIZATION SIZE, 2019–2022 (USD MILLION)
                    TABLE 44 MARKET, BY ORGANIZATION SIZE, 2023–2028 (USD MILLION)
    8.2 SMALL & MEDIUM-SIZED ENTERPRISES 
           8.2.1 SMES TO EMBRACE CLOUD STORAGE FOR COMPETITIVE EDGE
                    TABLE 45 SMES: MARKET, BY REGION, 2019–2022 (USD MILLION)
                    TABLE 46 SMES: MARKET, BY REGION, 2023–2028 (USD MILLION)
    8.3 LARGE ENTERPRISES 
           8.3.1 LARGE ENTERPRISES TO HARNESS CLOUD STORAGE TO ACHIEVE AGILITY AT SCALE
                    TABLE 47 LARGE ENTERPRISES: MARKET, BY REGION,  2019–2022 (USD MILLION)
                    TABLE 48 LARGE ENTERPRISES: MARKET, BY REGION,  2023–2028 (USD MILLION)
 
9 CLOUD STORAGE MARKET, BY DEPLOYMENT MODEL (Page No. - 122)
    9.1 INTRODUCTION 
           9.1.1 DEPLOYMENT MODEL: MARKET DRIVERS
                    FIGURE 33 PUBLIC CLOUD SEGMENT DOMINATED MARKET IN 2023
                    TABLE 49 MARKET, BY DEPLOYMENT MODEL, 2019–2022 (USD MILLION)
                    TABLE 50 MARKET, BY DEPLOYMENT MODEL, 2023–2028 (USD MILLION)
    9.2 PUBLIC CLOUD 
           9.2.1 PUBLIC CLOUD STORAGE TO EMPOWER AGILE ENTERPRISES BY ELEVATING EFFICIENCY
                    TABLE 51 PUBLIC CLOUD: MARKET, BY REGION, 2019–2022 (USD MILLION)
                    TABLE 52 PUBLIC CLOUD: MARKET, BY REGION, 2023–2028 (USD MILLION)
    9.3 PRIVATE CLOUD 
           9.3.1 PRIVATE CLOUD STORAGE TO PROVIDE CUSTOMIZED CONTROL TAILORED TO ENTERPRISE NEEDS
                    TABLE 53 PRIVATE CLOUD: MARKET, BY REGION, 2019–2022 (USD MILLION)
                    TABLE 54 PRIVATE CLOUD: MARKET, BY REGION, 2023–2028 (USD MILLION)
    9.4 HYBRID CLOUD 
           9.4.1 HYBRID CLOUD STORAGE SOLUTIONS TO HELP DRIVE FLEXIBILITY
                    TABLE 55 HYBRID CLOUD: MARKET, BY REGION, 2019–2022 (USD MILLION)
                    TABLE 56 HYBRID CLOUD: MARKET, BY REGION, 2023–2028 (USD MILLION)
 
10 CLOUD STORAGE MARKET, BY VERTICAL (Page No. - 127)
     10.1 INTRODUCTION 
             10.1.1 VERTICAL: MARKET DRIVERS
                       FIGURE 34 BFSI VERTICAL TO ACCOUNT FOR LARGEST MARKET SIZE DURING FORECAST PERIOD
                       TABLE 57 MARKET, BY VERTICAL, 2019–2022 (USD MILLION)
                       TABLE 58 MARKET, BY VERTICAL, 2023–2028 (USD MILLION)
     10.2 BANKING, FINANCIAL SERVICES, AND INSURANCE 
             10.2.1 CLOUD STORAGE TO ALLOW BFSI ORGANIZATIONS TO SCALE THEIR STORAGE RESOURCES SEAMLESSLY
                       TABLE 59 BFSI: MARKET, BY REGION, 2019–2022 (USD MILLION)
                       TABLE 60 BFSI: CLOUD STORAGE MARKET, BY REGION, 2023–2028 (USD MILLION)
             10.2.2 BFSI: APPLICATION AREAS
                       10.2.2.1 Fraud Detection & Risk Management
                       10.2.2.2 Global Expansion & Compliance
                       10.2.2.3 Customer Personalization
                       10.2.2.4 Other Application Areas
     10.3 IT & ITES 
             10.3.1 RISE OF SERVERLESS COMPUTING MODELS TO DRIVE DEVELOPMENT OF STORAGE SOLUTIONS
                       TABLE 61 IT & ITES: MARKET, BY REGION, 2019–2022 (USD MILLION)
                       TABLE 62 IT & ITES: MARKET, BY REGION, 2023–2028 (USD MILLION)
             10.3.2 IT & ITES: APPLICATION AREAS
                       10.3.2.1 Scalable Development Environments
                       10.3.2.2 Global Collaboration
                       10.3.2.3 Automated Testing & Continuous Integration
                       10.3.2.4 Other Application Areas
     10.4 TELECOMMUNICATIONS 
             10.4.1 ENABLING DATA MOBILITY AND REDUNDANCY ACROSS CLOUD PROVIDERS
                       TABLE 63 TELECOMMUNICATIONS: MARKET, BY REGION,  2019–2022 (USD MILLION)
                       TABLE 64 TELECOMMUNICATIONS: MARKET, BY REGION,  2023–2028 (USD MILLION)
             10.4.2 TELECOMMUNICATIONS: APPLICATION AREAS
                       10.4.2.1 Network Function Virtualization (NFV)
                       10.4.2.2 Edge Computing
                       10.4.2.3 IoT Data Management
                       10.4.2.4 Other Application Areas
     10.5 HEALTHCARE & LIFE SCIENCES 
             10.5.1 VERTICAL TO EMBRACE HYBRID AND MULTI-CLOUD STRATEGIES TO OPTIMIZE STORAGE COSTS
                       TABLE 65 HEALTHCARE & LIFE SCIENCES: CLOUD STORAGE MARKET, BY REGION,  2019–2022 (USD MILLION)
                       TABLE 66 HEALTHCARE & LIFE SCIENCES: MARKET, BY REGION,  2023–2028 (USD MILLION)
             10.5.2 HEALTHCARE & LIFE SCIENCES: APPLICATION AREAS
                       10.5.2.1 Secure Health Data Sharing
                       10.5.2.2 Telemedicine & Remote Patient Monitoring
                       10.5.2.3 Interoperability & Health Information Exchange
                       10.5.2.4 Other Application Areas
     10.6 MEDIA & ENTERTAINMENT 
             10.6.1 CLOUD STORAGE TO ENABLE MEDIA CONTENT DELIVERY AND PROCESSING CLOSER TO END USERS, REDUCING LATENCY, AND ENHANCING USER EXPERIENCES
                       TABLE 67 MEDIA & ENTERTAINMENT: MARKET, BY REGION,  2019–2022 (USD MILLION)
                       TABLE 68 MEDIA & ENTERTAINMENT: MARKET, BY REGION,  2023–2028 (USD MILLION)
             10.6.2 MEDIA & ENTERTAINMENT: APPLICATION AREAS
                       10.6.2.1 Scalable Content Distribution
                       10.6.2.2 Collaborative Content Creation
                       10.6.2.3 Flexible Digital Asset Management
                       10.6.2.4 Other Application Areas
     10.7 RETAIL & CONSUMER GOODS 
             10.7.1 CLOUD STORAGE SOLUTIONS ADAPT TO FLUCTUATING RETAIL DEMAND
                       TABLE 69 RETAIL & CONSUMER GOODS: MARKET, BY REGION,  2019–2022 (USD MILLION)
                       TABLE 70 RETAIL & CONSUMER GOODS: MARKET, BY REGION,  2023–2028 (USD MILLION)
             10.7.2 RETAIL & CONSUMER GOODS: APPLICATION AREAS
                       10.7.2.1 Personalized Customer Experiences
                       10.7.2.2 Inventory Optimization
                       10.7.2.3 Unified Commerce
                       10.7.2.4 Other Application Areas
     10.8 MANUFACTURING 
             10.8.1 ADVANCED ANALYTICS AND AI-DRIVEN INSIGHTS BECOMING INTEGRAL TO CLOUD STORAGE
                       TABLE 71 MANUFACTURING: CLOUD STORAGE MARKET, BY REGION,  2019–2022 (USD MILLION)
                       TABLE 72 MANUFACTURING: MARKET, BY REGION, 2023–2028 (USD MILLION)
             10.8.2 MANUFACTURING: APPLICATION AREAS
                       10.8.2.1 Digital Twin
                       10.8.2.2 3D Printing
                       10.8.2.3 Quality Control & Process Optimization
                       10.8.2.4 Other Application Areas
     10.9 GOVERNMENT & PUBLIC SECTOR 
             10.9.1 GOVERNMENT & PUBLIC SECTOR TO DRIVE ADOPTION OF CLOUD STORAGE SOLUTIONS THAT OFFER ROBUST DATA GOVERNANCE AND COMPLIANCE FEATURES
                       TABLE 73 GOVERNMENT & PUBLIC SECTOR: MARKET, BY REGION,  2019–2022 (USD MILLION)
                       TABLE 74 GOVERNMENT & PUBLIC SECTOR: MARKET, BY REGION,  2023–2028 (USD MILLION)
             10.9.2 GOVERNMENT & PUBLIC SECTOR: APPLICATION AREAS
                       10.9.2.1 E-government Services
                       10.9.2.2 Smart City Initiatives
                       10.9.2.3 Emergency Response & Crisis Management
                       10.9.2.4 Other Application Areas
     10.10 ENERGY & UTILITIES 
               10.10.1 CLOUD STORAGE TO SCALE AND MANAGE DATA GENERATED FROM RENEWABLE ENERGY SOURCES LIKE SOLAR AND WIND FARMS EFFICIENTLY
                                   TABLE 75 ENERGY & UTILITIES: MARKET, BY REGION,  2019–2022 (USD MILLION)
                                   TABLE 76 ENERGY & UTILITIES: MARKET, BY REGION,  2023–2028 (USD MILLION)
               10.10.2 ENERGY & UTILITIES: APPLICATION AREAS
            10.10.2.1 Grid Optimization with Big Data
            10.10.2.2 Asset Performance Management
            10.10.2.3 Energy Consumption Analytics
            10.10.2.4 Other Application Areas
     10.11 OTHER VERTICALS 
                       TABLE 77 OTHER VERTICALS: MARKET, BY REGION, 2019–2022 (USD MILLION)
                       TABLE 78 OTHER VERTICALS: MARKET, BY REGION, 2023–2028 (USD MILLION)
 
11 CLOUD STORAGE MARKET, BY REGION (Page No. - 151)
     11.1 INTRODUCTION 
               FIGURE 35 ASIA PACIFIC TO GROW AT HIGHEST CAGR DURING FORECAST PERIOD
               TABLE 79 MARKET, BY REGION, 2019–2022 (USD MILLION)
               TABLE 80 MARKET, BY REGION, 2023–2028 (USD MILLION)
     11.2 NORTH AMERICA 
             11.2.1 NORTH AMERICA: MARKET DRIVERS
             11.2.2 NORTH AMERICA: RECESSION IMPACT
                       FIGURE 36 NORTH AMERICA: CLOUD STORAGE MARKET SNAPSHOT
                       TABLE 81 NORTH AMERICA: MARKET, BY OFFERING, 2019–2022 (USD MILLION)
                       TABLE 82 NORTH AMERICA: MARKET, BY OFFERING, 2023–2028 (USD MILLION)
                       TABLE 83 NORTH AMERICA: MARKET, BY STORAGE TYPE,  2019–2022 (USD MILLION)
                       TABLE 84 NORTH AMERICA: MARKET, BY STORAGE TYPE,  2023–2028 (USD MILLION)
                       TABLE 85 NORTH AMERICA: MARKET, BY DEPLOYMENT MODEL,  2019–2022 (USD MILLION)
                       TABLE 86 NORTH AMERICA: MARKET, BY DEPLOYMENT MODEL,  2023–2028 (USD MILLION)
                       TABLE 87 NORTH AMERICA: MARKET, BY ORGANIZATION SIZE,  2019–2022 (USD MILLION)
                       TABLE 88 NORTH AMERICA: MARKET, BY ORGANIZATION SIZE,  2023–2028 (USD MILLION)
                       TABLE 89 NORTH AMERICA: MARKET, BY APPLICATION,  2019–2022 (USD MILLION)
                       TABLE 90 NORTH AMERICA: MARKET, BY APPLICATION,  2023–2028 (USD MILLION)
                       TABLE 91 NORTH AMERICA: MARKET, BY VERTICAL, 2019–2022 (USD MILLION)
                       TABLE 92 NORTH AMERICA: MARKET, BY VERTICAL, 2023–2028 (USD MILLION)
                       TABLE 93 NORTH AMERICA: MARKET, BY COUNTRY, 2019–2022 (USD MILLION)
                       TABLE 94 NORTH AMERICA: MARKET, BY COUNTRY, 2023–2028 (USD MILLION)
             11.2.3 US
                       11.2.3.1 Surge in demand for effective cloud storage implementation in US to drive market growth
                                   TABLE 95 US: MARKET, BY DEPLOYMENT MODEL, 2019–2022 (USD MILLION)
                                   TABLE 96 US: MARKET, BY DEPLOYMENT MODEL, 2023–2028 (USD MILLION)
                                   TABLE 97 US: MARKET, BY ORGANIZATION SIZE, 2019–2022 (USD MILLION)
                                   TABLE 98 US: MARKET, BY ORGANIZATION SIZE, 2023–2028 (USD MILLION)
             11.2.4 CANADA
                       11.2.4.1 Need for advanced technological tools, cloud platforms, and various other on-demand services to drive market growth in Canada
                                   TABLE 99 CANADA: MARKET, BY DEPLOYMENT MODEL,  2019–2022 (USD MILLION)
                                   TABLE 100 CANADA: MARKET, BY DEPLOYMENT MODEL,  2023–2028 (USD MILLION)
                                   TABLE 101 CANADA: MARKET, BY ORGANIZATION SIZE, 2019–2022 (USD MILLION)
                                   TABLE 102 CANADA: MARKET, BY ORGANIZATION SIZE, 2023–2028 (USD MILLION)
     11.3 EUROPE 
             11.3.1 EUROPE: MARKET DRIVERS
             11.3.2 EUROPE: RECESSION IMPACT
                       TABLE 103 EUROPE: CLOUD STORAGE MARKET, BY OFFERING, 2019–2022 (USD MILLION)
                       TABLE 104 EUROPE: MARKET, BY OFFERING, 2023–2028 (USD MILLION)
                       TABLE 105 EUROPE: MARKET, BY STORAGE TYPE, 2019–2022 (USD MILLION)
                       TABLE 106 EUROPE: MARKET, BY STORAGE TYPE, 2023–2028 (USD MILLION)
                       TABLE 107 EUROPE: MARKET, BY DEPLOYMENT MODEL,  2019–2022 (USD MILLION)
                       TABLE 108 EUROPE: MARKET, BY DEPLOYMENT MODEL,  2023–2028 (USD MILLION)
                       TABLE 109 EUROPE: MARKET, BY ORGANIZATION SIZE, 2019–2022 (USD MILLION)
                       TABLE 110 EUROPE: MARKET, BY ORGANIZATION SIZE, 2023–2028 (USD MILLION)
                       TABLE 111 EUROPE: MARKET, BY APPLICATION, 2019–2022 (USD MILLION)
                       TABLE 112 EUROPE: MARKET, BY APPLICATION, 2023–2028 (USD MILLION)
                       TABLE 113 EUROPE: MARKET, BY VERTICAL, 2019–2022 (USD MILLION)
                       TABLE 114 EUROPE: MARKET, BY VERTICAL, 2023–2028 (USD MILLION)
                       TABLE 115 EUROPE: MARKET, BY COUNTRY, 2019–2022 (USD MILLION)
                       TABLE 116 EUROPE: MARKET, BY COUNTRY, 2023–2028 (USD MILLION)
             11.3.3 UK
                       11.3.3.1 Companies in UK to adopt cloud storage solutions to enhance operational efficiency
                                   TABLE 117 UK: MARKET, BY DEPLOYMENT MODEL, 2019–2022 (USD MILLION)
                                   TABLE 118 UK: MARKET, BY DEPLOYMENT MODEL, 2023–2028 (USD MILLION)
                                   TABLE 119 UK: MARKET, BY ORGANIZATION SIZE, 2019–2022 (USD MILLION)
                                   TABLE 120 UK: MARKET, BY ORGANIZATION SIZE, 2023–2028 (USD MILLION)
             11.3.4 GERMANY
                       11.3.4.1 Adoption of cloud computing and cloud storage solutions at scale to drive market growth in Germany
                                   TABLE 121 GERMANY: CLOUD STORAGE MARKET, BY DEPLOYMENT MODEL,  2019–2022 (USD MILLION)
                                   TABLE 122 GERMANY: MARKET, BY DEPLOYMENT MODEL,  2023–2028 (USD MILLION)
                                   TABLE 123 GERMANY: MARKET, BY ORGANIZATION SIZE,  2019–2022 (USD MILLION)
                                   TABLE 124 GERMANY: MARKET, BY ORGANIZATION SIZE,  2023–2028 (USD MILLION)
             11.3.5 FRANCE
                       11.3.5.1 Huge investments by global MARKET providers because of changing customer behavior to drive growth in France
                                   TABLE 125 FRANCE: MARKET, BY DEPLOYMENT MODEL,  2019–2022 (USD MILLION)
                                   TABLE 126 FRANCE: MARKET, BY DEPLOYMENT MODEL,  2023–2028 (USD MILLION)
                                   TABLE 127 FRANCE: MARKET, BY ORGANIZATION SIZE, 2019–2022 (USD MILLION)
                                   TABLE 128 FRANCE: MARKET, BY ORGANIZATION SIZE, 2023–2028 (USD MILLION)
             11.3.6 ITALY
                       11.3.6.1 Cloud storage adoption in Italy to witness growth
                                   TABLE 129 ITALY: MARKET, BY DEPLOYMENT MODEL, 2019–2022 (USD MILLION)
                                   TABLE 130 ITALY: MARKET, BY DEPLOYMENT MODEL, 2023–2028 (USD MILLION)
                                   TABLE 131 ITALY: MARKET, BY ORGANIZATION SIZE, 2019–2022 (USD MILLION)
                                   TABLE 132 ITALY: MARKET, BY ORGANIZATION SIZE, 2023–2028 (USD MILLION)
             11.3.7 REST OF EUROPE
                       TABLE 133 REST OF EUROPE: MARKET, BY DEPLOYMENT MODEL,  2019–2022 (USD MILLION)
                       TABLE 134 REST OF EUROPE: MARKET, BY DEPLOYMENT MODEL,  2023–2028 (USD MILLION)
                       TABLE 135 REST OF EUROPE: MARKET, BY ORGANIZATION SIZE,  2019–2022 (USD MILLION)
                       TABLE 136 REST OF EUROPE: MARKET, BY ORGANIZATION SIZE,  2023–2028 (USD MILLION)
     11.4 ASIA PACIFIC 
             11.4.1 ASIA PACIFIC: MARKET DRIVERS
             11.4.2 ASIA PACIFIC: RECESSION IMPACT
                       FIGURE 37 ASIA PACIFIC: CLOUD STORAGE MARKET SNAPSHOT
                       TABLE 137 ASIA PACIFIC: MARKET, BY OFFERING, 2019–2022 (USD MILLION)
                       TABLE 138 ASIA PACIFIC: MARKET, BY OFFERING, 2023–2028 (USD MILLION)
                       TABLE 139 ASIA PACIFIC: MARKET, BY STORAGE TYPE, 2019–2022 (USD MILLION)
                       TABLE 140 ASIA PACIFIC: MARKET, BY STORAGE TYPE, 2023–2028 (USD MILLION)
                       TABLE 141 ASIA PACIFIC: MARKET, BY DEPLOYMENT MODEL,  2019–2022 (USD MILLION)
                       TABLE 142 ASIA PACIFIC: MARKET, BY DEPLOYMENT MODEL,  2023–2028 (USD MILLION)
                       TABLE 143 ASIA PACIFIC: MARKET, BY ORGANIZATION SIZE,  2019–2022 (USD MILLION)
                       TABLE 144 ASIA PACIFIC: MARKET, BY ORGANIZATION SIZE,  2023–2028 (USD MILLION)
                       TABLE 145 ASIA PACIFIC: MARKET, BY APPLICATION, 2019–2022 (USD MILLION)
                       TABLE 146 ASIA PACIFIC: MARKET, BY APPLICATION, 2023–2028 (USD MILLION)
                       TABLE 147 ASIA PACIFIC: MARKET, BY VERTICAL, 2019–2022 (USD MILLION)
                       TABLE 148 ASIA PACIFIC: MARKET, BY VERTICAL, 2023–2028 (USD MILLION)
                       TABLE 149 ASIA PACIFIC: MARKET, BY COUNTRY, 2019–2022 (USD MILLION)
                       TABLE 150 ASIA PACIFIC: MARKET, BY COUNTRY, 2023–2028 (USD MILLION)
             11.4.3 CHINA
                       11.4.3.1 Government organizations and telcos investing in Chinese IoT and innovative city ecosystems to drive market growth
                                   TABLE 151 CHINA: CLOUD STORAGE MARKET, BY DEPLOYMENT MODEL, 2019–2022 (USD MILLION)
                                   TABLE 152 CHINA: MARKET, BY DEPLOYMENT MODEL, 2023–2028 (USD MILLION)
                                   TABLE 153 CHINA: MARKET, BY ORGANIZATION SIZE, 2019–2022 (USD MILLION)
                                   TABLE 154 CHINA: MARKET, BY ORGANIZATION SIZE, 2023–2028 (USD MILLION)
             11.4.4 JAPAN
                       11.4.4.1 Technology providers in Japan to introduce cloud storage technologies
                                   TABLE 155 JAPAN: MARKET, BY DEPLOYMENT MODEL, 2019–2022 (USD MILLION)
                                   TABLE 156 JAPAN: MARKET, BY DEPLOYMENT MODEL, 2023–2028 (USD MILLION)
                                   TABLE 157 JAPAN: MARKET, BY ORGANIZATION SIZE, 2019–2022 (USD MILLION)
                                   TABLE 158 JAPAN: MARKET, BY ORGANIZATION SIZE, 2023–2028 (USD MILLION)
             11.4.5 AUSTRALIA & NEW ZEALAND
                       11.4.5.1 Demand for data processing and information interaction to drive growth of Australian MARKET
                                   TABLE 159 AUSTRALIA & NEW ZEALAND: MARKET, BY DEPLOYMENT MODEL, 2019–2022 (USD MILLION)
                                   TABLE 160 AUSTRALIA & NEW ZEALAND: MARKET, BY DEPLOYMENT MODEL, 2023–2028 (USD MILLION)
                                   TABLE 161 AUSTRALIA & NEW ZEALAND: MARKET, BY ORGANIZATION SIZE,  2019–2022 (USD MILLION)
                                   TABLE 162 AUSTRALIA & NEW ZEALAND: MARKET, BY ORGANIZATION SIZE,  2023–2028 (USD MILLION)
             11.4.6 REST OF ASIA PACIFIC
                       TABLE 163 REST OF ASIA PACIFIC: MARKET, BY DEPLOYMENT MODEL,  2019–2022 (USD MILLION)
                       TABLE 164 REST OF ASIA PACIFIC: MARKET, BY DEPLOYMENT MODEL,  2023–2028 (USD MILLION)
                       TABLE 165 REST OF ASIA PACIFIC: MARKET, BY ORGANIZATION SIZE,  2019–2022 (USD MILLION)
                       TABLE 166 REST OF ASIA PACIFIC: MARKET, BY ORGANIZATION SIZE,  2023–2028 (USD MILLION)
     11.5 MIDDLE EAST & AFRICA 
             11.5.1 MIDDLE EAST & AFRICA: MARKET DRIVERS
             11.5.2 MIDDLE EAST & AFRICA: RECESSION IMPACT
                       TABLE 167 MIDDLE EAST & AFRICA: CLOUD STORAGE MARKET, BY OFFERING,  2019–2022 (USD MILLION)
                       TABLE 168 MIDDLE EAST & AFRICA: MARKET, BY OFFERING,  2023–2028 (USD MILLION)
                       TABLE 169 MIDDLE EAST & AFRICA: MARKET, BY STORAGE TYPE,  2019–2022 (USD MILLION)
                       TABLE 170 MIDDLE EAST & AFRICA: MARKET, BY STORAGE TYPE,  2023–2028 (USD MILLION)
                       TABLE 171 MIDDLE EAST & AFRICA: MARKET, BY DEPLOYMENT MODEL,  2019–2022 (USD MILLION)
                       TABLE 172 MIDDLE EAST & AFRICA: MARKET, BY DEPLOYMENT MODEL,  2023–2028 (USD MILLION)
                       TABLE 173 MIDDLE EAST & AFRICA: MARKET, BY ORGANIZATION SIZE,  2019–2022 (USD MILLION)
                       TABLE 174 MIDDLE EAST & AFRICA: MARKET, BY ORGANIZATION SIZE,  2023–2028 (USD MILLION)
                       TABLE 175 MIDDLE EAST & AFRICA: MARKET, BY APPLICATION,  2019–2022 (USD MILLION)
                       TABLE 176 MIDDLE EAST & AFRICA: MARKET, BY APPLICATION,  2023–2028 (USD MILLION)
                       TABLE 177 MIDDLE EAST & AFRICA: MARKET, BY VERTICAL,  2019–2022 (USD MILLION)
                       TABLE 178 MIDDLE EAST & AFRICA: MARKET, BY VERTICAL,  2023–2028 (USD MILLION)
                       TABLE 179 MIDDLE EAST & AFRICA: MARKET, BY REGION/COUNTRY,  2019–2022 (USD MILLION)
                       TABLE 180 MIDDLE EAST & AFRICA: MARKET, BY REGION/COUNTRY,  2023–2028 (USD MILLION)
             11.5.3 GCC COUNTRIES
                       11.5.3.1 Saudi Arabia
                                   11.5.3.1.1 Saudi Vision 2030 initiatives to leverage demand for cloud computing, cloud storage, big data, analytics, and AI/ML
                                   TABLE 181 SAUDI ARABIA: MARKET, BY DEPLOYMENT MODEL,  2019–2022 (USD MILLION)
                                   TABLE 182 SAUDI ARABIA: MARKET, BY DEPLOYMENT MODEL,  2023–2028 (USD MILLION)
                                   TABLE 183 SAUDI ARABIA: MARKET, BY ORGANIZATION SIZE,  2019–2022 (USD MILLION)
                                   TABLE 184 SAUDI ARABIA: MARKET, BY ORGANIZATION SIZE,  2023–2028 (USD MILLION)
                       11.5.3.2 UAE
                                   11.5.3.2.1 High mobile device per user ratio to drive market for cloud storage
                                   TABLE 185 UAE: CLOUD STORAGE MARKET, BY DEPLOYMENT MODEL, 2019–2022 (USD MILLION)
                                   TABLE 186 UAE: MARKET, BY DEPLOYMENT MODEL, 2023–2028 (USD MILLION)
                                   TABLE 187 UAE: MARKET, BY ORGANIZATION SIZE, 2019–2022 (USD MILLION)
                                   TABLE 188 UAE: MARKET, BY ORGANIZATION SIZE, 2023–2028 (USD MILLION)
                       11.5.3.3 Other GCC Countries
                                   TABLE 189 OTHER GCC COUNTRIES: MARKET, BY DEPLOYMENT MODEL,  2019–2022 (USD MILLION)
                                   TABLE 190 OTHER GCC COUNTRIES: MARKET, BY DEPLOYMENT MODEL,  2023–2028 (USD MILLION)
                                   TABLE 191 OTHER GCC COUNTRIES: MARKET, BY ORGANIZATION SIZE,  2019–2022 (USD MILLION)
                                   TABLE 192 OTHER GCC COUNTRIES: MARKET, BY ORGANIZATION SIZE,  2023–2028 (USD MILLION)
             11.5.4 SOUTH AFRICA
                       11.5.4.1 High usage of mobile technologies and colocation facilities to contribute to market growth in South Africa
                                   TABLE 193 SOUTH AFRICA: MARKET, BY DEPLOYMENT MODEL,  2019–2022 (USD MILLION)
                                   TABLE 194 SOUTH AFRICA: MARKET, BY DEPLOYMENT MODEL,  2023–2028 (USD MILLION)
                                   TABLE 195 SOUTH AFRICA: MARKET, BY ORGANIZATION SIZE,  2019–2022 (USD MILLION)
                                   TABLE 196 SOUTH AFRICA: MARKET, BY ORGANIZATION SIZE,  2023–2028 (USD MILLION)
             11.5.5 REST OF MIDDLE EAST & AFRICA
                       TABLE 197 REST OF MIDDLE EAST & AFRICA: MARKET, BY DEPLOYMENT MODEL, 2019–2022 (USD MILLION)
                       TABLE 198 REST OF MIDDLE EAST & AFRICA: MARKET, BY DEPLOYMENT MODEL, 2023–2028 (USD MILLION)
                       TABLE 199 REST OF MIDDLE EAST & AFRICA: MARKET, BY ORGANIZATION SIZE, 2019–2022 (USD MILLION)
                       TABLE 200 REST OF MIDDLE EAST & AFRICA: MARKET, BY ORGANIZATION SIZE, 2023–2028 (USD MILLION)
     11.6 LATIN AMERICA 
             11.6.1 LATIN AMERICA: MARKET DRIVERS
             11.6.2 LATIN AMERICA: RECESSION IMPACT
                       TABLE 201 LATIN AMERICA: CLOUD STORAGE MARKET, BY OFFERING, 2019–2022 (USD MILLION)
                       TABLE 202 LATIN AMERICA: MARKET, BY OFFERING, 2023–2028 (USD MILLION)
                       TABLE 203 LATIN AMERICA: MARKET, BY STORAGE TYPE,  2019–2022 (USD MILLION)
                       TABLE 204 LATIN AMERICA: MARKET, BY STORAGE TYPE,  2023–2028 (USD MILLION)
                       TABLE 205 LATIN AMERICA: MARKET, BY DEPLOYMENT MODEL,  2019–2022 (USD MILLION)
                       TABLE 206 LATIN AMERICA: MARKET, BY DEPLOYMENT MODEL,  2023–2028 (USD MILLION)
                       TABLE 207 LATIN AMERICA: MARKET, BY ORGANIZATION SIZE,  2019–2022 (USD MILLION)
                       TABLE 208 LATIN AMERICA: MARKET, BY ORGANIZATION SIZE,  2023–2028 (USD MILLION)
                       TABLE 209 LATIN AMERICA: MARKET, BY APPLICATION,  2019–2022 (USD MILLION)
                       TABLE 210 LATIN AMERICA: MARKET, BY APPLICATION,  2023–2028 (USD MILLION)
                       TABLE 211 LATIN AMERICA: MARKET, BY VERTICAL, 2019–2022 (USD MILLION)
                       TABLE 212 LATIN AMERICA: MARKET, BY VERTICAL, 2023–2028 (USD MILLION)
                       TABLE 213 LATIN AMERICA: MARKET, BY COUNTRY, 2019–2022 (USD MILLION)
                       TABLE 214 LATIN AMERICA: MARKET, BY COUNTRY, 2023–2028 (USD MILLION)
             11.6.3 BRAZIL
                       11.6.3.1 Rise in advanced technology assimilation among enterprises and end consumers to drive demand for strategic cloud storage adoption
                                   TABLE 215 BRAZIL: CLOUD STORAGE MARKET, BY DEPLOYMENT MODEL, 2019–2022 (USD MILLION)
                                   TABLE 216 BRAZIL: MARKET, BY DEPLOYMENT MODEL, 2023–2028 (USD MILLION)
                                   TABLE 217 BRAZIL: MARKET, BY ORGANIZATION SIZE, 2019–2022 (USD MILLION)
                                   TABLE 218 BRAZIL: MARKET, BY ORGANIZATION SIZE, 2023–2028 (USD MILLION)
             11.6.4 MEXICO
                       11.6.4.1 Increased opportunities for content delivery providers to drive market for cloud storage in Mexico
                                   TABLE 219 MEXICO: MARKET, BY DEPLOYMENT MODEL,  2019–2022 (USD MILLION)
                                   TABLE 220 MEXICO: MARKET, BY DEPLOYMENT MODEL,  2023–2028 (USD MILLION)
                                   TABLE 221 MEXICO: MARKET, BY ORGANIZATION SIZE, 2019–2022 (USD MILLION)
                                   TABLE 222 MEXICO: MARKET, BY ORGANIZATION SIZE, 2023–2028 (USD MILLION)
             11.6.5 REST OF LATIN AMERICA
                       TABLE 223 REST OF LATIN AMERICA: MARKET, BY DEPLOYMENT MODEL,  2019–2022 (USD MILLION)
                       TABLE 224 REST OF LATIN AMERICA: MARKET, BY DEPLOYMENT MODEL,  2023–2028 (USD MILLION)
                       TABLE 225 REST OF LATIN AMERICA: MARKET, BY ORGANIZATION SIZE,  2019–2022 (USD MILLION)
                       TABLE 226 REST OF LATIN AMERICA: MARKET, BY ORGANIZATION SIZE,  2023–2028 (USD MILLION)
 
12 COMPETITIVE LANDSCAPE (Page No. - 208)
     12.1 OVERVIEW 
     12.2 STRATEGIES ADOPTED BY KEY PLAYERS 
               TABLE 227 STRATEGIES ADOPTED BY KEY PLAYERS
     12.3 REVENUE ANALYSIS 
               FIGURE 38 REVENUE ANALYSIS OF TOP FIVE PLAYERS, 2018–2022 (USD BILLION)
     12.4 COMPANY FINANCIAL METRICS 
               FIGURE 39 TRADING COMPARABLE, 2023 (EV/EBITDA)
     12.5 MARKET SHARE ANALYSIS 
               FIGURE 40 CLOUD STORAGE MARKET SHARE ANALYSIS, 2022
               TABLE 228 DEGREE OF COMPETITION
     12.6 PRODUCT/BRAND COMPARISON 
               TABLE 229 PRODUCT/BRAND COMPARISON
     12.7 COMPANY EVALUATION MATRIX 
               FIGURE 41 COMPANY EVALUATION MATRIX FOR KEY PLAYERS: CRITERIA WEIGHTAGE
             12.7.1 STARS
             12.7.2 EMERGING LEADERS
             12.7.3 PERVASIVE PLAYERS
             12.7.4 PARTICIPANTS
                       FIGURE 42 MARKET: COMPANY EVALUATION MATRIX, 2022
             12.7.5 COMPANY FOOTPRINT
                       TABLE 230 COMPANY PRODUCT FOOTPRINT
                       TABLE 231 COMPANY OFFERING FOOTPRINT
                       TABLE 232 COMPANY VERTICAL FOOTPRINT
                       TABLE 233 COMPANY REGION FOOTPRINT
     12.8 STARTUP/SME EVALUATION MATRIX 
               FIGURE 43 STARTUP/SME EVALUATION MATRIX: CRITERIA WEIGHTAGE
             12.8.1 PROGRESSIVE COMPANIES
             12.8.2 RESPONSIVE COMPANIES
             12.8.3 DYNAMIC COMPANIES
             12.8.4 STARTING BLOCKS
                       FIGURE 44 MARKET: STARTUP/SME EVALUATION MATRIX, 2022
             12.8.5 COMPETITIVE BENCHMARKING
                       TABLE 234 CLOUD STORAGE MARKET: KEY STARTUPS/SMES
                       TABLE 235 MARKET: COMPETITIVE BENCHMARKING OF STARTUPS/SMES
     12.9 COMPETITIVE SCENARIO AND TRENDS 
             12.9.1 PRODUCT LAUNCHES
                       TABLE 236 PRODUCT LAUNCHES, FEBRUARY 2021–OCTOBER 2023
             12.9.2 DEALS
                       TABLE 237 DEALS, OCTOBER 2021–NOVEMBER 2023
 
13 COMPANY PROFILES (Page No. - 225)
     13.1 INTRODUCTION 
     13.2 KEY COMPANIES 
(Business overview, Products/Solutions/Services offered, Recent developments, MnM view, Key strengths, Strategic choices made, and Weaknesses and Competitive threats)*
             13.2.1 AMAZON WEB SERVICES, INC.
                       TABLE 238 AMAZON WEB SERVICES, INC.: BUSINESS OVERVIEW
                       FIGURE 45 AMAZON WEB SERVICES, INC.: COMPANY SNAPSHOT
                       TABLE 239 AMAZON WEB SERVICES, INC.: PRODUCTS/SOLUTIONS/SERVICES OFFERED
                       TABLE 240 AMAZON WEB SERVICES, INC.: PRODUCT LAUNCHES
                       TABLE 241 AMAZON WEB SERVICES, INC.: DEALS
             13.2.2 IBM
                       TABLE 242 IBM: BUSINESS OVERVIEW
                       FIGURE 46 IBM: COMPANY SNAPSHOT
                       TABLE 243 IBM: PRODUCTS/SOLUTIONS/SERVICES OFFERED
                       TABLE 244 IBM: PRODUCT LAUNCHES
                       TABLE 245 IBM: DEALS
             13.2.3 GOOGLE
                       TABLE 246 GOOGLE: BUSINESS OVERVIEW
                       FIGURE 47 GOOGLE: COMPANY SNAPSHOT
                       TABLE 247 GOOGLE: PRODUCTS/SOLUTIONS/SERVICES OFFERED
                       TABLE 248 GOOGLE: PRODUCT LAUNCHES
                       TABLE 249 GOOGLE: DEALS
             13.2.4 MICROSOFT
                       TABLE 250 MICROSOFT: BUSINESS OVERVIEW
                       FIGURE 48 MICROSOFT: COMPANY SNAPSHOT
                       TABLE 251 MICROSOFT: PRODUCTS/SOLUTIONS/SERVICES OFFERED
                       TABLE 252 MICROSOFT: PRODUCT LAUNCHES
                       TABLE 253 MICROSOFT: DEALS
             13.2.5 ALIBABA CLOUD
                       TABLE 254 ALIBABA CLOUD: BUSINESS OVERVIEW
                       FIGURE 49 ALIBABA CLOUD: COMPANY SNAPSHOT
                       TABLE 255 ALIBABA CLOUD: PRODUCTS/SOLUTIONS/SERVICES OFFERED
                       TABLE 256 ALIBABA CLOUD: PRODUCT LAUNCHES
                       TABLE 257 ALIBABA CLOUD: DEALS
             13.2.6 ORACLE
                       TABLE 258 ORACLE: BUSINESS OVERVIEW
                       FIGURE 50 ORACLE: COMPANY SNAPSHOT
                       TABLE 259 GOOGLE: PRODUCTS/SOLUTIONS/SERVICES OFFERED
                       TABLE 260 ORACLE: PRODUCT LAUNCHES
                       TABLE 261 ORACLE: DEALS
             13.2.7 RACKSPACE TECHNOLOGY
                       TABLE 262 RACKSPACE TECHNOLOGY: BUSINESS OVERVIEW
                       FIGURE 51 RACKSPACE TECHNOLOGY: COMPANY SNAPSHOT
                       TABLE 263 RACKSPACE TECHNOLOGY: PRODUCTS/SOLUTIONS/SERVICES OFFERED
                       TABLE 264 RACKSPACE TECHNOLOGY: PRODUCT LAUNCHES
                       TABLE 265 RACKSPACE TECHNOLOGY: DEALS
             13.2.8 HEWLETT PACKARD ENTERPRISE
                       TABLE 266 HEWLETT PACKARD ENTERPRISE: BUSINESS OVERVIEW
                       FIGURE 52 HEWLETT PACKARD ENTERPRISE: COMPANY SNAPSHOT
                       TABLE 267 HEWLETT PACKARD ENTERPRISE: PRODUCTS/SOLUTIONS/SERVICES OFFERED
                       TABLE 268 HEWLETT PACKARD ENTERPRISE: PRODUCT LAUNCHES
                       TABLE 269 HEWLETT PACKARD ENTERPRISE: DEALS
             13.2.9 DELL TECHNOLOGIES
                       TABLE 270 DELL TECHNOLOGIES: BUSINESS OVERVIEW
                       FIGURE 53 DELL TECHNOLOGIES: COMPANY SNAPSHOT
                       TABLE 271 DELL TECHNOLOGIES: PRODUCTS/SOLUTIONS/SERVICES OFFERED
                       TABLE 272 DELL TECHNOLOGIES: PRODUCT LAUNCHES
                       TABLE 273 DELL TECHNOLOGIES: CLOUD STORAGE MARKET: DEALS
             13.2.10 HUAWEI
                       TABLE 274 HUAWEI: BUSINESS OVERVIEW
                       FIGURE 54 HUAWEI: COMPANY SNAPSHOT
                       TABLE 275 HUAWEI: PRODUCTS/ SOLUTIONS/SERVICES OFFERED
                       TABLE 276 HUAWEI: PRODUCT LAUNCHES
     13.3 OTHER COMPANIES 
             13.3.1 DROPBOX
             13.3.2 BOX
             13.3.3 TENCENT CLOUD
             13.3.4 FUJITSU
             13.3.5 VMWARE
             13.3.6 NETAPP
             13.3.7 HITACHI VANTARA
             13.3.8 SCALITY
             13.3.9 CITRIX
             13.3.10 UPCLOUD
             13.3.11 DIGITALOCEAN
             13.3.12 VULTR
             13.3.13 MINIO
             13.3.14 ZADARA
             13.3.15 PCLOUD
             13.3.16 WASABI
             13.3.17 SYNC
             13.3.18 DEGOO
*Details on Business overview, Products/Solutions/Services offered, Recent developments, Product launches, MnM view, Key strengths, Strategic choices made, and Weaknesses and Competitive threats might not be captured in case of unlisted companies.
 
14 ADJACENT AND RELATED MARKETS (Page No. - 288)
     14.1 INTRODUCTION 
             14.1.1 RELATED MARKETS
     14.2 CLOUD COMPUTING MARKET 
               TABLE 277 CLOUD COMPUTING MARKET, BY SERVICE MODEL, 2018–2022 (USD BILLION)
               TABLE 278 CLOUD COMPUTING MARKET, BY SERVICE MODEL, 2023–2028 (USD BILLION)
               TABLE 279 CLOUD COMPUTING MARKET, BY DEPLOYMENT MODEL, 2018–2022 (USD BILLION)
               TABLE 280 CLOUD COMPUTING MARKET, BY DEPLOYMENT MODEL, 2023–2028 (USD BILLION)
               TABLE 281 CLOUD COMPUTING MARKET, BY ORGANIZATION SIZE, 2018–2022 (USD BILLION)
               TABLE 282 CLOUD COMPUTING MARKET, BY ORGANIZATION SIZE, 2023–2028 (USD BILLION)
               TABLE 283 CLOUD COMPUTING MARKET, BY VERTICAL, 2018–2022 (USD BILLION)
               TABLE 284 CLOUD COMPUTING MARKET, BY VERTICAL, 2023–2028 (USD BILLION)
               TABLE 285 CLOUD COMPUTING MARKET, BY REGION, 2018–2022 (USD BILLION)
               TABLE 286 CLOUD COMPUTING MARKET, BY REGION, 2023–2028 (USD BILLION)
     14.3 DISASTER RECOVERY AS A SERVICE (DRAAS) MARKET 
               TABLE 287 DISASTER RECOVERY AS A SERVICE MARKET, BY SERVICE TYPE,  2018–2022 (USD MILLION)
               TABLE 288 DISASTER RECOVERY AS A SERVICE MARKET, BY SERVICE TYPE,  2023–2028 (USD MILLION)
               TABLE 289 DISASTER RECOVERY AS A SERVICE MARKET, BY DEPLOYMENT MODE,  2018–2022 (USD MILLION)
               TABLE 290 DISASTER RECOVERY AS A SERVICE MARKET, BY DEPLOYMENT MODE,  2023–2028 (USD MILLION)
               TABLE 291 DISASTER RECOVERY AS A SERVICE MARKET, BY ORGANIZATION SIZE,  2018–2022 (USD MILLION)
               TABLE 292 DISASTER RECOVERY AS A SERVICE MARKET, BY ORGANIZATION SIZE,  2023–2028 (USD MILLION)
               TABLE 293 DISASTER RECOVERY AS A SERVICE MARKET, BY VERTICAL, 2018–2022 (USD MILLION)
               TABLE 294 DISASTER RECOVERY AS A SERVICE MARKET, BY VERTICAL, 2023–2028 (USD MILLION)
               TABLE 295 DISASTER RECOVERY AS A SERVICE MARKET, BY REGION, 2018–2022 (USD MILLION)
               TABLE 296 DISASTER RECOVERY AS A SERVICE MARKET, BY REGION, 2023–2028 (USD MILLION)
 
15 APPENDIX (Page No. - 296)
     15.1 DISCUSSION GUIDE 
     15.2 KNOWLEDGESTORE: MARKETSANDMARKETS’  SUBSCRIPTION PORTAL 
     15.3 CUSTOMIZATION OPTIONS 
     15.4 RELATED REPORTS 
     15.5 AUTHOR DETAILS 

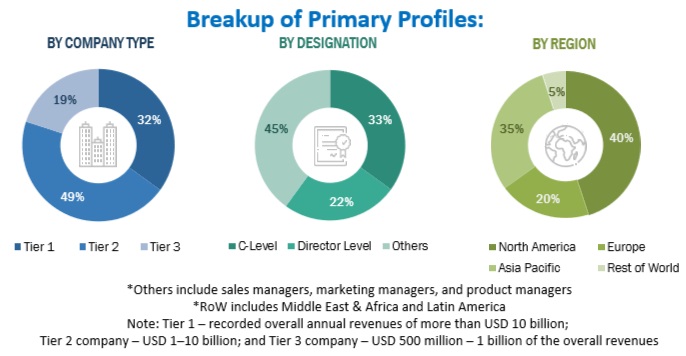
The study covered four main actions to estimate the current market size of the cloud storage market. We conducted a significant amount of secondary research to gather data on the market, the competing market, and the parent market. The following stage involved conducting primary research to confirm these conclusions' hypotheses and sizing with industry experts throughout the value chain. A combination of top-down and bottom-up methods was used to assess the overall market size. We then estimated the market sizes of the leading Cloud Storage segments using the market breakup and data triangulation techniques.

Secondary Research

A wide range of secondary sources, directories, and databases were employed in this research project, including product demos, vendor data sheets, D&B Hoovers, DiscoverOrg, Factiva, Vendor Surveys, Cloud Computing Association (CCA), Asia Cloud Computing Association, and The Software Alliance. We referred to sources to locate and gather important data for this technical, commercial, and market-focused analysis of the cloud storage market.

Primary Research

Several industry experts from the core and related industries and providers of preferred software, hardware manufacturers, distributors, service providers, technology developers, alliances, and organisations connected to every link in the industry value chain were the primary sources of information. Key industry participants, subject-matter experts, C-level executives of major market players, and industry consultants were among the primary respondents with whom in-depth interviews were conducted to gather and validate crucial qualitative and quantitative data and evaluate the market's potential.

To obtain information, we conducted primary interviews on market statistics, the most recent trends that are upending the industry, newly implemented use cases, data on revenue generated by goods and services, market segmentation, market size estimations, market forecasts, and data triangulation. Understanding different technological developments, segmentation types, industry trends, and geographical areas was also aided by primary research. To understand the buyer's perspective on suppliers, products, service providers, and their current use of services, which would affect the overall Cloud Storage market, demand-side stakeholders, such as Chief Executive Officers (CEOs), Chief Information Officers (CIOs), Chief Technology Officers (CTOs), Vice Presidents (VPs), and Chief Security Officers (CSOs), as well as the installation teams of governments/end users using cloud storage, and digital initiatives project teams, were interviewed.
Cloud Storage Market Size, and Share

To know about the assumptions considered for the study, download the pdf brochure

Market Size Estimation

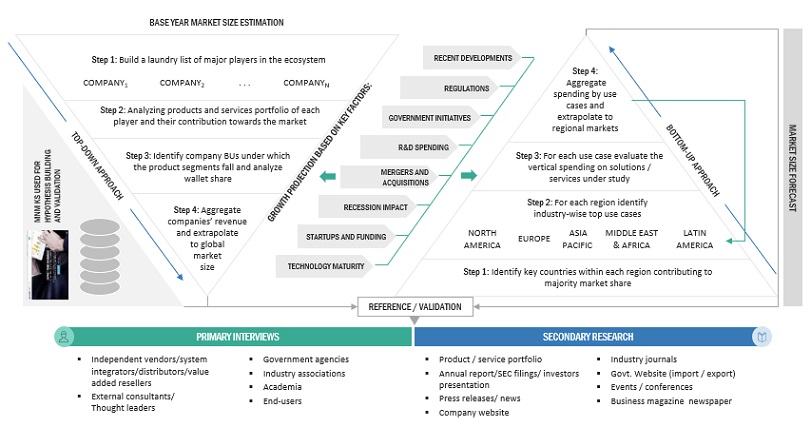
We employed top-down and bottom-up methodologies to estimate and forecast the Cloud Storage market and other associated submarkets. Using the revenues and product offerings of the major market players, the bottom-up approach assisted in determining the overall market size. This research ascertained and validated the precise value of the total parent market size through data triangulation techniques and primary interview validation. Using percentage splits of the market segments, we were able to estimate the size of other specific markets using the overall market size via the top-down approach.

The bottom-up approach identified the trend of Cloud Storage adoption among industry verticals in critical countries that contribute the most to the market. The adoption trend of cloud storage and varying cases of use concerning their business segments were identified and extrapolated for cross-validation. We gave weightage to the use cases identified in different solution areas for the calculation. We prepared an exhaustive list of all vendors offering Cloud Storage. We estimated the revenue contribution of all vendors in the market through annual reports, press releases, funding, investor presentations, paid databases, and primary interviews. We evaluated each vendor based on its service offerings across verticals. We extrapolated the aggregate of all companies' revenue to reach the overall market size. Each subsegment was studied and analyzed for its market size and regional penetration. We determined the region split through primary and secondary sources based on these numbers.

The top-down approach prepared an exhaustive list of all vendors in the Cloud Storage market. We estimated the revenue contribution of all vendors in the market through their annual reports, press releases, funding, investor presentations, paid databases, and primary interviews. We estimated the market size from revenues generated by vendors from different Cloud Storage offerings. Using secondary and primary sources, we located additional vendors and the income produced by each service type, which we then aggregated to calculate the market size. Additionally, the procedure included a regional penetration analysis of the cloud storage market. The investigation was utilized to ascertain and validate the precise values of the market sizes for Cloud Storage and its sectors, using the data triangulation process and primary data validation. The main procedure to gather essential insights was conducting in-depth interviews with CEOs, CTOs, CIOs, VPs, directors, and marketing executives. To confirm, we further triangulated market numbers using the current MarketsandMarkets repository.

Cloud Storage Market: Top-Down and Bottom-Up approaches
Cloud Storage Market Bottom Up Approach

To know about the assumptions considered for the study, Request for Free Sample Report

Data Triangulation

The market was divided into several segments and subsegments using the previously described market size estimation procedures once the overall market size was determined. When required, market breakdown and data triangulation procedures were employed to complete the market engineering process and specify the exact figures for every market segment and subsegment. The data was triangulated by examining several variables and patterns from government entities' supply and demand sides.

Market Definition

Considering the views of various sources and associations on Cloud Storage, MarketsandMarkets defines Cloud Storage as "a cloud computing service model that allows end-users to store and access the data through the internet from various distributed and connected resources. Enterprises use cloud storage solutions to store, manage, and maintain enterprise data while leveraging cloud benefits, such as simplified accessibility, reliability, rapid deployment, secured data protection, and reduced infrastructure costs. Companies provide cloud storage solutions with three basic underlying architectures: object storage, block storage, and file storage".

Key Stakeholders

  • Cloud storage providers
  • Information Technology (IT) infrastructure equipment providers
  • Cloud storage component providers
  • System Integrators (SIs)
  • Support service providers
  • Consulting service providers
  • Managed service providers
  • Cloud Service Providers (CSPs)

Report Objectives

  • To define, describe, and forecast the global Cloud Storage market based on offering, use case, deployment model, organization size, vertical, and region.
  • To forecast the market size of the five major regional segments: North America, Europe, Asia Pacific, Middle East & Africa, and Latin America
  • To strategically analyze the market subsegments for individual growth trends, prospects, and contributions to the total market
  • To provide detailed information related to the major factors influencing the growth of the market (drivers, restraints, opportunities, and challenges)
  • To strategically analyze macro and micro-markets for growth trends, prospects, and their contributions to the overall market
  • To analyze industry trends, patents and innovations, and pricing data related to the Cloud Storage market.
  • To analyze the opportunities in the market for stakeholders and provide details of the competitive landscape for major players.
  • To profile key players in the market and comprehensively analyze their market share/ranking and core competencies
  • To track and analyze competitive developments, such as mergers & acquisitions, product developments, and partnerships & collaborations in the market.

Note 1. Micromarkets are defined as the further segments and subsegments of the market included in the report.
Note 2. The companies' Core competencies are captured in terms of their key developments and essential strategies to sustain their position in the market.

Available Customizations

With the given market data, MarketsandMarkets offers customizations per the company's specific needs. The following customization options are available for the report:

Product Analysis

  • The product matrix provides a detailed comparison of the product portfolio of each company.

Geographic Analysis

  • Further breakup of the Asia Pacific market into countries contributing 75% to the regional market size
  • Further breakup of the North American market into countries contributing 75% to the regional market size
  • Further breakup of the Latin American market into countries contributing 75% to the regional market size
  • Further breakup of the Middle Eastern & African market into countries contributing 75% to the regional market size
  • Further breakup of the European market into countries contributing 75% to the regional market size

Company Information

  • Detailed analysis and profiling of additional market players (up to 5)
Custom Market Research Services

We will customize the research for you, in case the report listed above does not meet with your exact requirements. Our custom research will comprehensively cover the business information you require to help you arrive at strategic and profitable business decisions.

Request Customization

Instant Answers with GPT - Ask Now!

Ask real questions. Get complete answers !
Report Code
TC 2410
Published ON
Feb, 2024
Choose License Type
BUY NOW
  • SHARE
X
Request Customization
Speak to Analyst
Speak to Analyst
OR FACE-TO-FACE MEETING
PERSONALIZE THIS RESEARCH
  • Triangulate with your Own Data
  • Get Data as per your Format and Definition
  • Gain a Deeper Dive on a Specific Application, Geography, Customer or Competitor
  • Any level of Personalization
REQUEST A FREE CUSTOMIZATION
LET US HELP YOU!
  • What are the Known and Unknown Adjacencies Impacting the Cloud Storage Market
  • What will your New Revenue Sources be?
  • Who will be your Top Customer; what will make them switch?
  • Defend your Market Share or Win Competitors
  • Get a Scorecard for Target Partners
CUSTOMIZED WORKSHOP REQUEST
+1-888-600-6441
  • Call Us
  • +1-888-600-6441 (Corporate office hours)
  • +1-888-600-6441 (US/Can toll free)
  • +44-800-368-9399 (UK office hours)
CONNECT WITH US
ABOUT TRUST ONLINE
©2024 MarketsandMarkets Research Private Ltd. All rights reserved
DMCA.com Protection Status Website Feedback