Cloud Infrastructure Services Market by Service Type (Storage as a Service, Compute as a Service, Disaster Recovery and Backup as a Service), Deployment Model, Organization Size, Vertical, and Region - Global Forecast to 2024


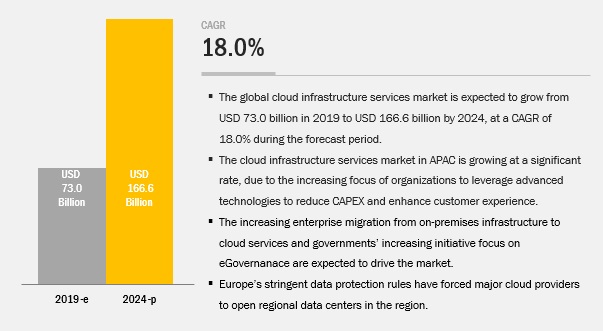
[176 Pages Report] MarketsandMarkets expects the global cloud infrastructure services market to grow from USD 73.0 billion in 2019 to USD 166.6 billion by 2024, at a Compound Annual Growth Rate (CAGR) of 18.0% during the forecast period. The major growth drivers for the market include low costs, flexibility, scalability, and security. The cloud infrastructure service offerings provide accelerated Time-to-Market (TTM) and speedy application development and running processes.
The storage as a service, service type is expected to hold a larger market size during the forecast period
Based on the service type, the cloud infrastructure services market is segmented into computing as a service, storage as a service, disaster as a service, networking as a service, desktop as a service and managed hosting. Organizations across all size and industries are leveraging cloud infrastructure services for improving efficiency, lowering the cost of server space and access to data anywhere. The disaster recovery and backup as a service segment is expected to grow at the highest CAGR during the forecast period, whereas the storage as a service segment is estimated to hold the largest market size in 2019. The cloud infrastructure services have become a central part of business processes, due to their ease of use, low operating costs, and flexibility.
The public cloud is expected to hold the largest market size during the forecast period
Among deployment models, the public cloud deployment model is estimated to hold the largest market size in 2019. The advantages of using the public cloud include the simplicity and ease of deployment. The initial investment required for the deployment is minimum, and there are no responsibilities involved in managing the infrastructure. The public cloud offers scalability, reliability, flexibility, utility-style costing, and location independence services.
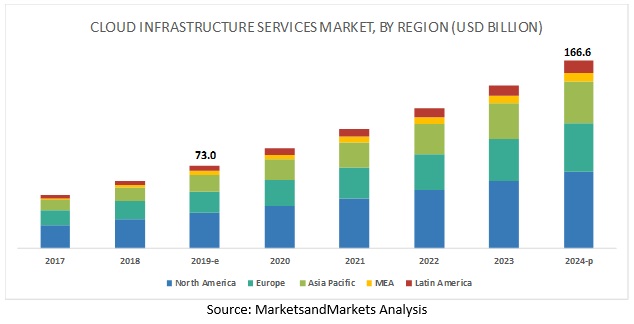
North America to hold the largest market size during the forecast period
Among regions, North America is estimated to hold the largest market size in 2019, whereas Asia Pacific (APAC) is expected to grow at the highest CAGR during the forecast period. The increasing need for speedy and low-cost service delivery processes and complete security while operating in cloud environments is expected to drive the global cloud infrastructure services market.
Key Market Players
Major players in the global cloud infrastructure services market are IBM (US), Microsoft (US), AWS (US), Oracle (US), Google (US), Alibaba (China), Fujitsu (Japan), Rackspace (US), DigitalOcean (US), Verizon (US), VMware (US), CenturyLink (US), Bluelock (US), Dimension Data (South Africa), OVH (France), Joyent (US), Skytap (US), Virtuestream (US), ProfitBricks (Germany), Tencent (China), DXC Technology (US), AT&T (US), NEC (Japan), and Navisite (US). These players have adopted various growth strategies, such as new product developments, mergers and acquisitions, collaborations, and partnerships, to expand their presence in the global cloud infrastructure services market.
Alibaba Cloud (China) is a cloud computing arm and a business unit of the Alibaba Group. The company offers robust cloud networking, storage, and computing services by continuously improving its offerings to meet customer demands and increase the company�s growth. Alibaba Cloud provides a comprehensive suite of cloud computing services to power both international customers� online businesses and Alibaba Group�s eCommerce ecosystem. In the past few years, the company has maintained an efficient track record of integrating complimentary firms through partnerships and acquisitions.
Scope of the Report
|
Report Metrics |
Details |
|
Market size available for years |
2017-2024 |
|
Base year considered |
2018 |
|
Forecast period |
2019-2024 |
|
Forecast units |
Value (USD) |
|
Segments covered |
Service Type, Deployment Type, Organization Size, Vertical, and Region |
|
Geographies covered |
North America, Europe, APAC, Latin America, and MEA |
|
Companies covered |
It includes 24 major vendors, namely, IBM (US), Microsoft (US), AWS (US), Oracle (US), Google (US), Alibaba (China), Fujitsu (Japan), Rackspace (US), DigitalOcean (US), Verizon (US), VMware (US), CenturyLink (US), Bluelock (US), Dimension Data (South Africa), OVH (France), Joyent (US), Skytap (US), Virtuestream (US), ProfitBricks (Germany), Tencent (China), DXC Technology (US), AT&T (US), NEC (Japan), and Navisite (US). |
This research report categorizes the cloud infrastructure services market to forecast revenues and analyze trends in each of the following submarkets:
Based on Service, the cloud infrastructure services market has been segmented as follows:
- Compute as a Service
- Storage as a Service
- Disaster Recovery and Backup as a Service
- Networking as a Service
- Desktop as a Service
- Managed Hosting
Based on Deployment model, the cloud infrastructure services market has been segmented as follows:
- Public Cloud
- Private Cloud
- Hybrid Cloud
On the basis of Organization size, the cloud infrastructure services market has been segmented as follows:
- Small and Medium-sized Enterprises (SMEs)
- Large Enterprises
Based on Vertical, the cloud infrastructure services market has been segmented as follows:
- Banking, Financial Services, and Insurance (BFSI)
- IT and Telecommunications
- Government and Public Sector
- Retail and Consumer Goods
- Manufacturing
- Energy and Utilities
- Media and Entertainment
- Healthcare and Life Sciences
- Others (Education and Travel and Hospitality)
Based on Region, the cloud infrastructure services market has been segmented as follows:
- North America
- US
- Canada
- Europe
- UK
- Rest of Europe
- Asia Pacific (APAC)
- China
- Rest of APAC
- Middle East and Africa (MEA)
- Kingdom of Saudi Arabia (KSA)
- Rest of MEA
- Latin America
- Brazil
- Mexico
- Rest of Latin America
Recent Developments
- In September2019, Oracle partnered with VMware to offer support customers in implementing hybrid cloud strategies. Under this partnership, customers will be able to execute their hybrid cloud strategies by running VMware Cloud Foundation on Oracle Cloud Infrastructure. This partnership would enable customers to easily migrate VMware vSphere workloads to Oracle�s Generation 2 Cloud Infrastructure and take advantage of consistent infrastructure and operations.
- In August 2019, AWS expanded its global presence by opening new data centers in Hong Kong. This newly launched data center allows its commercial customers to run applications and store their content in data centers in Hong Kong while connecting to the global AWS network.
- In June 2018, Alibaba Cloud and Commvault announced a partnership to leverage each other's technologies and market advantages to deliver integrated features on a single unified platform, provide advanced centralized support, and offer innovative, personalized
Critical Questions the Report Answers
- What are the current trends that are driving the cloud infrastructure services market?
- Where will all these developments take the industry in the mid to long term?
- Who are the top vendors in the market, and what is their competitive analysis?
- What are the key driving factors and challenges impacting the cloud infrastructure services market?
- Which region is expected to lead the global market at the end of the forecast period?
To speak to our analyst for a discussion on the above findings, click Speak to Analyst
 Exclusive indicates content/data unique to MarketsandMarkets and not available with any competitors.
TABLE OF CONTENTS
1 INTRODUCTION (Page No. - 25)
1.1 OBJECTIVES OF THE STUDY
1.2 MARKET DEFINITION
1.3 MARKET SCOPE
1.4 YEARS CONSIDERED FOR THE STUDY
1.5 STAKEHOLDERS
2 RESEARCH METHODOLOGY (Page No. - 28)
2.1 RESEARCH DATA
FIGURE 1 IAAS MARKET: RESEARCH DESIGN
2.1.1 SECONDARY DATA
2.1.2 PRIMARY DATA
2.1.2.1 Breakup of primaries
2.1.2.2 Key industry insights
2.2 MARKET BREAKUP AND DATA TRIANGULATION
2.3 MARKET SIZE ESTIMATION
FIGURE 2 CLOUD INFRASTRUCTURE SERVICES MARKET: TOP-DOWN AND BOTTOM-UP APPROACHES
2.3.1 TOP-DOWN APPROACH
2.3.2 BOTTOM-UP APPROACH
2.4 MARKET FORECAST
TABLE 1 FACTOR ANALYSIS
2.5 ASSUMPTIONS FOR THE STUDY
2.6 LIMITATIONS OF THE STUDY
3 EXECUTIVE SUMMARY (Page No. - 35)
FIGURE 3 IAAS MARKET, TOP SEGMENTS, 2019�2024
FIGURE 4 MARKET, BY REGION
4 PREMIUM INSIGHTS (Page No. - 38)
4.1 ATTRACTIVE GROWTH OPPORTUNITIES IN THE IAAS MARKET
FIGURE 5 INCREASING NUMBER OF DATA CENTERS ACROSS REGIONS AND RISING GOVERNMENT INITIATIVES TO DRIVE THE GROWTH OF THE MARKET
4.2 MARKET: BY DEPLOYMENT MODEL, 2019
FIGURE 6 PUBLIC CLOUD SEGMENT TO HOLD THE HIGHEST MARKET SHARE IN 2019
4.3 NORTH AMERICA: MARKET, BY SERVICE TYPE AND COUNTRY
FIGURE 7 STORAGE AS A SERVICE SEGMENT AND THE UNITED STATES TO ACCOUNT FOR HIGH MARKET SHARES IN THE NORTH AMERICAN IAAS MARKET IN 2019
5 MARKET OVERVIEW (Page No. - 40)
5.1 INTRODUCTION
5.2 MARKET DYNAMICS
FIGURE 8 DRIVERS, RESTRAINTS, OPPORTUNITIES, AND CHALLENGES: IAAS MARKET
5.2.1 DRIVERS
5.2.1.1 Changing market trends and agility
5.2.1.2 Increasing IaaS benefits
5.2.1.3 Increased cost-savings and ROI
5.2.1.4 Edge computing going mainstream
5.2.2 RESTRAINTS
5.2.2.1 Concern over data losses
5.2.2.2 Reluctance of employees to upgrade existing skills
5.2.3 OPPORTUNITIES
5.2.3.1 Increase in the adoption of hybrid cloud services
5.2.3.2 Rise in number of SMEs to create new revenue opportunities for cloud vendors
5.2.4 CHALLENGES
5.2.4.1 Increased need to manage regulatory and compliance policy needs
5.2.4.2 Compatibility issues with legacy systems
5.2.4.3 Fear of vendor lock-in
5.3 INDUSTRY TRENDS
5.3.1 USE CASE 1: IBM
6 IAAS MARKET, BY SERVICE TYPE (Page No. - 45)
6.1 INTRODUCTION
FIGURE 9 DISASTER RECOVERY AND BACKUP AS A SERVICE SEGMENT TO GROW AT THE HIGHEST GROWTH RATE DURING THE FORECAST PERIOD
TABLE 2 MARKET SIZE, BY SERVICE TYPE, 2017�2024 (USD BILLION)
6.2 COMPUTE AS A SERVICE
6.2.1 ON-DEMAND BILLING OF COMPUTING RESOURCE DRIVING DEMAND FOR COMPUTE AS A SERVICE
TABLE 3 COMPUTE AS A SERVICE: MARKET SIZE, BY REGION, 2017�2024 (USD BILLION)
TABLE 4 NORTH AMERICA: COMPUTE AS A SERVICE MARKET SIZE, BY COUNTRY, 2017�2024 (USD BILLION)
TABLE 5 EUROPE: COMPUTE AS A SERVICE IAAS MARKET SIZE, BY COUNTRY, 2017�2024 (USD BILLION)
TABLE 6 ASIA PACIFIC: COMPUTE AS A SERVICE MARKET SIZE, BY COUNTRY, 2017�2024 (USD BILLION)
TABLE 7 MIDDLE EAST AND AFRICA: COMPUTE AS A SERVICE MARKET SIZE, BY COUNTRY, 2017�2024 (USD BILLION)
6.3 STORAGE AS A SERVICE
6.3.1 SIMPLIFIED IMPLEMENTATION, EASE OF MAINTENANCE, AND MAXIMUM RETURN ON INVESTMENT DRIVING DEMAND FOR STORAGE SERVICES
TABLE 8 STORAGE AS A SERVICE: MARKET SIZE, BY REGION, 2017�2024 (USD BILLION)
TABLE 9 NORTH AMERICA: STORAGE AS A SERVICE MARKET SIZE, BY COUNTRY, 2017�2024 (USD BILLION)
TABLE 10 EUROPE: STORAGE AS A SERVICE MARKET SIZE, BY COUNTRY, 2017�2024 (USD BILLION)
TABLE 11 ASIA PACIFIC: STORAGE AS A SERVICE IAAS MARKET SIZE, BY COUNTRY, 2017�2024 (USD BILLION)
TABLE 12 MIDDLE EAST AND AFRICA: STORAGE AS A SERVICE MARKET SIZE, BY COUNTRY, 2017�2024 (USD BILLION)
6.4 DISASTER RECOVERY AND BACKUP AS A SERVICE
6.4.1 NEED TO PROTECT DATA FROM ANY DISASTER DRIVING DEMAND FOR DISASTER RECOVERY AND BACKUP AS A SERVICE
TABLE 13 DISASTER RECOVERY AND BACKUP AS A SERVICE: MARKET SIZE, BY REGION, 2017�2024 (USD BILLION)
TABLE 14 NORTH AMERICA: DISASTER RECOVERY AND BACKUP AS A SERVICE MARKET SIZE, BY COUNTRY, 2017�2024 (USD BILLION)
TABLE 15 EUROPE: DISASTER RECOVERY AND BACKUP AS A SERVICE MARKET SIZE, BY COUNTRY, 2017�2024 (USD BILLION)
TABLE 16 ASIA PACIFIC: DISASTER RECOVERY AND BACKUP AS A SERVICE IAAS MARKET SIZE, BY COUNTRY, 2017�2024 (USD BILLION)
TABLE 17 MIDDLE EAST AND AFRICA: DISASTER RECOVERY AND BACKUP AS A SERVICE MARKET SIZE, BY COUNTRY, 2017�2024 (USD BILLION)
6.5 NETWORKING AS A SERVICE
6.5.1 NETWORK AS A SERVICE ENABLES ENTERPRISES TO OPTIMIZE NETWORK STREAMS
TABLE 18 NETWORKING AS A SERVICE: MARKET SIZE, BY REGION, 2017�2024 (USD BILLION)
TABLE 19 NORTH AMERICA: NETWORKING AS A SERVICE MARKET SIZE, BY COUNTRY, 2017�2024 (USD BILLION)
TABLE 20 EUROPE: NETWORKING AS A SERVICE MARKET SIZE, BY COUNTRY, 2017�2024 (USD BILLION)
TABLE 21 ASIA PACIFIC: NETWORKING AS A SERVICE MARKET SIZE, BY COUNTRY, 2017�2024 (USD BILLION)
TABLE 22 MIDDLE EAST AND AFRICA: NETWORKING AS A SERVICE IAAS MARKET SIZE, BY COUNTRY, 2017�2024 (USD MILLION)
6.6 DESKTOP AS A SERVICE
6.6.1 FREEDOM OF ACCESSING DESKTOPS FROM ANYWHERE, ANYTIME, AND ANYHOW DRIVING ADOPTION OF DESKTOP AS A SERVICE
TABLE 23 DESKTOP AS A SERVICE: MARKET SIZE, BY REGION, 2017�2024 (USD BILLION)
TABLE 24 NORTH AMERICA: DESKTOP AS A SERVICE MARKET SIZE, BY COUNTRY, 2017�2024 (USD BILLION)
TABLE 25 EUROPE: DESKTOP AS A SERVICE MARKET SIZE, BY COUNTRY, 2017�2024 (USD BILLION)
TABLE 26 ASIA PACIFIC: DESKTOP AS A SERVICE MARKET SIZE, BY COUNTRY, 2017�2024 (USD BILLION)
TABLE 27 MIDDLE EAST AND AFRICA: DESKTOP AS A SERVICE IAAS MARKET SIZE, BY COUNTRY, 2017�2024 (USD MILLION)
6.7 MANAGED HOSTING
6.7.1 NEED TO REDUCE REDUNDANCY AND LATENCY IN ORCHESTRATING STORAGE AND KEEP FULL CONTROL OVER CONTENT TO DRIVE DEMAND FOR MANAGED HOSTING
TABLE 28 MANAGED HOSTING: MARKET SIZE, BY REGION, 2017�2024 (USD BILLION)
TABLE 29 NORTH AMERICA: MANAGED HOSTING MARKET SIZE, BY COUNTRY, 2017�2024 (USD BILLION)
TABLE 30 EUROPE: MANAGED HOSTING MARKET SIZE, BY COUNTRY, 2017�2024 (USD BILLION)
TABLE 31 ASIA PACIFIC: MANAGED HOSTING MARKET SIZE, BY COUNTRY, 2017�2024 (USD BILLION)
TABLE 32 MIDDLE EAST AND AFRICA: MANAGED HOSTING MARKET SIZE, BY COUNTRY, 2017�2024 (USD BILLION)
7 IAAS MARKET, BY DEPLOYMENT MODEL (Page No. - 60)
7.1 INTRODUCTION
FIGURE 10 HYBRID CLOUD SEGMENT TO GROW AT THE HIGHEST GROWTH RATE DURING THE FORECAST PERIOD
TABLE 33 MARKET SIZE, BY DEPLOYMENT MODEL, 2017�2024 (USD BILLION)
7.2 PUBLIC CLOUD
7.2.1 LOWER CAPITAL EXPENDITURE AND HIGHER SCALABILITY BENEFITS TO DRIVE DEMAND FOR PUBLIC CLOUD
TABLE 34 PUBLIC CLOUD: MARKET SIZE, BY REGION, 2017�2024 (USD BILLION)
TABLE 35 NORTH AMERICA: PUBLIC CLOUD MARKET SIZE, BY COUNTRY, 2017�2024 (USD BILLION)
TABLE 36 NORTH AMERICA: PUBLIC CLOUD MARKET SIZE, BY COUNTRY, 2017�2024 (USD BILLION)
TABLE 37 ASIA PACIFIC: PUBLIC CLOUD MARKET SIZE, BY COUNTRY, 2017�2024 (USD BILLION)
TABLE 38 MIDDLE EAST AND AFRICA: PUBLIC CLOUD IAAS MARKET SIZE, BY COUNTRY, 2017�2024 (USD BILLION)
7.3 PRIVATE CLOUD
7.3.1 CONCERNS OVER SECURITY AND PRIVACY DRIVING DEPLOYMENT OF IAAS ON PRIVATE CLOUD
TABLE 39 PRIVATE CLOUD: MARKET SIZE, BY REGION, 2017�2024 (USD BILLION)
TABLE 40 NORTH AMERICA: PRIVATE CLOUD MARKET SIZE, BY COUNTRY, 2017�2024 (USD BILLION)
TABLE 41 EUROPE: PRIVATE CLOUD MARKET SIZE, BY COUNTRY, 2017�2024 (USD BILLION)
TABLE 42 ASIA PACIFIC: PRIVATE CLOUD MARKET SIZE, BY COUNTRY, 2017�2024 (USD BILLION)
TABLE 43 MIDDLE EAST AND AFRICA: PRIVATE CLOUD MARKET SIZE, BY COUNTRY, 2017�2024 (USD BILLION)
7.4 HYBRID CLOUD
7.4.1 SCALABILITY, SECURITY, AND COST-EFFECTIVENESS DRIVING DEPLOYMENT OF IAAS ON HYBRID CLOUD
TABLE 44 HYBRID CLOUD: IAAS MARKET SIZE, BY REGION, 2017�2024 (USD BILLION)
TABLE 45 NORTH AMERICA: HYBRID CLOUD MARKET SIZE, BY COUNTRY, 2017�2024 (USD BILLION)
TABLE 46 EUROPE: HYBRID CLOUD MARKET SIZE, BY COUNTRY, 2017�2024 (USD BILLION)
TABLE 47 ASIA PACIFIC: HYBRID CLOUD MARKET SIZE, BY COUNTRY, 2017�2024 (USD BILLION)
TABLE 48 MIDDLE EAST AND AFRICA: HYBRID CLOUD MARKET SIZE, BY COUNTRY, 2017�2024 (USD BILLION)
8 IAAS MARKET, BY ORGANIZATION SIZE (Page No. - 68)
8.1 INTRODUCTION
FIGURE 11 SMALL AND MEDIUM-SIZED ENTERPRISES SEGMENT TO GROW AT A HIGHER GROWTH RATE DURING THE FORECAST PERIOD
TABLE 49 MARKET SIZE, BY ORGANIZATION SIZE, 2017�2024 (USD BILLION)
8.2 SMALL AND MEDIUM-SIZED ENTERPRISES
8.2.1 REDUCED COST OF IMPLEMENTATION WITH FLEXIBLE PRICING MODELS LEADING TO HIGHER ADOPTION OF IAAS AMONG SMALL AND MEDIUM-SIZED ENTERPRISES
TABLE 50 SMALL AND MEDIUM-SIZED ENTERPRISES: MARKET SIZE, BY REGION, 2017�2024 (USD BILLION)
8.3 LARGE ENTERPRISES
8.3.1 BENEFIT OF SCALING UP OR DOWN THE INFRASTRUCTURE SYSTEM AS PER BUSINESS REQUIREMENTS TO DRIVE THE ADOPTION OF IAAS AMONG LARGE ENTERPRISES
TABLE 51 LARGE ENTERPRISES: MARKET SIZE, BY REGION, 2017�2024 (USD BILLION)
9 IAAS MARKET, BY VERTICAL (Page No. - 72)
9.1 INTRODUCTION
FIGURE 12 RETAIL AND CONSUMER GOODS VERTICAL TO GROW AT THE HIGHEST GROWTH RATE DURING THE FORECAST PERIOD
TABLE 52 MARKET SIZE, BY VERTICAL, 2017�2024 (USD BILLION)
9.2 BANKING, FINANCIAL SERVICES, AND INSURANCE
9.2.1 UNRIVALLED LEVEL OF AGILITY, SECURITY, AND SCALABILITY TO DRIVE DEMAND FOR IAAS IN BANKING, FINANCIAL SERVICES, AND INSURANCE VERTICAL
TABLE 53 BANKING, FINANCIAL SERVICES, AND INSURANCE: MARKET SIZE, BY REGION, 2017�2024 (USD BILLION)
9.3 IT AND TELECOMMUNICATIONS
9.3.1 NEED TO ENHANCE CUSTOMER SATISFACTION AND PROVIDE FASTER TIME-TO-MARKET FOR SATISFYING CHANGING CUSTOMER NEEDS TO DRIVE ADOPTION OF IAAS IN IT AND TELECOMMUNICATIONS VERTICAL
TABLE 54 IT AND TELECOMMUNICATIONS: IAAS MARKET SIZE, BY REGION, 2017�2024 (USD BILLION)
9.4 GOVERNMENT AND PUBLIC SECTOR
9.4.1 NEED TO INCREASE CITIZEN ENGAGEMENT AND GOVERNMENT FAVOURABLE POLICIES OF DIGITAL DRIVING ADOPTION OF IAAS IN GOVERNMENT AND PUBLIC SECTOR
TABLE 55 GOVERNMENT AND PUBLIC SECTOR: MARKET SIZE, BY REGION, 2017�2024 (USD BILLION)
9.5 RETAIL AND CONSUMER GOODS
9.5.1 GROWING COMPETITION TO INCREASE MARKET SHARES AND PROFIT MARGINS DRIVING ADOPTION OF IAAS IN RETAIL AND CONSUMER GOODS VERTICAL
TABLE 56 RETAIL AND CONSUMER GOODS: MARKET SIZE, BY REGION, 2017�2024 (USD BILLION)
9.6 MANUFACTURING
9.6.1 GROWING NEED TO OPTIMIZE PRODUCT MANUFACTURING AND DELIVERY PROCESSES DRIVING ADOPTION OF IAAS IN MANUFACTURING VERTICAL
TABLE 57 MANUFACTURING: IAAS MARKET SIZE, BY REGION, 2017�2024 (USD BILLION)
9.7 ENERGY AND UTILITIES
9.7.1 GROWING NEED TO MANAGE COMPLEX OPERATIONS AND ENSURING RELIABILITY OF POWER SYSTEM BOOSTING ADOPTION OF IAAS IN ENERGY AND UTILITIES VERTICAL
TABLE 58 ENERGY AND UTILITIES: MARKET SIZE, BY REGION, 2017�2024 (USD BILLION)
9.8 MEDIA AND ENTERTAINMENT
9.8.1 FOCUS OF ORGANIZATIONS ON MAINTAINING LARGE POOL OF CONTENT WITH LOW CAPEX TO DRIVE THE ADOPTION OF IAAS IN MEDIA AND ENTERTAINMENT VERTICAL
TABLE 59 MEDIA AND ENTERTAINMENT: MARKET SIZE, BY REGION, 2017�2024 (USD BILLION)
9.9 HEALTHCARE AND LIFE SCIENCES
9.9.1 NEED TO STREAMLINE PATIENT HEALTH AND ENHANCE MEDICAL STAFF PRODUCTIVITY DRIVING DEMAND FOR IAAS IN HEALTHCARE AND LIFE SCIENCES VERTICAL
TABLE 60 HEALTHCARE AND LIFE SCIENCES: MARKET SIZE, BY REGION, 2017�2024 (USD BILLION)
9.10 OTHERS
TABLE 61 OTHERS: MARKET SIZE, BY REGION, 2017�2024 (USD BILLION)
10 IAAS MARKET, BY REGION (Page No. - 82)
10.2 INTRODUCTION
FIGURE 13 ASIA PACIFIC TO GROW AT THE HIGHEST GROWTH RATE DURING THE FORECAST PERIOD
TABLE 62 MARKET SIZE, BY REGION, 2017�2024 (USD BILLION)
10.3 NORTH AMERICA
FIGURE 14 NORTH AMERICA: MARKET SNAPSHOT
TABLE 63 NORTH AMERICA: IAAS MARKET SIZE, BY SERVICE TYPE, 2017�2024 (USD BILLION)
TABLE 64 NORTH AMERICA: MARKET SIZE, BY DEPLOYMENT MODEL, 2017�2024 (USD BILLION)
TABLE 65 NORTH AMERICA: MARKET SIZE, BY ORGANIZATION SIZE, 2017�2024 (USD BILLION)
TABLE 66 NORTH AMERICA: MARKET SIZE, BY VERTICAL, 2017�2024 (USD BILLION)
TABLE 67 NORTH AMERICA: MARKET SIZE, BY COUNTRY, 2017�2024 (USD BILLION)
10.3.1 UNITED STATES
10.3.1.1 Deployment of IaaS improve scalability of storage and networks among enterprises fueling the market growth in the US
TABLE 68 UNITED STATES: IAAS MARKET SIZE, BY SERVICE TYPE, 2017�2024 (USD BILLION)
TABLE 69 UNITED STATES: MARKET SIZE, BY DEPLOYMENT MODEL, 2017�2024 (USD BILLION)
TABLE 70 UNITED STATES: MARKET SIZE, BY ORGANIZATION SIZE, 2017�2024 (USD BILLION)
TABLE 71 UNITED STATES: MARKET SIZE, BY VERTICAL, 2017�2024 (USD BILLION)
10.3.2 CANADA
10.3.2.1 Greater flexibility in resource allocation, agility, and scalability to drive the growth of IaaS market in Canada
TABLE 72 CANADA: IAAS MARKET SIZE, BY SERVICE TYPE, 2017�2024 (USD BILLION)
TABLE 73 CANADA: MARKET SIZE, BY DEPLOYMENT MODEL, 2017�2024 (USD BILLION)
TABLE 74 CANADA: MARKET SIZE, BY ORGANIZATION SIZE, 2017�2024 (USD BILLION)
TABLE 75 CANADA: MARKET SIZE, BY VERTICAL, 2017�2024 (USD BILLION)
10.4 EUROPE
TABLE 76 EUROPE: IAAS MARKET SIZE, BY SERVICE TYPE, 2017�2024 (USD BILLION)
TABLE 77 EUROPE: MARKET SIZE, BY DEPLOYMENT MODEL, 2017�2024 (USD BILLION)
TABLE 78 EUROPE: MARKET SIZE, BY ORGANIZATION SIZE, 2017�2024 (USD BILLION)
TABLE 79 EUROPE: MARKET SIZE, BY VERTICAL, 2017�2024 (USD BILLION)
TABLE 80 EUROPE: MARKET SIZE, BY COUNTRY, 2017�2024 (USD BILLION)
10.4.1 UNITED KINGDOM
10.4.1.1 Need to deliver consistent customer service experience driving adoption of IaaS in the UK
TABLE 81 UNITED KINGDOM: IAAS MARKET SIZE, BY SERVICE TYPE, 2017�2024 (USD BILLION)
TABLE 82 UNITED KINGDOM: MARKET SIZE, BY DEPLOYMENT MODEL, 2017�2024 (USD BILLION)
TABLE 83 UNITED KINGDOM: MARKET SIZE, BY ORGANIZATION SIZE, 2017�2024 (USD BILLION)
TABLE 84 UNITED KINGDOM: MARKET SIZE, BY VERTICAL, 2017�2024 (USD BILLION)
10.4.2 REST OF EUROPE
TABLE 85 REST OF EUROPE: IAAS MARKET SIZE, BY SERVICE TYPE, 2017�2024 (USD BILLION)
TABLE 86 REST OF EUROPE: MARKET SIZE, BY DEPLOYMENT MODEL, 2017�2024 (USD BILLION)
TABLE 87 REST OF EUROPE: MARKET SIZE, BY ORGANIZATION SIZE, 2017�2024 (USD BILLION)
TABLE 88 REST OF EUROPE: MARKET SIZE, BY VERTICAL, 2017�2024 (USD BILLION)
10.5 ASIA PACIFIC
FIGURE 15 ASIA PACIFIC: MARKET SNAPSHOT
TABLE 89 ASIA PACIFIC: IAAS MARKET SIZE, BY SERVICE TYPE, 2017�2024 (USD BILLION)
TABLE 90 ASIA PACIFIC: MARKET SIZE, BY DEPLOYMENT MODEL, 2017�2024 (USD BILLION)
TABLE 91 ASIA PACIFIC: MARKET SIZE, BY ORGANIZATION SIZE, 2017�2024 (USD BILLION)
TABLE 92 ASIA PACIFIC: MARKET SIZE, BY VERTICAL, 2017�2024 (USD BILLION)
TABLE 93 ASIA PACIFIC: MARKET SIZE, BY COUNTRY, 2017�2024 (USD BILLION)
10.5.1 CHINA
10.5.1.1 Increasing investments by organizations toward implementing cloud technology-based solutions to fuel adoption of IaaS in China
TABLE 94 CHINA: IAAS MARKET SIZE, BY SERVICE TYPE, 2017�2024 (USD BILLION)
TABLE 95 CHINA: MARKET SIZE, BY DEPLOYMENT MODEL, 2017�2024 (USD BILLION)
TABLE 96 CHINA: MARKET SIZE, BY ORGANIZATION SIZE, 2017�2024 (USD BILLION)
TABLE 97 CHINA: MARKET SIZE, BY VERTICAL, 2017�2024 (USD BILLION)
10.5.2 REST OF ASIA PACIFIC
TABLE 98 REST OF ASIA PACIFIC: IAAS MARKET SIZE, BY SERVICE TYPE, 2017�2024 (USD BILLION)
TABLE 99 REST OF ASIA PACIFIC: MARKET SIZE, BY DEPLOYMENT MODEL, 2017�2024 (USD BILLION)
TABLE 100 REST OF ASIA PACIFIC: MARKET SIZE, BY ORGANIZATION SIZE, 2017�2024 (USD BILLION)
TABLE 101 REST OF ASIA PACIFIC: MARKET SIZE, BY VERTICAL, 2017�2024 (USD BILLION)
10.6 MIDDLE EAST AND AFRICA
TABLE 102 MIDDLE EAST AND AFRICA: IAAS MARKET SIZE, BY SERVICE TYPE, 2017�2024 (USD BILLION)
TABLE 103 MIDDLE EAST AND AFRICA: MARKET SIZE, BY DEPLOYMENT MODEL, 2017�2024 (USD BILLION)
TABLE 104 MIDDLE EAST AND AFRICA: MARKET SIZE, BY ORGANIZATION SIZE, 2017�2024 (USD BILLION)
TABLE 105 MIDDLE EAST AND AFRICA: MARKET SIZE, BY VERTICAL, 2017�2024 (USD BILLION)
TABLE 106 MIDDLE EAST AND AFRICA: MARKET SIZE, BY COUNTRY, 2017�2024 (USD BILLION)
10.6.1 KINGDOM OF SAUDI ARABIA
10.6.1.1 Focus of organizations on lowering costs of IT service operations and enhance efficiency to drive the growth of IaaS market in KSA
TABLE 107 KINGDOM OF SAUDI ARABIA: IAAS MARKET SIZE, BY SERVICE TYPE, 2017�2024 (USD MILLION)
TABLE 108 KINGDOM OF SAUDI ARABIA: MARKET SIZE, BY DEPLOYMENT MODEL, 2017�2024 (USD BILLION)
TABLE 109 KINGDOM OF SAUDI ARABIA: MARKET SIZE, BY ORGANIZATION SIZE, 2017�2024 (USD BILLION)
TABLE 110 KINGDOM OF SAUDI ARABIA: MARKET SIZE, BY VERTICAL, 2017�2024 (USD MILLION)
10.6.2 REST OF MIDDLE EAST AND AFRICA
TABLE 111 REST OF MIDDLE EAST AND AFRICA: IAAS MARKET SIZE, BY SERVICE TYPE, 2017�2024 (USD BILLION)
TABLE 112 REST OF MIDDLE EAST AND AFRICA: MARKET SIZE, BY DEPLOYMENT MODEL, 2017�2024 (USD BILLION)
TABLE 113 REST OF MIDDLE EAST AND AFRICA: MARKET SIZE, BY ORGANIZATION SIZE, 2017�2024 (USD BILLION)
TABLE 114 REST OF MIDDLE EAST AND AFRICA: MARKET SIZE, BY VERTICAL, 2017�2024 (USD MILLION)
10.7 LATIN AMERICA
TABLE 115 LATIN AMERICA: IAAS MARKET SIZE, BY SERVICE TYPE, 2017�2024 (USD BILLION)
TABLE 116 LATIN AMERICA: MARKET SIZE, BY DEPLOYMENT MODEL, 2017�2024 (USD BILLION)
TABLE 117 LATIN AMERICA: MARKET SIZE, BY ORGANIZATION SIZE, 2017�2024 (USD BILLION)
TABLE 118 LATIN AMERICA: MARKET SIZE, BY VERTICAL, 2017�2024 (USD BILLION)
10.7.1 BRAZIL
10.7.1.1 Focus of organizations on reducing CAPEX to drive the growth of IaaS market in Brazil
10.7.2 MEXICO
10.7.2.1 Digital transformation in telecommunication vertical propelling adoption of IaaS in Mexico
10.7.3 REST OF LATIN AMERICA
11 COMPETITIVE LANDSCAPE (Page No. - 113)
11.1 INTRODUCTION
FIGURE 16 KEY DEVELOPMENTS BY THE LEADING PLAYERS IN THE IAAS MARKET DURING 2016�2019
11.2 COMPETITIVE SCENARIO
11.2.1 NEW PRODUCT/SERVICE LAUNCHES
TABLE 119 NEW PRODUCT LAUNCHES, 2018�2019
11.2.2 BUSINESS EXPANSIONS
TABLE 120 BUSINESS EXPANSIONS, 2018�2019
11.2.3 ACQUISITIONS
TABLE 121 ACQUISITIONS, 2016�2019
11.2.4 PARTNERSHIPS
TABLE 122 PARTNERSHIPS, 2018�2019
11.3 COMPETITIVE LEADER MAPPING
11.3.1 VISIONARY LEADERS
11.3.2 INNOVATORS
11.3.3 DYNAMIC DIFFERENTIATORS
11.3.4 EMERGING COMPANIES
FIGURE 17 GLOBAL IAAS MARKET COMPETITIVE LEADERSHIP MAPPING, 2019
12 COMPANY PROFILES (Page No. - 120)
12.1 INTRODUCTION
(Business Overview, Services Offered, Recent Developments, SWOT Analysis and MNM View)*
12.2 AWS
FIGURE 18 AWS: COMPANY SNAPSHOT
FIGURE 19 AWS: SWOT ANALYSIS
12.3 MICROSOFT
FIGURE 20 MICROSOFT: COMPANY SNAPSHOT
FIGURE 21 MICROSOFT: SWOT ANALYSIS
12.4 GOOGLE
FIGURE 22 GOOGLE: COMPANY SNAPSHOT
FIGURE 23 GOOGLE: SWOT ANALYSIS
12.5 IBM
FIGURE 24 IBM: COMPANY SNAPSHOT
FIGURE 25 IBM: SWOT ANALYSIS
12.6 ALIBABA CLOUD
FIGURE 26 ALIBABA CLOUD: COMPANY SNAPSHOT
FIGURE 27 ALIBABA CLOUD: SWOT ANALYSIS
12.7 RACKSPACE
12.8 ORACLE
FIGURE 28 ORACLE: COMPANY SNAPSHOT
12.9 FUJITSU
FIGURE 29 FUJITSU: COMPANY SNAPSHOT
12.10 VMWARE
FIGURE 30 VMWARE: COMPANY SNAPSHOT
12.11 CENTURYLINK
FIGURE 31 CENTURYLINK: COMPANY SNAPSHOT
12.12 DIMENSION DATA
12.13 DXC TECHNOLOGY
FIGURE 32 DXC TECHNOLOGY: COMPANY SNAPSHOT
12.14 VERIZON
FIGURE 33 VERIZON: COMPANY SNAPSHOT
12.15 TENCENT
FIGURE 34 TENCENT: COMPANY SNAPSHOT
12.16 AT&T
FIGURE 35 AT&T: COMPANY SNAPSHOT
12.17 NEC
FIGURE 36 NEC: COMPANY SNAPSHOT
2.18 UNITED PRIVATE CLOUD
12.19 JOYENT
12.20 VIRTUSTREAM
12.21 PROFITBRICKS
12.22 DIGITALOCEAN
12.23 SKYTAP
12.24 OVH
12.25 BLUELOCK
12.26 NAVISITE
*Details on Business Overview, Services Offered, Recent Developments, SWOT Analysis and MNM View might not be captured in case of unlisted companies.
13 APPENDIX (Page No. - 170)
13.1 DISCUSSION GUIDE
13.2 KNOWLEDGE STORE: MARKETSANDMARKETS� SUBSCRIPTION PORTAL
13.3 AVAILABLE CUSTOMIZATIONS
13.4 RELATED REPORTS
13.5 AUTHOR DETAILS
The study involved four major activities in estimating the current market size for the cloud infrastructure services market. Exhaustive secondary research was done to collect information on the cloud infrastructure services market. The next step was to validate these findings, assumptions, and sizing with industry experts across the value chain using primary research. Both top-down and bottom-up approaches were employed to estimate the complete market size. After that, the market breakup and data triangulation procedures were used to estimate the market size of the segments and subsegments of the cloud infrastructure services market.
Secondary Research
In the secondary research process, various secondary sources, such as D&B Hoovers, Bloomberg BusinessWeek, Associations which included Cloud Computing Association, EuroCloud Europe, Asia Cloud Computing Association, and Factiva, have been referred to, to identify and collect information for this study. These secondary sources included annual reports, press releases and investor presentations of companies, whitepapers, certified publications and articles by recognized authors, gold standard and silver standard websites, regulatory bodies, trade directories, and databases.
Primary Research
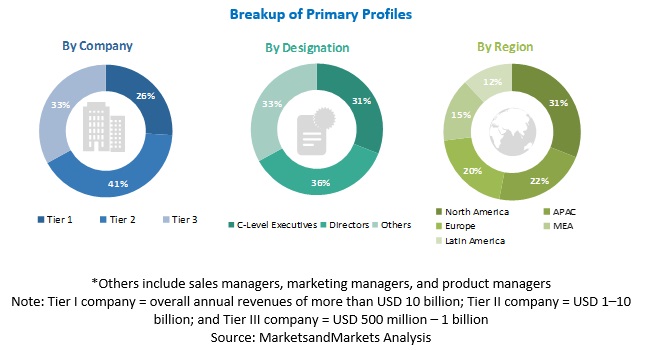
The cloud infrastructure services market comprises several stakeholders, such as IT infrastructure services providers, cloud service brokers, system integrators, consulting service providers, managed service providers, resellers and distributors, research organizations, government agencies, enterprise users, venture capitalists, private equity firms, and startup companies. The demand side of the cloud infrastructure service market consists of enterprises from different industry verticals, such as Banking, Financial Services, and Insurance (BFSI), IT and telecommunications, government and public sector, retail and consumer goods, manufacturing, energy and utilities, media and entertainment, healthcare and life sciences and others (education and travel and hospitality). The supply side includes cloud infrastructure services providers. Various primary sources from both the supply and demand sides of the market were interviewed to obtain qualitative and quantitative information. Following is the breakup of the primary respondents:
To know about the assumptions considered for the study, download the pdf brochure
Market Size Estimation
Both top-down and bottom-up approaches were used to estimate and validate the total size of the cloud infrastructure services market. These methods were also used extensively to determine the extent of various subsegments in the market. The research methodology used to estimate the market size includes the following:
- The key players in the industry and markets have been identified through extensive secondary research.
- The industry�s supply chain and market size, in terms of value, have been determined through primary and secondary research processes.
- All percentage shares split, and breakups have been determined using secondary sources and verified through primary sources.
Data Triangulation
- After arriving at the overall market size using the market size estimation processes as explained above, the
- market was split into several segments and subsegments. To complete the overall market engineering process
- and arrive at the exact statistics of each market segment and subsegments, the data triangulation and market
- breakup procedures were employed, wherever applicable. The data was triangulated by studying various
- factors and trends from both the demand and supply sides.
Report Objectives
- To describe and forecast the cloud infrastructure services market based on service types, deployment models, organization size, verticals, and regions
- To predict the market size of the 5 main regional segments: North America, Europe, Asia Pacific (APAC), Middle East and Africa (MEA), and Latin America
- To analyze subsegments for individual growth trends, prospects, and contribution to the total market
- To provide detailed information about the significant factors influencing the growth of the market (drivers, restraints, opportunities, and challenges)
- To analyze the opportunities in the market for stakeholders and provide details of the competitive landscape for the major players
- To comprehensively analyze the core competencies of the key players
- To track and analyze competitive developments, such as mergers and acquisitions, new product developments, and partnerships and collaborations in the market
Available Customizations
With the given market data, MarketsandMarkets offers customizations based on the company�s specific needs.
Company Information
- Detailed analysis and profiling of additional market players


Growth opportunities and latent adjacency in Cloud Infrastructure Services Market
Looking to launch new service offerings in Cloud Infrastructure Services Market.