Composite Bearings Market by Product Type (Metal Matrix, Fiber Matrix), Application (Construction & Mining, Automotive, Agriculture, Aerospace, Marine), Region - Global Forecast to 2021


[123 Pages Report] on The Composite Bearings Market was valued at USD 3.21 Billion, in 2015, and is projected to reach USD 5.04 Billion by 2021 at a CAGR of 7.88% from 2016 to 2021. Composite bearings are becoming crucial in aerospace, automotive and construction & mining applications due to the light weight & superior properties, low maintenance and long product life. In this study, the years considered to estimate the market size of composite bearings are:
- Base Year � 2015
- Estimated Year � 2016
- Projected Year � 2021
- Forecast Period � 2016 to 2021
2015 has been considered the base year for company profiles. Whenever information was unavailable for the base year, the prior year has been considered.
Objectives of the Study
- To define, describe, and forecast the composite bearings market size, in terms of value
- To identify and measure the composite bearings market by product type, application, and region
- To analyze significant region-specific market trends in North America, Europe, the Asia-Pacific region, Latin America and Middle East & Africa (ME&A) and country-specific trends in the U.S., Canada, Germany, France, the U.K., China, South Korea, and others. To provide detailed information regarding the major factors influencing the growth of the composite bearings market ( drivers, restraints, opportunities, industry-specific challenges, and burning issues)
- To strategically profile and analyze the key market players and their core competencies
- To analyze recent market developments such as agreements, acquisitions, new product launches and expansions in the composite bearings market
Various secondary sources such as company websites, encyclopedias, directories, and databases such as Composite World, Factiva, and American Composites Manufacturers Association and so on have been used to understand and gain insights into the composite bearings market. Experts from top composite bearings companies have been interviewed to verify and collect critical information and to assess the trends in the composite bearings market for the forecast period. The top-down, bottom-up, and data triangulation approaches have been implemented to calculate the exact values of the overall parent and individual market sizes.
To know about the assumptions considered for the study, download the pdf brochure
The composite bearings market has a diversified ecosystem, including downstream stakeholders such as manufacturers, vendors, end users, and government organizations. Some of the major raw material suppliers are, Arkema (France), Mitsubishi Plastics, Inc. (Japan), Formosa Plastics Corporation (Taiwan), SGL Group (Germany), SABIC (Saudi Arabia), Toray Carbon Fibers America Inc. (U.S), Huntsman Corporation (U.S), and others.
The composite bearings value chain includes resin manufacturers such as Arkema (France), Mitsubishi Plastics, Inc. (Japan), Huntsman Corporation (U.S), and others. Carbon fiber manufacturers include SGL Group (Germany), Toray Carbon Fibers America Inc. (U.S), and glass fiber manufacturers include PPG Industries, Inc. (U.S.), Taishan Fiberglass Inc. (China), and others. Further, the manufacturers of composite bearings supply their products to various entities for the aerospace, automotive and agriculture, aerospace and other applications.
This study focuses on the top investment pockets, which would help stakeholders understand and analyze the emerging trends in the composite bearings market. These stakeholders include:
- composite bearings manufacturers
- Raw material suppliers
- Distributors and suppliers
- End-use industries
- Industry associations
- R&D institutions
- Environment support agencies
Scope of the Report:
This research report categorizes the composite bearings market based on product type, application, and region. It forecasts revenue growth and analyzes trends in each of the submarkets till 2021.
On the Basis of Product Type,
- Metal matrix
- Fiber matrix
On the Basis of Application,
- Construction & Mining
- Automotive
- Agriculture
- Aerospace
- Marine
- Others
On the Basis of Region,
- North America
- Europe
- Asia-Pacific
- Middle East & Africa
- Latin America
Available Customizations
With the given market data, MarketsandMarkets offers customizations according to the specific needs of the companies. The following customization options are available for the report:
Product Analysis
- Product matrix, which gives a detailed comparison of the product portfolio of each company
Regional Analysis
- Further breakdown of the North American composite bearings market
- Further breakdown of the European composite bearings market
- Further breakdown of the Asia-Pacific region composite bearings market
- Further breakdown of the Middle Eastern & African composite bearings market
- Further breakdown of the Latin American composite bearings market
Company Information
- Detailed analysis and profiles of additional market players
This report covers composite bearings market which exhibits self-lubricating property. The global composite bearings market is projected to reach USD 5.04 Billion by 2021, at a CAGR of 7.88%, from 2016 to 2021. Superior mechanical properties leading to a long product life with low maintenance costs, and the increasing use of composite bearings in demanding applications are the key factors responsible for the growth of the composite bearings market.
The composite bearings market, by product type, is further segmented into metal matrix and fiber matrix. The metal matrix based composite bearings comprise a major market share owing to their high strength, operational stability in harsh environments and moderate cost. Due to these properties, metal matrix based composite bearings are used in applications including construction & mining, agriculture and automotive, and others.
The major applications in the composite bearings market include construction & mining, automotive, agriculture, aerospace, marine, and others. The agriculture application is the fastest growing application in the composite bearings market. Composite bearings offer various features including being light in weight, dimensional stability and resistance against corrosion, and operational stability at high temperatures in comparison to traditional materials such as single metal bearings, due to which, the usage of composite bearings in the marine, construction & mining and aerospace industries is growing at a high rate.
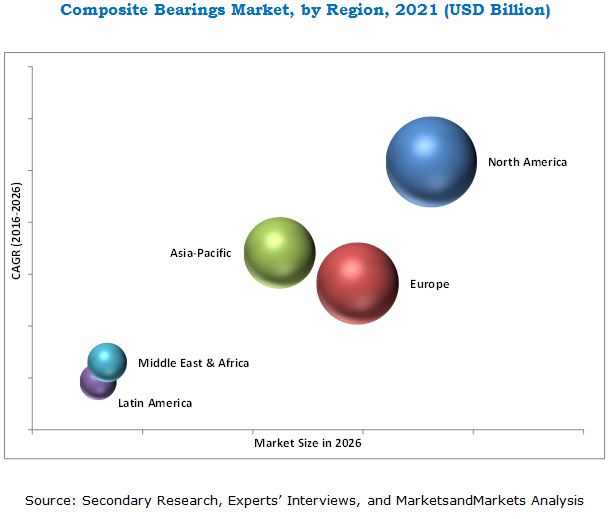
North America is expected to be the fastest-growing market for composite bearings during the next five years. The main factors that are leading to its growth are, the increasing demand from the construction & mining and automotive industries. The various equipment used in the construction & mining industries utilize these advanced bearings as these provide operational stability in harsh environments leading to increased product life, efficiency of the equipment, and low maintenance cost.
The global composite bearings market is rapidly growing, in terms of value. However, a few factors act as restraints in its growth in the global composite bearings market. The high raw material and production cost, and stiff competition from single metal bearings are major restraints in the growth of the global composite bearings market.
Companies such as Schaeffler Group (Germany), Saint Gobain (France), Trelleborg Group (Sweden), RBC Bearings Incorporated (U.S.), Rexnord Corporation (U.S.), Polygon Company (U.S.), HyComp LLC (U.S.), Tiodize Co., Inc. (U.S.), TriStar Plastic Corp. (U.S.), Spaulding Composites (U.S.), and others are the leading market players in the global composite bearings market. They have been adopting various organic and inorganic growth strategies such as agreements, new product launches, acquisitions and expansions to enhance their shares in the global composite bearings market.
To speak to our analyst for a discussion on the above findings, click Speak to Analyst
 Exclusive indicates content/data unique to MarketsandMarkets and not available with any competitors.
Table of Contents
1 Introduction (Page No. - 15)
1.1 Objectives of the Study
1.2 Market Definition
1.3 Market Scope
1.3.1 Markets Covered
1.4 Currency
1.5 Limitations
1.6 Stakeholders
2 Research Methodology (Page No. - 18)
2.1 Research Data
2.1.1 Secondary Data
2.1.1.1 Key Data From Secondary Sources
2.1.2 Primary Data
2.1.2.1 Key Data From Primary Sources
2.1.2.2 Key Industry Insights
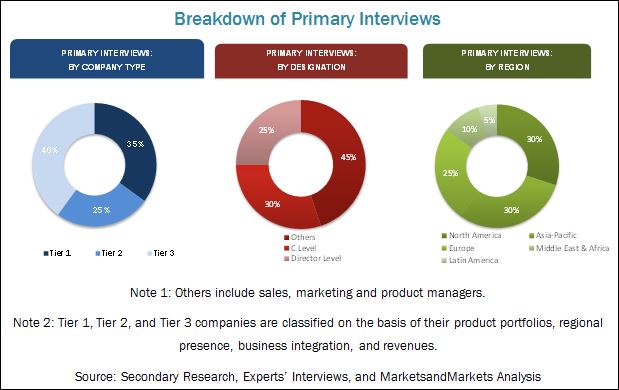
2.1.2.3 Breakdown of Primary Interviews
2.2 Market Size Estimation
2.2.1 Bottom-Up Approach
2.2.2 Top-Down Approach
2.3 Data Triangulation
2.4 Research Assumptions
3 Executive Summary (Page No. - 26)
4 Premium Insights (Page No. - 29)
4.1 Significant Opportunities in the Self-Lubricating Composite Bearings Market
4.2 Self-Lubricating Composite Bearings Market, By Product Type
4.3 Self-Lubricating Composite Bearings Market, By Application and Region
4.4 Self-Lubricating Composite Bearings Market Share, By Country
5 Market Overview (Page No. - 31)
5.1 Introduction
5.2 Market Segmentation
5.2.1 By Product Type
5.2.2 By Application
5.2.3 By Region
5.3 Market Dynamics
5.3.1 Drivers
5.3.1.1 Superior Mechanical Properties
5.3.1.2 Increasing Use of Self-Lubricating Composite Bearing in Demanding Applications
5.3.2 Restraints
5.3.2.1 High Raw Material & Production Cost
5.3.2.2 Stiff Competition From Single Metal Bearings
5.3.3 Opportunities
5.3.3.1 High Demand From Automotive and Agriculture Applications in Emerging Economies
5.3.4 Challenges
5.3.4.1 Need for Low-Cost Technologies
5.4 Porter�s Five Forces Analysis
5.4.1 Threat of New Entrants
5.4.2 Threat of Substitutes
5.4.3 Bargaining Power of Buyers
5.4.4 Bargaining Power of Suppliers
5.4.5 Intensity of Competitive Rivalry
6 Macroeconomic Overview and Key Trends (Page No. - 39)
6.1 Introduction
6.2 Trends and Forecast of GDP
6.3 Per Capita GDP vs Per Capita Self-Lubricating Composite Bearings Demand
6.4 Trends of the Aerospace Industry
6.5 Trends of the Automotive Industry
6.6 Trends of the Construction Industry
7 Self-Lubricating Composite Bearing Market, By Product Type (Page No. - 47)
7.1 Introduction
7.2 Fiber Matrix
7.3 Metal Matrix
8 Self-Lubricating Composite Bearing Market, By Application (Page No. - 51)
8.1 Introduction
8.2 Construction & Mining
8.3 Agriculture
8.4 Automotive
8.4.1 Automobiles
8.4.2 Heavy Vehicles
8.4.3 Rail & Mass Transit
8.5 Aerospace
8.5.1 Interior Components
8.5.2 Exterior Components
8.6 Marine
8.7 Others
9 Regional Analysis (Page No. - 61)
9.1 Introduction
9.2 North America
9.2.1 Self-Lubricating Composite Bearings Market Size in North America, By Product Type
9.2.2 Self-Lubricating Composite Bearings Market Size in North America, By Application
9.2.3 Self-Lubricating Composite Bearings Market Size in North America, By Country
9.2.3.1 U.S.
9.2.3.1.1 Self-Lubricating Composite Bearings Market Size in U.S., By Product Type
9.2.3.1.2 Self-Lubricating Composite Bearings Market Size in U.S., By Application
9.2.3.2 Canada
9.2.3.2.1 Self-Lubricating Composite Bearings Market Size in Canada, By Product Type
9.2.3.2.2 Self-Lubricating Composite Bearings Market Size in Canada, By Application
9.3 Europe
9.3.1 Self-Lubricating Composite Bearings Market Size in Europe, By Product Type
9.3.2 Self-Lubricating Composite Bearings Market Size in Europe, By Application
9.3.3 Self-Lubricating Composite Bearings Market Size in Europe, By Country
9.3.3.1 France
9.3.3.1.1 Self-Lubricating Composite Bearings Market Size in France, By Product Type
9.3.3.1.2 Self-Lubricating Composite Bearings Market Size in France, By Application
9.3.3.2 Germany
9.3.3.2.1 Self-Lubricating Composite Bearings Market Size in Germany, By Product Type
9.3.3.2.2 Self-Lubricating Composite Bearings Market Size in Germany, By Application
9.3.3.3 U.K.
9.3.3.3.1 Self-Lubricating Composite Bearings Market Size in U.K., By Product Type
9.3.3.3.2 Self-Lubricating Composite Bearings Market Size in U.K., By Application
9.3.3.4 Austria
9.3.3.4.1 Self-Lubricating Composite Bearings Market Size in Austria,By Product Type
9.3.3.4.2 Self-Lubricating Composite Bearings Market Size in Austria, By Application
9.3.3.5 Sweden
9.3.3.5.1 Self-Lubricating Composite Bearings Market Size in Sweden, By Product Type
9.3.3.5.2 Self-Lubricating Composite Bearings Market Size in Sweden, By Application
9.3.3.6 Rest of Europe
9.4 Asia-Pacific
9.4.1 Self-Lubricating Composite Bearings Market Size in Asia-Pacific, By Product Type
9.4.2 Self-Lubricating Composite Bearings Market Size in Asia-Pacific, By Application
9.4.2.1 Australia & New Zealand
9.4.2.1.1 Self-Lubricating Composite Bearings Market Size in Australia & New Zealand, By Product Type
9.4.2.1.2 Self-Lubricating Composite Bearings Market Size in Australia & New Zealand, By Application
9.4.2.2 China
9.4.2.2.1 Self-Lubricating Composite Bearings Market Size in China, By Product Type
9.4.2.2.2 Self-Lubricating Composite Bearings Market Size in China, By Application
9.4.2.3 Japan
9.4.2.3.1 Self-Lubricating Composite Bearings Market Size in Japan, By Product Type
9.4.2.3.2 Self-Lubricating Composite Bearings Market Size in Japan, By Application
9.4.2.4 South Korea
9.4.2.4.1 Self-Lubricating Composite Bearings Market Size in South Korea, By Product Type
9.4.2.4.2 Self-Lubricating Composite Bearings Market Size in South Korea, By Application
9.4.2.5 India
9.4.2.5.1 Self-Lubricating Composite Bearings Market Size in India, By Product Type
9.4.2.5.2 Self-Lubricating Composite Bearings Market Size in India, By Application
9.4.2.6 Rest of Asia-Pacific
9.5 Middle East & Africa
9.5.1 Self-Lubricating Composite Bearings Market Size in Middle East & Africa, By Product Type
9.5.2 Self-Lubricating Composite Bearings Market Size in Middle East & Africa, By Application
9.5.3 Self-Lubricating Composite Bearings Market Size in Middle East & Africa, By Country
9.5.3.1 Israel
9.5.3.1.1 Self-Lubricating Composite Bearings Market Size in Israel, By Product Type
9.5.3.1.2 Self-Lubricating Composite Bearings Market Size in Israel, By Application
9.5.3.2 UAE
9.5.3.2.1 Self-Lubricating Composite Bearings Market Size in UAE, By Product Type
9.5.3.2.1 Self-Lubricating Composite Bearings Market Size in UAE, By Application
9.5.3.3 South Africa
9.5.3.3.1 Self-Lubricating Composite Bearings Market Size in South Africa, By Product Type
9.5.3.3.2 Self-Lubricating Composite Bearings Market Size in South Africa, By Application
9.5.3.4 Saudi Arabia
9.5.3.4.1 Self-Lubricating Composite Bearings Market Size in Saudi Arabia, By Product Type
9.5.3.4.2 Self-Lubricating Composite Bearings Market Size in Saudi Arabia, By Application
9.6 Latin America
9.6.1 Self-Lubricating Composite Bearings Market Size in Latin America, By Product Type
9.6.2 Self-Lubricating Composite Bearings Market Size in Latin America, By Application
9.6.3 Self-Lubricating Composite Bearings Market Size in Latin America, By Country
9.6.3.1 Brazil
9.6.3.1.1 Self-Lubricating Composite Bearings Market Size in Brazil, By Product Type
9.6.3.1.2 Self-Lubricating Composite Bearings Market Size in Brazil, By Application
9.6.3.2 Mexico
9.6.3.2.1 Self-Lubricating Composite Bearings Market Size in Mexico, By Product Type
9.6.3.2.2 Self-Lubricating Composite Bearings Market Size in Mexico, By Application
10 Competitive Landscape (Page No. - 94)
10.1 Overview
10.2 Competitive Situation and Trends
10.3 Market Ranking
10.3.1 Market Ranking of Top 5 Players in the Global Self-Lubricating Composite Bearings Market
10.4 Recent Developments
10.4.1 Acquisitions
10.4.2 Expansions
10.4.3 New Product Launches
10.4.4 Agreements
11 Company Profiles (Page No. - 99)
(Overview, Financials, Products & Services, Strategy, and Developments)*
11.1 Saint-Gobain S.A.
11.2 Trelleborg Group
11.3 Schaeffler Group
11.4 Polygon Company
11.5 RBC Bearings Incorporated.
11.6 Rexnord Corporation
11.7 Hycomp LLC
11.8 Tristar Plastic Corp.
11.9 Tiodize Co., Inc.
11.10 Spaulding Composites, Inc.
*Details on Overview, Financials, Product & Services, Strategy, and Developments Might Not Be Captured in Case of Unlisted Companies.
11.11 Other Key Players
11.11.1 CIP Composites
11.11.2 AST Bearings LLC
11.11.3 Franklin Fiber Lamitex
11.11.4 ACM Composites
11.11.5 Technoslide (Pty) Ltd
11.11.6 GGB Bearing Technology
11.11.7 CSB Sliding Bearings (India) Pvt. Ltd.
11.11.8 Federal-Mogul Corporation
11.11.9 VNC Bearing
11.11.10 H4 Marine Limited
12 Appendix (Page No. - 116)
12.1 Insights From Industry Experts
12.2 Discussion Guide
12.3 Knowledge Store: Marketsandmarkets Subscription Portal
12.4 Introducing RT: Real-Time Market Intelligence
12.5 Available Customizations
12.6 Related Reports
12.7 Author Details
List of Tables (74 Tables)
Table 1 Self-Lubricating Composite Bearings Market, By Product Type
Table 2 Self-Lubricating Composite Bearings Market, By Application
Table 3 Self-Lubricating Composite Bearings Market, By Region
Table 4 Trends and Forecast of GDP, 2015�2021 (USD Billion)
Table 5 Per Capita GDP vs Per Capita Self-Lubricating Composite Bearings Demand, 2015
Table 6 Number of New Airplane Deliveries, By Region
Table 7 Automotive Production, Million Units (2011�2015)
Table 8 Contribution of Construction Industry to GDP, By Country, USD Billion (2014�2021)
Table 9 Self-Lubricating Composite Bearing Market Size, By Product Type, 2014�2026 (USD Million)
Table 10 Fiber Matrix-Based Self-Lubricating Composite Bearing Market Size, By Region, 2014�2021 (USD Million)
Table 11 Metal Matrix-Based Self-Lubricating Composite Bearing Market Size, By Region, 2014�2021 (USD Million)
Table 12 Self-Lubricating Composite Bearings Market Size, By Application, 2014�2021 (USD Million)
Table 13 Self-Lubricating Composite Bearings Market Size in Construction & Mining Application, By Region, 2014�2021 (USD Million)
Table 14 Self-Lubricating Composite Bearings Market Size in Agriculture Application, By Region, 2014�2021 (USD Million)
Table 15 Self-Lubricating Composite Bearings Market Size in Automotive Application, By Region, 2014�2021 (USD Million)
Table 16 Self-Lubricating Composite Bearings Market Size in Aerospace Application, By Region, 2014�2021 (USD Million)
Table 17 Self-Lubricating Composite Bearings Market Size in Marine Application, By Region, 2014�2021 (USD Million)
Table 18 Self-Lubricating Composite Bearings Market Size in Other Applications, By Region, 2014�2021(USD Million)
Table 19 Self-Lubricating Composite Bearings Market Size, By Region, 2014�2021 (USD Million)
Table 20 North America: Self-Lubricating Composite Bearings Market Size, By Product Type, 2014�2021 (USD Million)
Table 21 North America: Self-Lubricating Composite Bearings Market Size, By Application, 2014�2021 (USD Million)
Table 22 North America: Self-Lubricating Composite Bearings Market Size, By Country, 2014�2021 (USD Million)
Table 23 U.S.: Self-Lubricating Composite Bearings Market Size, By Product Type, 2014�2021 (USD Million)
Table 24 U.S.: Self-Lubricating Composite Bearings Market Size, By Application, 2014�2021 (USD Million)
Table 25 Canada: Self-Lubricating Composite Bearings Market Size, By Product Type, 2014�2021 (USD Million)
Table 26 Canada: Self-Lubricating Composite Bearings Market Size, By Application, 2014�2021 (USD Million)
Table 27 Europe: Self-Lubricating Composite Bearings Market Size, By Product Type, 2014�2021 (USD Million)
Table 28 Europe: Self-Lubricating Composite Bearings Market Size, By Application, 2014�2021 (USD Million)
Table 29 Europe: Self-Lubricating Composite Bearings Market Size, By Application, 2014�2021 (USD Million)
Table 30 France: Self-Lubricating Composite Bearings Market Size, By Product Type, 2014�2021 (USD Million)
Table 31 France: Self-Lubricating Composite Bearings Market Size, By Application, 2014�2021 (USD Million)
Table 32 Germany: Self-Lubricating Composite Bearings Market Size, By Product Type, 2014�2021 (USD Million)
Table 33 Germany: Self-Lubricating Composite Bearings Market Size, By Application, 2014�2021 (USD Million)
Table 34 U.K.: Self-Lubricating Composite Bearings Market Size, By Product Type, 2014�2021 (USD Million)
Table 35 U.K.: Self-Lubricating Composite Bearings Market Size, By Application, 2014�2021 (USD Million)
Table 36 Austria: Self-Lubricating Composite Bearings Market Size, By Product Type, 2014�2021 (USD Million)
Table 37 Austria: Self-Lubricating Composite Bearings Market Size, By Application, 2014�2021 (USD Million)
Table 38 Sweden: Self-Lubricating Composite Bearings Market Size, By Product Type, 2014�2021 (USD Million)
Table 39 Sweden: Self-Lubricating Composite Bearings Market Size, By Application, 2014�2021 (USD Million)
Table 40 Asia-Pacific: Self-Lubricating Composite Bearings Market Size, By Product Type, 2014�2021 (USD Million)
Table 41 Asia-Pacific: Self-Lubricating Composite Bearings Market Size, By Application, 2014�2021 (USD Million)
Table 42 Asia-Pacific: Self-Lubricating Composite Bearings Market Size, By Country, 2014�2021 (USD Million)
Table 43 Australia & New Zealand: Self-Lubricating Composite Bearings Market Size, By Product Type, 2014�2021 (USD Million)
Table 44 Australia & New Zealand: Self-Lubricating Composite Bearings Market Size, By Application, 2014�2021 (USD Million)
Table 45 China: Self-Lubricating Composite Bearings Market Size, By Product Type, 2014�2021 (USD Million)
Table 46 China: Self-Lubricating Composite Bearings Market Size, By Application, 2014�2021 (USD Million)
Table 47 Japan: Self-Lubricating Composite Bearings Market Size, By Product Type, 2014�2021 (USD Million)
Table 48 Japan: Self-Lubricating Composite Bearings Market Size, By Application, 2014�2021 (USD Million)
Table 49 South Korea: Self-Lubricating Composite Bearings Market Size, By Product Type, 2014�2021 (USD Million)
Table 50 South Korea: Self-Lubricating Composite Bearings Market Size, By Application, 2014�2021 (USD Million)
Table 51 India: Self-Lubricating Composite Bearings Market Size, By Product Type, 2014�2021 (USD Million)
Table 52 India: Self-Lubricating Composite Bearings Market Size, By Application, 2014�2021 (USD Million)
Table 53 Middle East & Africa: Self-Lubricating Composite Bearings Market Size, By Product Type, 2014�2021 (USD Million)
Table 54 Middle East & Africa: Self-Lubricating Composite Bearings Market Size, By Application, 2014�2021 (USD Million)
Table 55 Middle East & Africa: Self-Lubricating Composite Bearings Market Size, By Country, 2014�2021 (USD Million)
Table 56 Israel: Self-Lubricating Composite Bearings Market Size, By Product Type, 2014�2021 (USD Million)
Table 57 Israel: Self-Lubricating Composite Bearings Market Size, By Application, 2014�2021 (USD Million)
Table 58 UAE: Self-Lubricating Composite Bearings Market Size, By Product Type, 2014�2021 (USD Million)
Table 59 UAE: Self-Lubricating Composite Bearings Market Size, By Application, 2014�2021 (USD Million)
Table 60 South Africa: Self-Lubricating Composite Bearings Market Size, By Product Type, 2014�2021 (USD Million)
Table 61 South Africa: Self-Lubricating Composite Bearings Market Size, By Application, 2014�2021 (USD Million)
Table 62 Saudi Arabia: Self-Lubricating Composite Bearings Market Size, By Product Type, 2014�2021 (USD Million)
Table 63 Saudi Arabia: Self-Lubricating Composite Bearings Market Size, By Application, 2014�2021 (USD Million)
Table 64 Latin America: Self-Lubricating Composite Bearings Market Size, By Product Type, 2014�2021 (USD Million)
Table 65 Latin America: Self-Lubricating Composite Bearings Market Size, By Application, 2014�2021 (USD Million)
Table 66 Latin America: Self-Lubricating Composite Bearings Market Size, By Country, 2014�2021 (USD Million)
Table 67 Brazil: Self-Lubricating Composite Bearings Market Size, By Product Type, 2014�2021 (USD Million)
Table 68 Brazil: Self-Lubricating Composite Bearings Market Size, By Application, 2014�2021 (USD Million)
Table 69 Mexico: Self-Lubricating Composite Bearings Market Size, By Product Type, 2014�2021 (USD Million)
Table 70 Mexico: Self-Lubricating Composite Bearings Market Size, By Application, 2014�2021 (USD Million)
Table 71 Acquisitions, 2011�2016
Table 72 Expansions, 2011�2016
Table 73 New Product Launches, 2011�2016
Table 74 Agreements, 2011�2016
List of Figures (46 Figures)
Figure 1 Self-Lubricating Composite Bearings: Market Segmentation
Figure 2 Years Considered for the Study
Figure 3 Self-Lubricating Composite Bearings Market: Research Design
Figure 4 Breakdown of Primary Interviews
Figure 5 Bottom-Up Approach
Figure 6 Top-Down Approach
Figure 7 Self-Lubricating Composite Bearings: Data Triangulation
Figure 8 Assumptions
Figure 9 Construction & Mining Application to Drive the Self-Lubricating Composite Bearings Market, Between 2016 and 2021
Figure 10 Fiber Matrix-Based Composite Bearings to Register the Highest CAGR Between 2016 vs 2021
Figure 11 North America Was the Largest Self-Lubricating Composite Bearings Market in 2015
Figure 12 Attractive Market Opportunities in the Self-Lubricating Composite Bearings Market, Between 2016 and 2021
Figure 13 Metal Matrix-Based Composite Bearings to Dominate the Self-Lubricating Composite Bearings Market
Figure 14 North America Dominated the Self-Lubricating Composite Bearings Market in 2015
Figure 15 U.S. Accounted for A Major Share of the Global Self-Lubricating Composite Bearings Market in 2015
Figure 16 Drivers, Restraints, Opportunities, and Challenges of the Self-Lubricating Composite Bearings Market
Figure 17 Porter�s Five Forces Analysis of the Self-Lubricating Composite Bearings Market
Figure 18 Relative GDP Growth Scenario of Key Economies
Figure 19 Per Capita GDP vs Per Capita Self-Lubricating Composite Bearings Demand
Figure 20 New Airplane Deliveries, By Region, 2015�2034
Figure 21 Automotive Production in Key Countries, Million Units (2011 vs 2015)
Figure 22 Construction Industry in Asia-Pacific to Contribute the Maximum to the GDP, USD Billion, 2016 vs 2021
Figure 23 Metal Matrix-Based Self-Lubricating Composite Bearings to Dominate the Market
Figure 24 North America to Dominate the Fiber Matrix Based Self-Lubricating Composite Bearing Market
Figure 25 North America to Lead the Metal Matrix-Based Self-Lubricating Composite Bearing Market, 2016�2021
Figure 26 Construction & Mining Application to Lead the Self-Lubricating Composite Bearings Market
Figure 27 North America to Dominate the Self-Lubricating Composite Bearings Market in Construction & Mining Application
Figure 28 North America to Register Highest CAGR in Self-Lubricating Composite Bearings Market in Agricultural Application
Figure 29 North America to Register Highest CAGR in Self-Lubricating Composite Bearings Market in Automotive Application
Figure 30 U.S. and Canada are the Leading Self-Lubricating Composite Bearings Market
Figure 31 North America Self-Lubricating Composite Bearings Market Snapshot: U.S. is the Most Lucrative Market
Figure 32 Europe Self-Lubricating Composite Bearings Market Snapshot: France is the Most Lucrative Market
Figure 33 Asia-Pacific Self-Lubricating Composite Bearings Market Snapshot: China is the Largest Market
Figure 34 Saudi Arabia is the Most Lucrative Market
Figure 35 Brazil is the Most Lucrative Market
Figure 36 Expansions are the Most Preferred Growth Strategy Adopted By Key Market Players
Figure 37 Market Development Matrix: Maximum Number of Developments Witnessed in 2016
Figure 38 Saint Gobain S.A.: Company Snapshot
Figure 39 Saint-Gobain S.A.: SWOT Analysis
Figure 40 Trelleborg Group: Company Snapshot
Figure 41 Trelleborg Group: SWOT Analysis
Figure 42 Schaeffler Group: Company Snapshot
Figure 43 Schaeffler Group: SWOT Analysis
Figure 44 RBC Bearings Incorporated.: Company Snapshot
Figure 45 RBC Bearings, Inc.: SWOT Analysis
Figure 46 Rexnord: Company Snapshot


Growth opportunities and latent adjacency in Composite Bearings Market