Concentrated Photovoltaic Market By Concentration levels (High and Low), By Technology (Refractor and Reflectors), By Application (Utility-Scale, Commercial, and Others) & By Geography- Global Trends and Forecast to 2019


[167 Pages Report] This report estimates the concentrated photovoltaic market in terms of value. The global market is segmented based on their concentration levels, which include high, medium, and low. The market is further segmented on the basis of regions such as Asia-Pacific, Europe, the Middle East & Africa, and Americas as well as on the basis of technologies such as refractors and reflectors. This has been further split into major countries for the respective geographies.
The global concentrated photovoltaic market is witnessing a strong growth due to the awareness of renewable energy resources in Asia-Pacific the Middle East and Africa, Europe, and Americas. The increase in the importance of renewable energy resources and high efficiency output, with low cost, in the market stream is one of the key drivers of this market.
We have used various secondary sources such as encyclopedias, directories, and databases to identify and collect information that was useful for the extensive commercial study of the global concentrated photovoltaic market. The primary sources, experts, manufacturing organizations, service providers, and end-users from the industry, have all been interviewed to obtain and verify critical information as well as to assess the future growth prospects.
We have also profiled the leading players of this industry, along with their recent developments and other strategic industry activities. Some of these include: Amonix (U.S.), Soitec (France), Isofoton (U.S.), Semprius (U.S.), Solar Junction (U.S.), SunPower Corporations (U.S.), Suncor (U.S.), SolarSystems (Australia), Zytech Solar (Spain), Magpower (Portugal), and Ravano Green Powers (Italy).
This report also touches upon various important aspects of the market. These include analysis of the value chain, cost-break up analysis, drivers, restraints, burning issues, winning imperatives, opportunities, Porter�s Five Forces model, and the competitive landscape. In addition to this, 11 key players of this market have also been profiled.
The global concentrated photovoltaic market is expected to be a major market in renewable sector by 2019, with a projected CAGR of 13.9%, signifying a demand for concentrated photovoltaic installations across the world.
The concentrated photovoltaic market is at various stages of development, thus, opportunities are diverse across regions. In the emerging economies such as Europe and the Middle East and Africa, the market is set to accelerate the use of renewable energy resource activities. In 2011, concentrated photovoltaic accounted for a small part of around 0.1 percent of the solar market; a new technology in the renewable energy market. Due to its high output efficiency and rapid deployment solutions, it is expected to grow rapidly in the coming years. Concentrated photovoltaic differs from conventional photovoltaic technology as it uses lenses to concentrate a large amount of sunlight onto a small area of solar photovoltaic cells to generate electricity. The concept of concentrating sun rays to generate electricity makes concentrated photovoltaic more efficient than the conventional photovoltaic when used for the same area.
HCPV dominates the market
HCPV dominated the concentrated photovoltaic market and accounted for almost 93.4% of the total share in 2013. It is expected to witness a strong growth due to the increased dedicated approach, on the part of the industry, for better efficiency output. The biggest market for HCPV is Asia-Pacific, followed by Americas, Europe, and the Middle East and Africa.
Concentrated Photovoltaic Market Share (Value), by Concentration, 2013
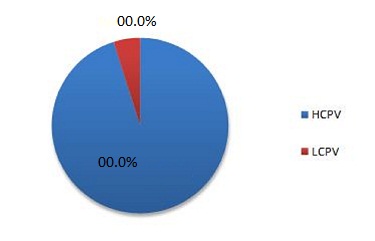
Source: Expert Interviews, Related Research, and MarketsandMarkets Analysis
The key companies in the concentrated photovoltaic market are Amonix (U.S.), Soitec (France), Isofoton (U.S.), Semprius (U.S.), Solar Junction (U.S.), Sunpower Corporations (U.S.), Suncore (U.S.), SolarSystems (Australia), Zytech Solar (Spain), Magpower (Portugal), and Ravano Green Powers (Italy).
Acquisitions and Contracts & Agreements: Key Strategy
The leading companies of the market focus on the growth of their acquisitions and contracts & agreements with the key objective to serve the various industry sectors with a wide geographic presence. The leading companies have been able to acquire regional concentrated photovoltaic providers in order to expand their range of operations. They constantly focus on the emerging regions to establish themselves as the leading concentrated photovoltaic companies.
 Exclusive indicates content/data unique to MarketsandMarkets and not available with any competitors.
Table Of Contents
1 Introduction (Page No. - 14)
1.1 Objectives
1.2 Analyst Insights
1.3 Market Investment Analysis
1.4 Report Description
1.5 Market Definitions
1.6 Market Segmentation & Market Aspects Covered
1.7 Stakeholders
1.8 Research Methodology
1.8.1 Approach
1.8.2 Market Size Estimation
1.8.3 Market Breakdown & Data Triangulation
1.8.4 Key Data From Secondary Sources
1.8.5 Key Secondary Sources Used
1.8.6 Key Data From Primary Sources
1.8.7 Assumptions Made For This Report
2 Executive Summary (Page No. - 27)
3 Market Overview (Page No. - 29)
3.1 Introduction
3.1.1 History & Evolution
3.2 Market Definition
3.3 Market Segmentation
3.3.1 On Basis of Technology
3.3.1.1 Reflector
3.3.1.1.1 Parabolic Mirror
3.3.1.1.2 Reflector
3.3.1.2 Refractor
3.3.1.2.1 Fresnel Lens
3.3.1.2.2 Luminescent Concentrators
3.3.2 On Basis of Concentrated Level
3.3.2.1 High Concentrated Photovoltaic
3.3.2.2 Low Concentrated Photovoltaic
3.3.3 On Basis of Application
3.3.3.1 Utility-Scale
3.3.3.2 Commercial
3.3.3.3 Others
3.3.4 On Basis of Geography
3.4 Market Dynamics
3.4.1 Market Drivers
3.4.1.1 Renewable Energy Resources
3.4.1.2 Higher Efficiency With Low System Cost
3.4.1.3 Less Land Requirement
3.4.2 Market Restraints
3.4.2.1 Limited Locations With High Direct Normal Irradiation
3.4.2.2 Lack of Acceptance of Technology
3.4.3 Market Opportunities
3.4.3.1 Big Players Are Moving Into Cpv Markets
3.4.3.2 Vast Project Pipeline
3.4.4 Burning Issues
3.4.4.1 Bankruptcy
3.4.4.2 Lack of Bankability
3.4.5 Winning Imperatives
3.4.5.1 Technology Advancement
3.5 Value Chain Analysis
3.5.1 Introduction
3.5.1.1 Raw Material Resources
3.5.1.2 Cpv Component Supplier
3.5.1.3 Cpv Module Manufacturer
3.5.1.4 Cpv Developer
3.5.1.5 Cpv Plant
3.5.1.6 End-Users
3.6 Porter�s Five Forces Analysis
3.6.1 Power of Suppliers
3.6.2 Power of Buyers
3.6.3 Threat of New Entrants
3.6.4 Threat of Substitutes
3.6.5 Degree of Competition
4 Premium Insights (Page No. - 48)
4.1 Introduction
4.2 Asia-Pacific Region Dominates The Market For Types
4.3 High Concentrated Photovoltaic Lead The Global Market, 2013-2019
4.4 Concentrated Photovoltaic Market: Regional Scenario, 2013
4.5 Market Estimation & Growth Analysis, 2013
4.6 Concentrated Photovoltaic Market Share, 2013 & 2019
5 Concentrated Photovoltaic- Cost Analysis (Page No. - 57)
5.1 Concentrated Photovoltaic � Cost Breakdown of High Concentrated Photovoltaic Components
5.2 Cost Breakdown of High Concentrated Photovoltaic Components
6 Concentrated Photovoltaic Market, By Technology (Page No. - 61)
6.1 Introduction
6.2 Global Concentrated Market, By Technology
6.3 Americas
6.4 Europe
6.5 Middle East & Africa
6.6 Asia-Pacific
7 Concentrated Photovoltaic Market, By Concentration Level (Page No. - 71)
7.1 Introduction
7.2 Global Concentrated Market, By Concentration Level
7.2.1 Americas Market, By Concentration Level
7.2.2 Europe Market Size, By Concentration Level
7.2.3 Middle East & Africa Market Size, By Concentration Level
7.2.4 Asia-Pacific Market Size, By Concentration Level
8 Concentrated Photovoltaic Market, By Application (Page No. - 81)
8.1 Introduction
8.2 Global Concentrated Market, By Application
8.2.1 Utility-Scale
8.2.2 Commercial Application
8.2.3 Others
9 Concentrated Photovoltaic Market, By Geography (Page No. - 90)
9.1 Introduction
9.2 Concentrated Market, By Geography
9.3 Asia-Pacific
9.3.1 Industry Trend
9.3.2 Supporting Measures
9.3.2.1 Golden Sun Program
9.3.2.2 The Bipv Subsidiary Program
9.3.2.3 The Solar City Program
9.3.2.4 The Solar Homes and Communities Plan
9.3.2.5 Feed-In Tariffs in Taiwan
9.4 Europe
9.4.1 Industry Trend
9.4.2 Supporting Measures
9.4.2.1 Feed-in Tariff For Solar Power
9.4.2.2 Net Metering (Scambio Sul Posto)
9.4.2.3 Grenelle Environmental Plan
9.4.2.4 Feed-in Tariff For Solar Photovoltaic
9.5 Middle East & Africa
9.5.1 Industry Trend
9.6 Americas
9.6.1 Industry Trend
9.6.2 Supporting Measures
9.6.2.1 Sunshot Initiative
9.6.2.2 Solar America Initiative
10 Competitive Landscape Key Findings (Page No. - 108)
10.1 Introduction
10.2 Key Players of The Concentrated Photovoltaic Market
10.2.1 List of Key Players
10.3 Contracts & Agreements Leads The Way
10.4 Market Share Analysis & Rankings
10.4.1 Markets Share, By Annual Installed Capacity
10.5 Contracts & Agreements
10.6 Mergers & Acquisitions
10.7 Other Developments
11 Company Profiles (Page No. - 125)
11.1 Amonix
11.1.1 Introduction
11.1.2 Products & Services
11.1.3 Strategy & Insights
11.1.4 Developments
11.1.5 SWOT Analysis
11.1.6 MNM View
11.2 Isofoton S.A.
11.2.1 Introduction
11.2.2 Products & Services
11.2.3 Developments
11.3 Magpower
11.3.1 Introduction
11.3.2 Products
11.3.3 Strategy & Insights
11.3.4 Developments
11.4 Ravano Green Powers
11.4.1 Introduction
11.4.2 Products & Services
11.4.3 Strategy & Insights
11.4.4 Developments
11.5 Semprius Inc.
11.5.1 Introduction
11.5.2 Product & Service
11.5.3 Developments
11.5.4 SWOT Analysis
11.5.5 MNM View
11.6 Soitec
11.6.1 Introduction
11.6.2 Products & Services
11.6.3 Strategy & Insights
11.6.4 Developments
11.6.5 SWOT Analysis
11.6.6 MNM View
11.7 Solar Junction
11.7.1 Introduction
11.7.2 Products & Services
11.7.3 Strategy & Insights
11.7.4 Developments
11.8 Solarsystem
11.8.1 Introduction
11.8.2 Products & Services
11.8.3 Strategy & Insights
11.8.4 Development
11.8.5 SWOT Analysis
11.8.6 MNM View
11.9 Suncore Photovoltaic Technology Co. Ltd.
11.9.1 Introduction
11.9.2 Products & Services
11.9.3 Strategy & Insights
11.9.4 Developments
11.10 Sunpower Corporation
11.10.1 Introduction
11.10.2 Products & Services
11.10.3 Strategy & Insights
11.10.4 Developments
11.10.5 SWOT Analysis
11.10.6 MNM View
11.11 Zytech Solar
11.11.1 Introduction
11.11.2 Products & Services
11.11.3 Strategy & Insights
11.11.4 Developments
List of Tables (57 Tables)
Table 1 Historic Investments
Table 2 Cost Breakdown of High Concentrated Photovoltaic Components, 2013 & 2019
Table 3 Cost Breakdown of Low Concentrated Photovoltaic Components
Table 4 Market Size, By Technology, 2012-2019 ($Million)
Table 5 Market Size, By Technology, 2012-2019 (Mw)
Table 6 Americas: Market Size, By Technology, 2012-2019 ($Million)
Table 7 Americas: Market Size, By Technology, 2012-2019 (Mw)
Table 8 Europe: Market Size, By Technology, 2012-2019 ($Million)
Table 9 Europe: Market Size, By Technology, 2012-2019 (Mw)
Table 10 Middle East & Africa: Market Size, By Technology, 2012-2019 ($Million)
Table 11 Middle East & Africa: Market Size, By Technology, 2012-2019 (Mw)
Table 12 Asia-Pacific: Market Size, By Technology, 2012-2019 ($Million)
Table 13 Asia-Pacific: Market Size, By Technology, 2012-2019 (Mw)
Table 14 Market Size, By Concentration Level, 2012-2019 ($Million)
Table 15 Concentrated Photovoltaic Market Size, By Concentration Level, 2012-2019 (Mw)
Table 16 Americas: Market Size, By Concentration Level, 2012-2019 ($Million)
Table 17 Americas: Market, By Concentration Level, 2012-2019 (Mw)
Table 18 Europe: Market Size, By Concentration Level, 2012-2019 ($Million)
Table 19 Europe: Market Size, By Concentration Level, 2012-2019 (Mw)
Table 20 Middle East & Africa: Market Size, By Concentration Level, 2012-2019 ($Million)
Table 21 Middle East & Africa: Market Size, By Concentration Level, 2012-2019 (Mw)
Table 22 Asia-Pacific: Market, By Concentration Level, 2012-2019 ($Million)
Table 23 Asia-Pacific: Market Size, By Concentration Level, 2012-2019 (Mw)
Table 24 Concentrated Photovoltaic Market Size, By Application, 2012-2019 ($Million)
Table 25 Concentrated Photovoltaic Market Size, By Application, 2012-2019 (Mw)
Table 26 Utility-Scale Concentrated Photovoltaic Market Size, By Region, 2012-2019 ($Million)
Table 27 Utility-Scale Market Size, By Region, 2012-2019 (Mw)
Table 28 Commercial Concentrated Photovoltaic Market Size, By Region, 2012-2019 ($Million)
Table 29 C0mmercial Market Size, By Region, 2012-2019 (Mw)
Table 30 �Others� Concentrated Photovoltaic Market Size, By Region, 2012-2019 ($Million)
Table 31 �Others� Market Size, By Region, 2012-2019 (Mw)
Table 32 Concentrated Photovoltaic Market Size, By Geography, 2012-2019 ($Million)
Table 33 Concentrated Photovoltaic Market Size,By Geography, 2012-2019 (Mw)
Table 34 Asia-Pacific: Concentrated Photovoltaic Market Size, By Country, 2012-2019 ($Million)
Table 35 Asia-Pacific: Concentrated Photovoltaic Market Size, By Country, 2012-2019 (Mw)
Table 36 Taiwan: Renewable Power Feed in Tariff, 2011
Table 37 Taiwan: Solar Photovoltaic Feed in Tariff, 2012 & 2013
Table 38 Europe:Market Size, By Country, 2012-2019 ($Million)
Table 39 Europe:Market Size, By Country, 2012-2019 (Mw)
Table 40 Middle East & Africa: Concentrated Photovoltaic Market Size, By Country, 2012-2019 ($Million)
Table 41 Middle East & Africa: Concentrated Photovoltaic Market Size, By Country, 2012-2019 (Mw)
Table 42 Americas: Market Size, By Country, 2012-2019 ($Million)
Table 43 Americas: Market Size, By Country, 2012-2019 (Mw)
Table 44 Annual Contracts & Agreements
Table 45 Annual Mergers & Acquisitions
Table 46 Annual Other Development
Table 47 Amonix: Product & Services
Table 48 Isofoton S.A.: Product & Services
Table 49 Magpower: Products
Table 50 Ravano Green Powers: Product & Services
Table 51 Semprius Inc.: Product
Table 52 Semprius Inc.: Product & Services
Table 53 Solar Junction: Product & Services
Table 54 Solarsystem: Product & Services
Table 55 Suncore Photovoltaic Technology Co. Ltd.: Product & Services
Table 56 Sunpower Corporation: Products
Table 57 Zytech Solar: Product & Services
List of Figures (31 Figures)
Figure 1 Research Methodology
Figure 2 Data Triangulation Methodology
Figure 3 Market Size, By Geography, 2012-2019 ($Million)
Figure 4 Market Overview: Concentrated Photovoltaic Market
Figure 5 Evolution of Cpv
Figure 6 Market Segmentation: Concentrated Photovoltaic Market
Figure 7 Value Chain Analysis of Market
Figure 8 Porters� Five Forces Analysis
Figure 9 Market Size (Value), By Type: 2013 & 2019
Figure 10 Market: Regional Scenario, 2012-2019
Figure 11 Market Share (Value): By Type, 2013 & 2019
Figure 12 Market Share (Value): Regional Scenario, 2013
Figure 13 Market Size, By Geography, 2014-2019 (Cagr %)
Figure 14 Market Share: By Geography, 2013 & 2019
Figure 15 Concentrated Technologies Market Share (Value), 2013
Figure 16 Cost Breakdown of High Concentrated Photovoltaic Components
Figure 17 Cost Breakdown of Low Concentrated Photovoltaic Components
Figure 18 Global Market Share (Value), By Technology,2013
Figure 19 Global Market Share (Value), By Concentration Level, 2013
Figure 20 Global Market Share(Value), By Application, 2013
Figure 21 Global Market Share (Value), 2013
Figure 22 Market Share, By Growth Strategies, 2007-2014
Figure 23 Market Share Analysis, By Annual Installed Capacity, 2013
Figure 24 Annual Contracts & Agreements 2011-2013
Figure 25 Annual Mergers & Aquisitions, 2011-2014
Figure 26 Annual Other Developments, 2010-2014
Figure 27 SWOT Analysis : Amonix
Figure 28 SWOT Analysis: Semprius Inc.
Figure 29 SWOT Analysis: Soitec
Figure 30 SWOT Analysis: Solarsystem
Figure 31 SWOT Analysis: Sunpower Corporation


Growth opportunities and latent adjacency in Concentrated Photovoltaic Market