
Crystal Oscillator Market Size, Share and Trends, 2025 To 2030

Crystal Oscillator Market by Mounting Scheme (Surface Mount, Through Hole), General Circuitry (SPXO,VCXO (TCVCXO, OCVCXO), TCXO, OCXO (DOCXO, EMXO), FCXO), Crystal Cut (AT-cut, BT-cut, SC-cut) - Global Forecast to 2030


OVERVIEW
Source: Secondary Research, Interviews with Experts, MarketsandMarkets Analysis
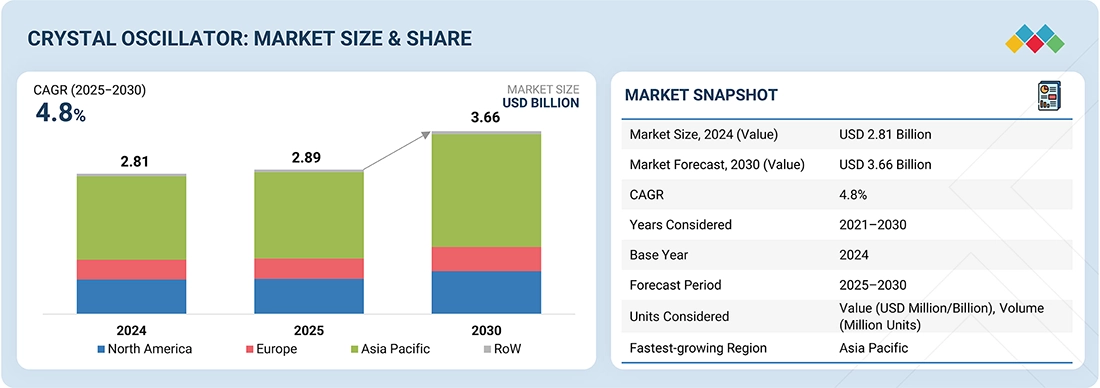
The global crystal oscillator market is anticipated to grow from USD 2.89 billion in 2025 to USD 3.66 billion by 2030, at a CAGR of 4.8% over the forecast period. Drivers for the industry include the growing adoption of sophisticated automotive electronics. These technologies utilize crystal oscillators, wireless communications for automotive applications, remote keyless entry, around-view monitor/camera systems, instrument clusters/clocks, electric stability control on brake units, airbag ECUs, and advanced driver assistance systems (ADAS). Crystal oscillators are thus becoming vital components of cars as they become more complex and electronic systems become more integrated.
KEY TAKEAWAYS
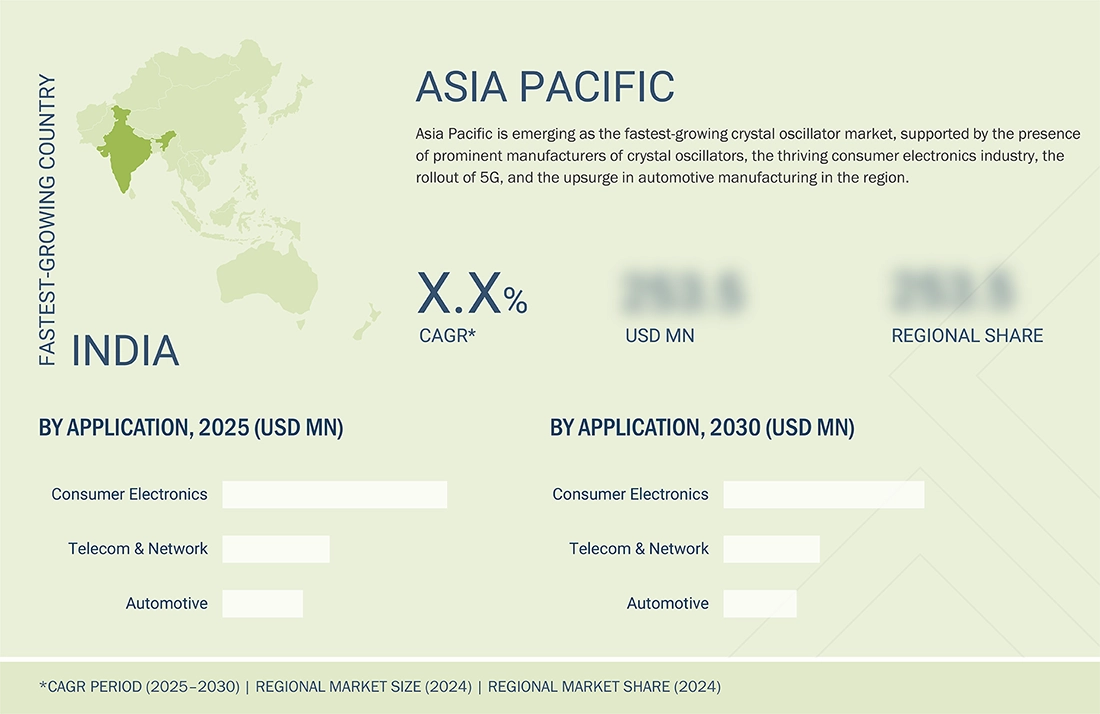
- Asia Pacific is estimated to dominate the crystal oscillator market with a share of 59.6% in 2025.
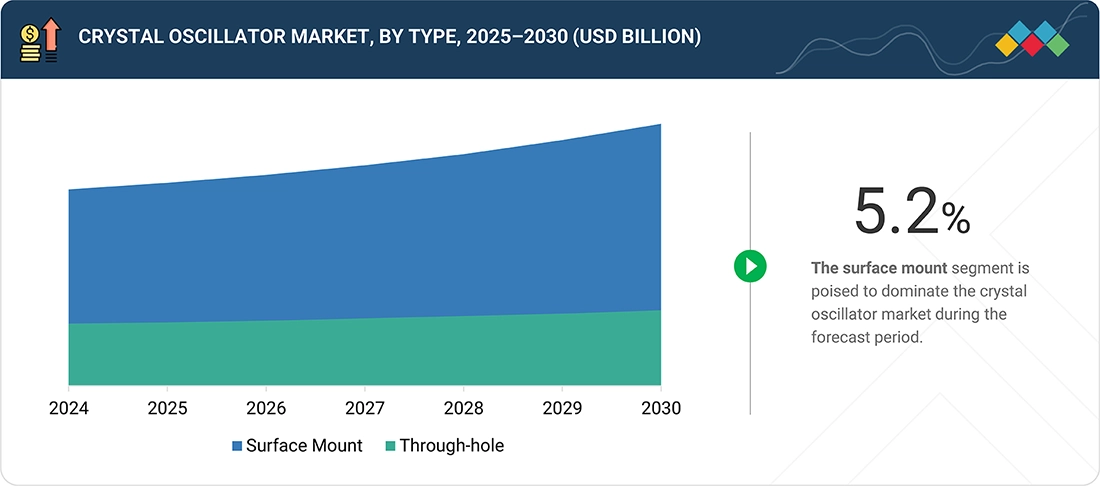
- By mounting type, the surface mount accounted for the largest market size in 2024.
- By crystal cut, the AT-cut segment accounted for a share of 72.4% in terms of value in 2024.
- By general circuitry, the VCXO segment is projected to grow at a CAGR of 5.8% during the forecast period.
- By application, consumer electronics are estimated to hold a significant share of the crystal oscillator market in 2025.
- Seiko Epson Corporation, NIHON DEMPA KOGYA Co., LTD., KYOCERA Corporation, and SiTime Corp. were identified as star players in the crystal oscillator market, given their broad industry coverage and strong operational & financial strength.
- TAITEN Electronics Co., Ltd and Shenzhen Crystal Technology Industrial Co., Ltd. have distinguished themselves among startups and SMEs due to their well-developed marketing channels and extensive funding to build their product portfolios.
The increasing use of crystal oscillators in the automobile industry is the primary factor propelling the crystal oscillator market. Crystal oscillators are also designed to withstand high vibration levels, which are commonly found in automotive applications. When everything is said and done, crystal oscillators are essential components of numerous automobile applications. They provide the necessary long-term dependability, high accuracy, stability, temperature range, and vibration resistance in these vital applications.
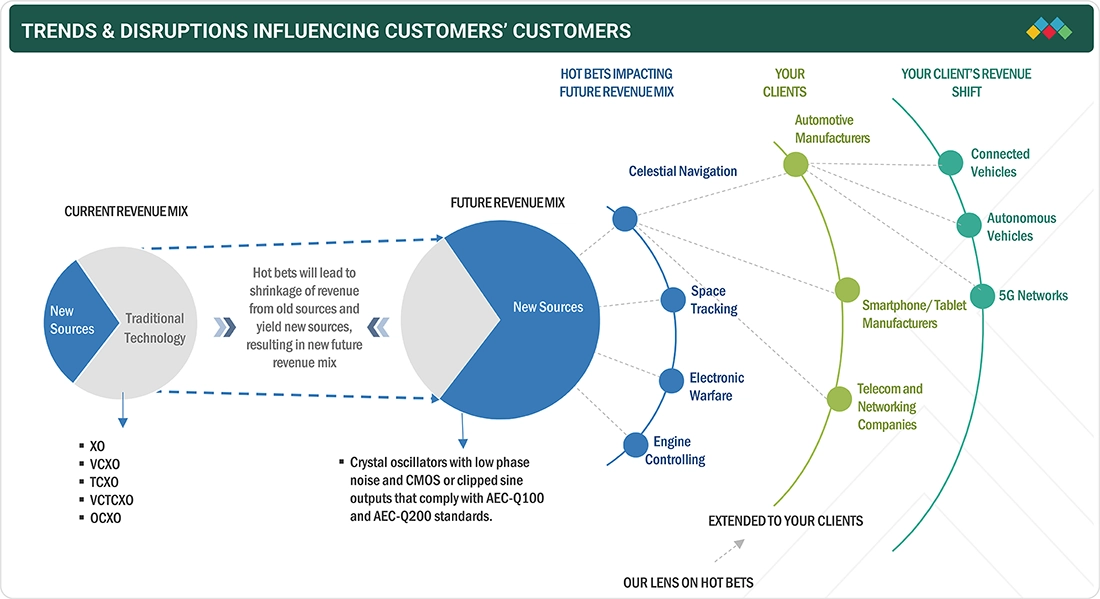
TRENDS & DISRUPTIONS IMPACTING CUSTOMERS' CUSTOMERS
This section reviews emerging trends and disruptions shaping customer priorities in the crystal oscillator market. The ecosystem of the crystal oscillator market is characterized by a diverse set of stakeholders, complex supply chains, and dynamic application segments. This section shows interrelationships among leading manufacturers, suppliers, and OEMs to deliver timing solutions tailored for telecom, consumer electronics, automotive, aerospace, and industrial markets.
Source: Secondary Research, Interviews with Experts, MarketsandMarkets Analysis
MARKET DYNAMICS
Level
-
Increasing adoption of crystal oscillators in aerospace and defense applications

-
Growing use of crystal oscillators in automotive sector

Level
-
Availability of cost-effective and more reliable alternative technologies

Level
-
Growing demand for miniature electronic devices with improved performance

-
Increasing adoption of advanced automotive electronics

Level
-
Frequency drift issues in crystal oscillators after extended use

Source: Secondary Research, Interviews with Experts, MarketsandMarkets Analysis
Driver: Growing use of crystal oscillators in automotive sector
Technological innovations in automotive engineering are revolutionizing the sector to a great extent, with crystal oscillators playing a central role in maximizing vehicle performance, safety, and reliability. These devices play a crucial role in ensuring accurate timing and frequency control in various systems, including navigation, communication, and sensor applications, thereby maximizing the overall performance and reliability of contemporary vehicles. Such superior chips yield clock signals accurately for the effective communication and coordination of various modules on board. These crystal oscillators are used in high-end automotive systems from engine control units (ECU) to anti-lock braking systems (ABS), traction control systems (TCS), and electronic stability control (ESC) systems, as well as airbag systems, climate control systems, infotainment systems, and advanced driver-assistance systems (ADAS), so that drivers can enjoy more functionality, higher precision, and extraordinary increases in overall efficiency.
Restraint: Availability of cost-effective and more reliable alternative technologies
Micro-electro-mechanical systems (MEMS) resonator-based clocks and oscillators are used where their stability and accuracy can compete with most crystal circuitry but provide more reliability, more ruggedness, smaller size, and lower cost. IDT Corporation (US) and SiTime Corporation (US) provide new MEMS oscillators. They are produced by using conventional semiconductor fabrication processes, which are less expensive than the specialized processes employed to make crystal oscillators. Moreover, MEMS oscillators can be mass-produced, again reducing the cost. Due to the common CMOS silicon methods employed in these devices, they are cheaper and simpler to produce than crystal oscillators, which require specialized manufacturing and packaging methods. Crystal oscillator technology is quickly approaching its limits in terms of performance, size, reliability, and cost. Any further advancements or developments in these oscillators are scarce. Other technologies like MEMS are also finding market space. Thus, constant evolution in oscillator technology has rendered crystal oscillators obsolete because no further advancements in this technology can be seen.
Opportunity: Growing demand for miniature electronic devices with improved performance
Consumers are increasingly opting for smaller, lighter electronic devices, resulting in a surge in demand for small crystal oscillators. Today's consumers prefer smaller, thinner sizes and more functions, which creates the need for sophisticated components to be packaged in smaller packages. The demand for shrinking electronic devices has expanded across all industries, from communications to consumer electronics, automotive, and medical equipment. These advances drive the application of CXOs in new and existing applications. The IoT environment is based on precise and synchronized communication among devices. Crystal oscillators offer consistent time references for IoT networks, providing reliable data transfer, device synchronization, and sensor data synchronization. They also offer accurate timing for machine-to-machine communication and real-time processing.
Challenge: Frequency drift issues in crystal oscillators after extended use
The loss of stability in crystal oscillators manifests itself as “drift,” a phenomenon that can degrade performance and cause many technical errors, depending on the application. The heat generated by the circuit operating for an extended period can also negatively impact stability, as it can alter the values of components, such as inductors, resistors, and capacitors. Other factors include variations in the operating voltage of an oscillator and mechanical vibrations. A major challenge in achieving lasting stability in crystal oscillators is that, in many cases, an oscillator may have been in use for years before signs of drift begin to appear, and it could continue going on for a long time before the drift is detected. Hence, the period between the drift and its detection may be crucial, as it can cause stability issues, which may cause issues with the device in which the oscillator is used.
Crystal Oscillator Market: COMMERCIAL USE CASES ACROSS INDUSTRIES
| COMPANY | USE CASE DESCRIPTION | BENEFITS |
|---|---|---|
 |
Used in communication, consumer electronics, military & defense, industrial, automotive, medical, and other industries | Available in various sizes, frequencies, OE/ST functions, and temperature ranges to suit a wide array of applications | SPXO ensures outstanding frequency stability without needing temperature compensation or frequent frequency adjustments |
 |
Used in communication, consumer electronics, automotive, and other industries | Designed to consume very low power, making them ideal for use in battery-powered devices, are also available in a variety of frequencies and packages |
 |
Used in communication, automotive, and other industries | Achieve an exceptionally compact form factor and outstanding high-frequency precision, making them ideal for utilization in smartphones, GNSS modules, and IoT devices |
 |
Used in communication, automotive, and other industries | Has low phase noise with different supply voltages as per requirements and designed to operate in extreme environments, such as in oil wells and aerospace applications |
 |
Used in communication, consumer electronics, industrial, and other industries | Have excellent low phase noise and jitter, with various output frequencies available for different applications |
Logos and trademarks shown above are the property of their respective owners. Their use here is for informational and illustrative purposes only.
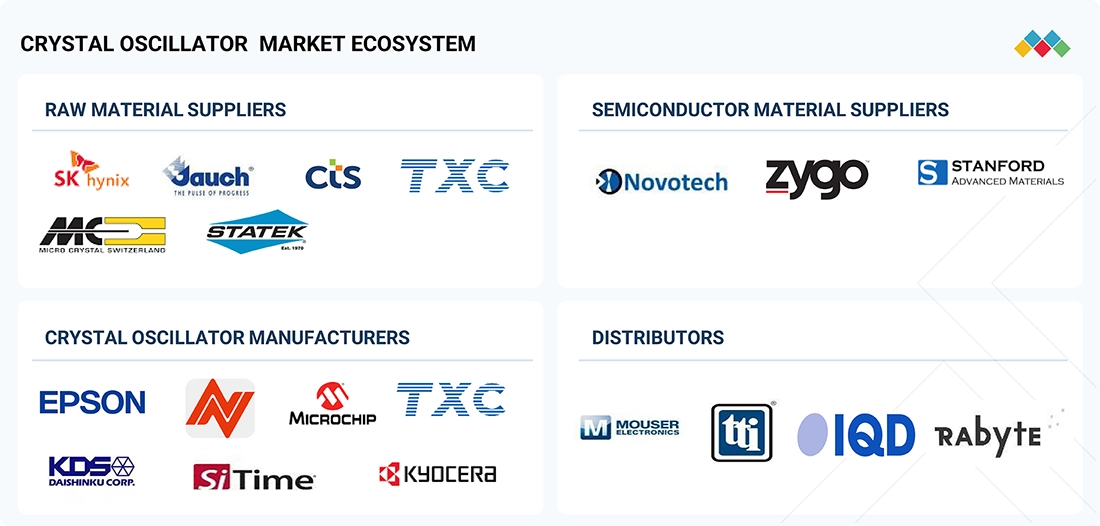
MARKET ECOSYSTEM
In the ecosystem, raw material suppliers provide essential materials, including quartz crystals, semiconductor components, and packaging materials, used in crystal oscillators. Crystal oscillator suppliers develop and produce crystal oscillators in different forms, including TCXOS, OCXOS, VCXOs, and MEMS-based oscillators. Seiko Epson Corporation, KYOCERA Corporation, NIHON DEMPA KOGYO CO., LTD., Daishinku Corp., and SiTime Corporation are some of the leading crystal oscillator system manufacturing firms. Semiconductor companies also make significant contributions by supplying ICs that drive oscillator circuits, frequency control components, and other semiconductor devices. Distributors also spread oscillators and related products to end users. Crystal oscillators are utilized in various markets, and leading companies incorporate them into their products.
Logos and trademarks shown above are the property of their respective owners. Their use here is for informational and illustrative purposes only.
MARKET SEGMENTS
Source: Secondary Research, Interviews with Experts, MarketsandMarkets Analysis
Crystal Oscillator Market, by Crystal Cut
The AT-cut segment is projected to account for the largest market share during the forecast timeline. The growth of this segment can be attributed to the increased number of activity dips, higher drive level sensitivity, and insensitivity to electric fields. Additionally, it has a simpler manufacturing process and is less expensive to produce. As a result, it is favored in consumer electronics, telecommunications, precise timing applications, and general-purpose oscillators. Some of its characteristics include temperature stability, low frequency drift, high precision, the possibility for downsizing, low power consumption, a wide high-frequency range, reliability, and cost-effectiveness. Cumulatively, all these attributes contribute to making AT-cut crystal oscillators the go-to product in various industries, including consumer electronics, telecommunications, and many others, where precision and reliable frequency sources are required.
Crystal Oscillator Market, by General Circuitry
The TCXO frequency band segment is estimated to account for the largest market share during the forecast period. TCXOs are designed with temperature-compensated circuits, allowing them to operate reliably across a broad range of temperatures. Two types of TCXOs exist: one is integrated with resistors and capacitors, including thermistors, and the other features temperature-compensated circuits with the devices in an LSI. Both are utilized as thermo-sensitive devices. TCXOs possess excellent temperature properties, are economical, consume low power, are compact and lightweight, and have a short startup time. Different players in the ecosystem are employing organic strategies through product releases to maintain their market position. NIHON DEMPA KOGYO CO., LTD. launched a revolutionary product for automobiles—the first ever TCXO of size 2.0 x 1.6 mm (with a height of 0.8 mm) that could operate at high temperatures (+125°C) and deliver high-frequency output (up to 100 MHz). The ongoing development of telecommunications equipment, such as data centers and base stations, drives the need for reliable and stable timing sources such as TCXOs. The continuous growth in telecommunication and the emergence of emerging technologies are compelling the high CAGR of the TCXO segment in Asia Pacific region.
Crystal Oscillator Market, by Application
The automotive segment is estimated to see the highest growth rate in the crystal oscillator market during the forecast period. Crystal oscillators are utilized in advanced driver assistance systems (ADAS), including adaptive cruise control, lane-keeping aids, and collision avoidance systems. These technologies rely on precise timing from crystal oscillators to process data from a variety of sensors and make real-time decisions, enhancing the safety and reliability of vehicle operation for drivers and passengers. Crystal oscillators play a crucial role in various automotive applications, including powertrain management, ADAS, chassis control, safety functions, and multimedia. They also enable engine management, timing circuits, trip computers, audio systems, and GPS navigation to operate reliably across various automotive technologies. NIHON DEMPA KOGYO CO., LTD. launched NT2016SHC in July 2022, a revolutionary automotive product-the first-ever 2.0 x 1.6 mm size temperature-compensated crystal oscillator (TCXO) (height of 0.8 mm) with the ability to function at high temperatures (+125°C) and with high-frequency output (up to 100 MHz).
REGION
Asia Pacific to be fastest-growing region in global crystal oscillatormarket during forecast period
The major drivers for the growth of the crystal oscillator market in the Asia Pacific are the expanding cellular infrastructure in the region and the increasing number of telecom equipment shipments in countries such as China and India. The Asia Pacific crystal oscillator market is expected to grow substantially during the forecast period. Consumer electronics, telecom & networking, and automotive are anticipated to be major applications that make major contributions towards the growth of the Asia Pacific crystal oscillator market. The Asia Pacific region is a global hot spot for high-level investments and business growth opportunities. The major Asian Pacific-based companies manufacturing crystal oscillators are Seiko Epson Corporation (Japan), NIHON DEMPA KOGYO CO., LTD. (Japan), TXC Corporation (Taiwan), KYOCERA Corporation (Japan), and Daishinku Corp. (Japan).
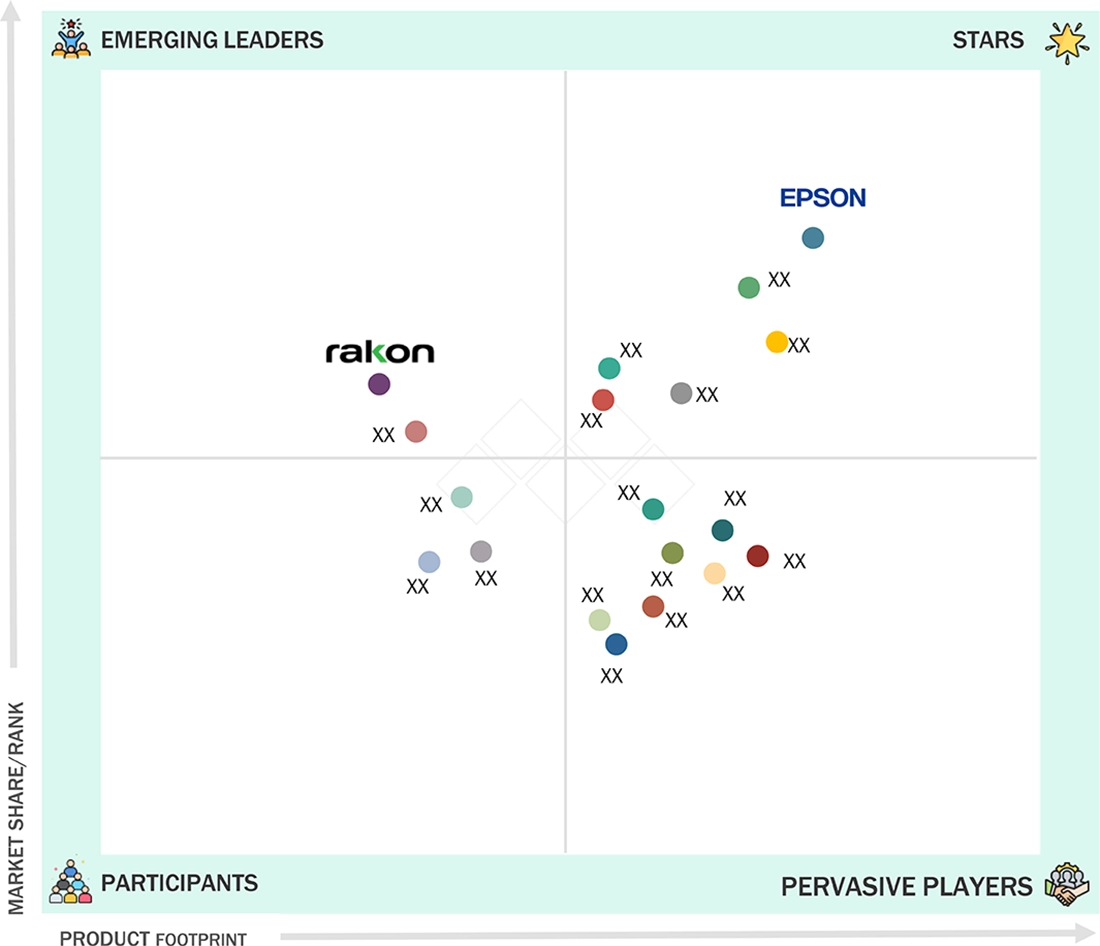
Crystal Oscillator Market: COMPANY EVALUATION MATRIX
In the crystal oscillator market, Seiko EPSON is positioned as a star player due to its strong product portfolio, backed by a strong global presence and technological innovation. In contrast, Rakon is classified as an emerging player as it continues to expand its capabilities in the crystal oscillator market and strengthen its market reach through partnerships and product diversification.
Source: Secondary Research, Interviews with Experts, MarketsandMarkets Analysis
KEY MARKET PLAYERS
MARKET SCOPE
| REPORT METRIC | DETAILS |
|---|---|
| Market Size, 2024 (Value) | USD 2.81 Billion |
| Market Forecast, 2030 (Value) | USD 3.66 Billion |
| Growth Rate | CAGR of 4.8% from 2025 to 2030 |
| Years Considered | 2021–2030 |
| Base Year | 2024 |
| Forecast Period | 2025–2030 |
| Units Considered | Value (USD Million/Billion), Volume (Million Units) |
| Report Coverage | Revenue Forecast, Company Ranking, Competitive Landscape, Growth Factors, and Trends |
| Segments Covered |
|
| Regional Scope | North America, Asia Pacific, Europe, RoW |
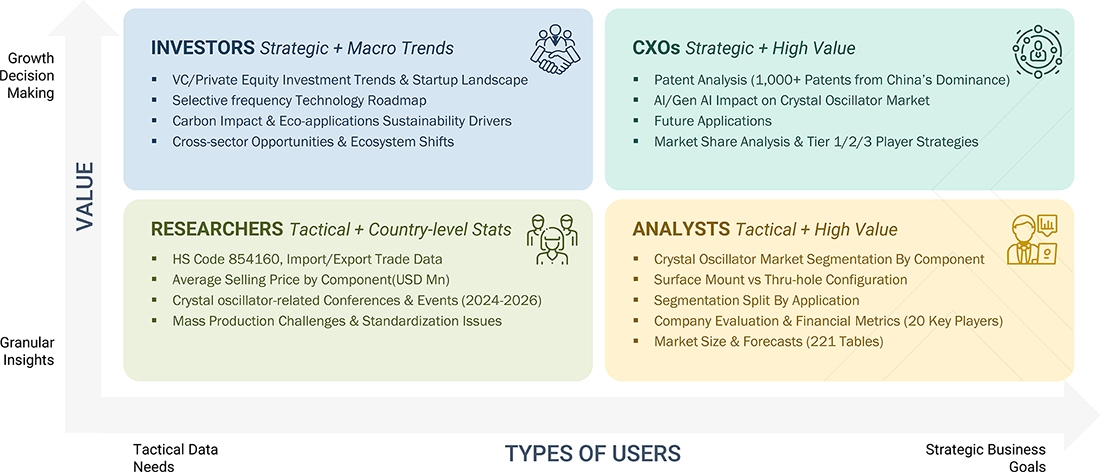
WHAT IS IN IT FOR YOU: Crystal Oscillator Market REPORT CONTENT GUIDE
DELIVERED CUSTOMIZATIONS
We have successfully delivered the following deep-dive customizations:
| CLIENT REQUEST | CUSTOMIZATION DELIVERED | VALUE ADDS |
|---|---|---|
| Asia Pacific-based oscillator adoption |
|
|
| Global Telecom & Server Provider Expansion |
|
|
RECENT DEVELOPMENTS
- November 2024 : NIHON DEMPA KOGYO CO., LTD launched a differential-output crystal oscillator with a compact size (2.0 x 1.6 x 0.66 mm,.5 x 2.0 x 0.74 mm) despite its high fundamental frequency (156 MHz-625 MHz), high precision (±20 x 10.6), and low jitter (28 fs) to be utilized in optical communication speed 800 Gbps and 1.6 Tbps optical transceivers employed in next-generation data centers.
- October 2024 : Seiko Epson Corporation released the OG7050CAN oven-controlled crystal oscillator (OCXO), consuming 56% less power than the products offered by the company through its earlier OG1409 series. With dimensions of 7.0 × 5.0 mm and a height of 3.3 mm (typical), the new OCXO was designed to be 85% smaller in cubic volume compared to previous models.
- October 2024 : TXC Corporation introduced the Xterniti platform, featuring the AI-powered TimeLock algorithm, designed to deliver a longer 24-hour holdover for network synchronization criticality. TXC's Xterniti platform revolutionized contemporary network synchronization with reliability and efficiency.
- December 2023 : SiTime Corp. acquired clock products and licenses for Aura Semiconductor's clock IP. SiTime's intent behind the acquisition was to introduce 20 high-quality clocks to its offerings and introduce another 20 by the end of 2024. Through this acquisition, the company intended to be the sole supplier of whole and differentiated precision timing products.
- September 2023 : SiTime Corp. presented the Epoch Platform aimed at addressing complex timing problems within the electronics industry and breaking a century-old dependence on quartz-based technology. The platform offered an MEMS-based oven-controlled oscillator (OCXO) that emits very stable clock signals for data center and network infrastructure equipment.
Table of Contents
 Exclusive indicates content/data unique to MarketsandMarkets and not available with any competitors.
Methodology
The study involved four major activities in estimating the current size of the crystal oscillator market—exhaustive secondary research collected information on the market, peer, and parent markets. The next step was to validate these findings, assumptions, and sizing with industry experts across the supply chain through primary research. Both top-down and bottom-up approaches were employed to estimate the complete market size. After that, market breakdown and data triangulation were used to estimate the market size of segments and subsegments.
Secondary Research
Various secondary sources have been referred to in the secondary research process to identify and collect information important for this study. The secondary sources include annual reports, press releases, and investor presentations of companies; white papers; journals and certified publications; and articles from recognized authors, websites, directories, and databases. Secondary research has been conducted to obtain critical information about the industry’s supply chain, the market’s value chain, the total pool of key players, market segmentation according to the industry trends (to the bottom-most level), regional markets, and key developments from market- and technology-oriented perspectives. The secondary data has been collected and analyzed to determine the overall market size, further validated by primary research.
List of major secondary sources
|
Source |
Web Link |
|
International Monetary Fund (IMF) |
www.imf.org |
|
Bloomberg New Energy Finance (BNEF) |
www.bnef.com |
|
International Frequency Sensor Association (IFSA) |
https://www.sensorsportal.com/ |
|
Telecommunications Industry Association (TIA) |
https://standards.tiaonline.org/ |
Primary Research
In the primary research process, various primary sources from both the supply and demand sides were interviewed to obtain qualitative and quantitative information for this report. The primary sources from the supply side included industry experts, such as Chief Executive Officers (CEOs), Vice Presidents (VPs), marketing directors, technology and innovation directors, and related key executives from various key companies and organizations operating in the supply chain market. After the complete market engineering (calculations for market statistics, market breakdown, market size estimations, market forecasting, and data triangulation), extensive primary research was conducted to gather information and verify and validate the critical numbers arrived at. Primary research was also conducted to identify the segmentation types, industry trends, competitive landscape of supply chain solutions offered by various market players, and key market dynamics, such as drivers, restraints, opportunities, challenges, industry trends, and key player strategies.
In the complete market engineering process, the top-down and bottom-up approaches were extensively used, along with several data triangulation methods, to perform the market estimation and market forecasting for the overall market segments and subsegments listed in this report. Extensive qualitative and quantitative analysis was performed on the complete market engineering process to list the key information/insights throughout the report.

To know about the assumptions considered for the study, download the pdf brochure
Market Size Estimation
In the complete market engineering process, top-down and bottom-up approaches and several data triangulation methods have been used to estimate and forecast the overall market segments and subsegments listed in this report. Key players in the market have been identified through secondary research, and their market shares in the respective regions have been determined through primary and secondary research. This entire procedure includes the study of annual and financial reports of the top market players and extensive interviews for key insights (quantitative and qualitative) with industry experts (CEOs, VPs, directors, and marketing executives).
All percentage shares, splits, and breakdowns have been determined using secondary sources and verified through primary sources. All the parameters affecting the markets covered in this research study have been accounted for, viewed in detail, verified through primary research, and analyzed to obtain the final quantitative and qualitative data. This data has been consolidated and supplemented with detailed inputs and analysis from MarketsandMarkets and presented in this report. The following figure represents this study’s overall market size estimation process.
Crystal Oscillator Market : Top-Down and Bottom-Up Approach

Data Triangulation
After arriving at the overall market size from the above estimation process, the market has been split into several segments and subsegments. The data triangulation procedure has been employed wherever applicable to complete the overall market engineering process and arrive at the exact statistics for all segments and subsegments. The data has been triangulated by studying various factors and trends from both the demand and supply sides. Additionally, the market size has been validated using top-down and bottom-up approaches.
Market Definition
A crystal oscillator is an electronic device that uses the mechanical resonance of a piezoelectric material-based vibrating crystal. The vibrations of the crystal convert into oscillations to generate an electric pulse of a specific frequency. The oscillations can be set or modified to generate the desired frequency signals according to application requirements. They operate on the principle of the inverse piezoelectric effect. A quartz crystal is generally used to determine the frequency to obtain a very high level of oscillator stability. Quartz crystals are highly cost-effective, naturally available, and robust, and they offer excellent performance. Hence, they are preferred over other substances such as Rochelle salt and tourmaline. Crystal oscillators are compact and inexpensive, so they are extensively used in electronic warfare systems, communication systems, guidance systems, and so on.
Key Stakeholders
- Crystal oscillator manufacturers
- Automotive and consumer electronics companies
- Semiconductor component suppliers
- Crystal oscillator distributors and sellers
- Electronic system assemblers
- Technology solution providers and design contractors
- Electronics and semiconductor companies
- Raw material suppliers for crystal oscillators
- Technology standards organizations, forums, alliances, and associations
- Universities and research organizations
- Government bodies
Report Objectives
- To describe and forecast the size of the crystal oscillator market, by mounting scheme, crystal cut, general circuitry, and application, in terms of value
- To describe and forecast the market size of various segments across four key regions—North America, Europe, Asia Pacific, and Rest of the World (RoW), in terms of value
- To provide information about the subtype of the temperature-compensated crystal oscillators (TCXOs), which is voltage-controlled temperature-compensated crystal oscillator (VCTCXO)
- To forecast the market size for subtypes of voltage-controlled crystal oscillators (VCXOs), which are temperature-compensated voltage-controlled crystal oscillators (TCVCXOs) and oven-controlled voltage-controlled crystal oscillators (OCVCXOs), in terms of value
- To forecast the market size for subtypes of oven-controlled crystal oscillators (OCXOs), which are double oven-controlled crystal oscillators (DOCXOs) and evacuated miniature crystal oscillators (EMXOs), in terms of value
- To forecast the crystal oscillator market size, in terms of volume, based on general circuitry
- To provide detailed information regarding the drivers, restraints, opportunities, and challenges influencing the growth of the crystal oscillator market
- To provide an overview of the crystal oscillator value chain and ecosystem, along with the pricing analysis for crystal oscillator devices
- To strategically analyze the tariff and regulatory landscape, patent landscape, Porter’s five forces, import and export scenarios, and case studies pertaining to the market under study
- To strategically analyze micromarkets1 with regard to individual growth trends, prospects, and contributions to the overall market
- To analyze opportunities in the market for stakeholders by identifying high-growth segments
- To provide details of the competitive landscape for market leaders
- To analyze strategies, such as product launches, collaborations, acquisitions, and partnerships, which were adopted by players in the crystal oscillator market
- To profile key players in the crystal oscillator market and comprehensively analyze their market ranking based on their revenue, market shares, and core competencies2
Available Customizations
With the given market data, MarketsandMarkets offers customizations according to the specific requirements of companies. The following customization options are available for the report:
- Detailed analysis and profiling of additional market players (up to 5)
- Additional country-level analysis of the crystal oscillator market
Regional Analysis
- Product matrix provides a detailed comparison of the product portfolio of each company in the crystal oscillator market.
Key Questions Addressed by the Report
Need a Tailored Report?
Customize this report to your needs
Get 10% FREE Customization
Customize This ReportPersonalize This Research
- Triangulate with your Own Data
- Get Data as per your Format and Definition
- Gain a Deeper Dive on a Specific Application, Geography, Customer or Competitor
- Any level of Personalization
Let Us Help You
- What are the Known and Unknown Adjacencies Impacting the Crystal Oscillator Market
- What will your New Revenue Sources be?
- Who will be your Top Customer; what will make them switch?
- Defend your Market Share or Win Competitors
- Get a Scorecard for Target Partners

Custom Market Research Services
We Will Customise The Research For You, In Case The Report Listed Above Does Not Meet With Your Requirements
Get 10% Free CustomisationGrowth opportunities and latent adjacency in Crystal Oscillator Market


Elisa
May, 2016
I am writing a report on the critical analysis of Rakon (NZ) which provides crystal oscillators and I am researching for information that I can include..
Johannes
Jan, 2014
We are interested in the production cost, produced quantities and selling prices of TCXOs, VCXOs, MCXOs, FCXOs main users..
Ping
Aug, 2017
I interested in Crystal Oscillators worldwide Market share ranking in 2016Y~2017Y, and Crystal Oscillator Market By Application. I'm looking forward to receive the feedback from you soon..
G
Sep, 2016
I would like to know the market size of Level Sensor Market . Please provide the number, I have to present to my management to confirm the procurement of this survey. I have limited time..
Richard
Aug, 2022
If I buy the single-user license and later on want to buy a Corporate License can I get credit for a single-user license? Also, can you send me a sample report on this? I would like to make sure you have data on the OCXO market. .
SC
Aug, 2022
Simply doing research on materials requirements for crystal oscillators. Kindly provide us with a sample. Thanks!.
MikeP
Dec, 2020
I am curious what type of crystal oscillator is used by OEMs (i.e. FCXO) for system time (i.e. 1588/802.1AS) Or is MEMS silicon used/required by OEMs for this purpose.
Kazuma
Oct, 2015
Interested specifically in knowing where crystal oscillators are being used and sold. I was wondering if you have any reports for Crystal Oscillators market in the United States?.
Lee
Oct, 2014
Can you provide a free sample of Crystal Oscillator market by email?.
Vin
Sep, 2015
Before purchase, I would like to cross check if your data matches with our forecast from our consultant. Could you please send me the Table 14 to 17 to verify? Thanks, Vin. Table 14 Tcxo Market Size, by Application, 2012 - 2020 ($Million) Table 15 Tcxo Market Size, by Application, 2012 - 2020 (Million Units) Table 16 Vcxo Market Size, by Application, 2012 - 2020 ($Million) Table 17 Vcxo Market Size, by Application, 2012 - 2020 (Million Units).
said
Jul, 2018
I am trying to get a sample of the oscillator business report. We generally buy a lots of reports, but I would like to see the quality of the report before we move on internally..
David
Jan, 2015
We are looking for data that would lead us to the strongest areas of potential growth for OCXO and TCXO market segments especially in the niche of high precision. We are also interested in any threats or emerging technologies that can disrupt this market segment. If you can send me any sample data especially in the OCXO segment that shows you have relevant and accurate data we will go the next step in purchasing the report. Feel free to contact me at the number listed in the form..