Digital Therapeutics Market

Digital Therapeutics Market / DTx Market by Offerings (Platform, Virtual Reality/Games), Revenue Model (Subscription, Value Based), Application (Therapy (Diabetes, Obesity, CNS, Respiratory, CVD), Drug Adherence, Rehab/Patient care) - Global Forecast to 2028

Report Code: HIT 4407 Jan, 2024, by marketsandmarkets.com

The global digital therapeutics market in terms of revenue was estimated to be worth $6.1 billion in 2023 and is poised to reach $21.9 billion by 2028, growing at a CAGR of 29.1% from 2023 to 2028. The new research study consists of an industry trend analysis of the market. The new research study consists of industry trends, pricing analysis, patent analysis, conference and webinar materials, key stakeholders, and buying behaviour in the market.

Growth in this market is primarily driven by the rising of preventable chronic diseases, the need to control healthcare costs, increasing venture capital investment and benefits of digital therapeutics. North America held the highest share in the global market. North America boasts a highly advanced and well-established healthcare infrastructure. The presence of technologically advanced healthcare systems, a high level of digital literacy among healthcare professionals, and a widespread use of electronic health records create a conducive environment for the integration of digital therapeutics.

Digital Therapeutics (DTx) Market

To know about the assumptions considered for the study, Request for Free Sample Report

Digital Therapeutics (DTx) Market

Global Digital Therapeutics Market Dynamics

Driver: Rising focus on Preventative Healthcare

Primary preventive measures can help prevent or arrest the disease in its earliest stages by promoting healthier lifestyles or immunizing against infectious diseases. Many leading causes of death and disability can be prevented with adequate measures. There is a growing consensus among policymakers, providers, and patients that preventive, behavioral, and lifestyle changes are effective pills or procedures.

In the US, chronic conditions account for ~75% of the USD 3.5-trillion annual healthcare spending (Source: chronicdisease.org and the CMS, 2019). However, these chronic diseases are largely preventable. Government legislation and initiatives, such as the Patient Protection and Affordable Care Act (PPACA) (2010), aim at making preventive care affordable and accessible. Owing to the Act, programs incentivizing preventive treatment options are becoming popular.

Restraint: Reluctance among patients to adopt digital therapeutics

Motivating people to use digital therapeutics and building their confidence is a major challenge faced by digital therapeutics providers. While older and underserved populations show maximum susceptibility to diseases and the highest occurrence rates, they are the least likely to use digital therapeutics products due to low technology literacy levels. Furthermore, the limit of how much behavioral change will be observed with digital therapeutics is still undefined.

The clinical validation and deployment of digital therapeutics are carried out on self-selected or volunteer patients; however, their effect on patients showing resistance is still unknown. Furthermore, it is unknown whether digital therapeutics can be sustained over longer periods; there is little information on total patient retention and long-term outcomes. Many patients still rely on traditional means of diagnosis and treatment and thus show reluctance to adopt these novel therapies. This poses a major challenge to the digital therapeutics market.

Opportunity: Large undiagnosed and untreated population

Despite the availability of highly effective and low-cost treatment options for chronic disorders, a large undiagnosed and untreated population still exists. According to the WHO, many people affected by chronic diseases do not get the required treatment and care. According to WHO, in 2019, over one billion people with hypertension (82% of all people with hypertension worldwide) lived in low and middle-income countries. According to BMC Public health Journal 2022, the overall prevalence rates of undiagnosed, untreated, and undertreated hypertension among older adults in India were 42.3%, 6%, and 18.7%, respectively. Approximately 90% of COPD deaths occur in low and middle-income countries, as they do not get the required treatment. Over 75% of CVD-related deaths occur in low and middle-income countries, primarily due to low/limited access to appropriate care. Often, treatment for these conditions is not integrated into primary healthcare—the only access to medical care across these regions.

Hence, the affected population is deprived of the necessary care. Other factors, such as underdeveloped health delivery systems, a lack of trained personnel, the absence of essential drugs, and the prevalence of traditional beliefs and practices, also lead to a significant untreated population. This population presents ample opportunities for the implementation of digital therapeutics. Since digital therapeutics is delivered online, it is more accessible than conventional treatment solutions and can reach more patients.

Challenge: Lack of awareness and access to digital therapeutics programs in developing countries

Healthcare information technology has witnessed significant growth in developing regions owing to healthcare reforms. However, the IT infrastructure is still inadequate to meet the demands and needs of the increasing population in these countries. Most healthcare professionals (HCPs) highlighted a lack of awareness regarding the availability and benefits of digital therapeutics.

In general, there is a lack of knowledge about the efficacy of digital therapeutics and whether these solutions have robust clinical trial data to support their use. This notion is even more prominent in markets with elevated skepticism and conservatism toward digital technology (e.g., Germany and Belgium). Digital health advancements are currently restricted primarily to economically and socially developed regions. As a result, developing regions lack awareness and access to these technological advancements in healthcare. This condition is more pronounced among the underserved populations in the rural areas of developing countries. Some common barriers include a lack of appropriate knowledge about healthcare, lack of competency for using e-health solutions, lack of digital literacy, limited or no access to the Internet, and an overall lack of awareness of digital therapeutics and its advantages.

Digital Therapeutics Market Ecosystem

The market ecosystem comprises entities responsible for the end-to-end workflow of digital therapeutics services. The major stakeholders present in this market include network connectivity providers, infrastructure service providers, platform/service/application providers, hospitals and healthcare systems, employers, healthcare payers, government regulatory bodies and start up companies. The demand continues to grow and expand, especially after the outbreak of the COVID-19 pandemic. Solution and service providers continue to enhance and mature their offerings to add value.

Digital Therapeutics (DTx) Market Ecosystem

Source: Secondary Literature, Interviews with Experts, and MarketsandMarkets Analysis

Software/Platforms segment of the digital therapeutics industry is anticipated to garner the highest share during the forecast period.

The digital therapeutics market based on offering is segmented into software/platforms, programs, and virtual reality/games. Software/Platforms is estimated to capture the largest share over the study period. This dominance is driven by the increasing reliance on sophisticated software solutions to deliver therapeutic interventions, reflecting a growing trend toward digital health solutions. The segment's prominence highlights the crucial role of advanced technologies and platforms in shaping the trajectory of the global market.

Business-to-Buisness segment is anticipated to account for the lion’s share of digital therapeutics industry, by Sales in 2022.

The digital therapeutics market is divided based on sales channel into business-to-business (B2B), and business-to-customer (B2C). This is owing to the increasing adoption among payers, employers, and providers understanding the benefits of digital therapeutics. Additionally, the inclination of pharmaceutical companies to incorporate digital therapeutics with their drug products is also estimated to drive the adoption of the products within these end-user segment.

Care-related/Treatment applications are the highest share of the digital therapeutics industry, by applications in 2022.

The digital therapeutics market is bifurcated based on applications into care-related/treatment and preventive applications. The growth of the care-related/treatment applications segment is owed to the rising economic burden of their treatment, and investments in digital therapeutics to promote the advancement of cost-effective and scalable treatment platforms for these conditions.

North America to lead the digital therapeutics industry in 2022.

The segmentation of the digital therapeutics market based on region, encompasses North America, Europe, the Asia Pacific, Latin America, and the Middle East & Africa. As of 2022, North America held the dominant market share, with Europe following closely behind. The accelerated growth in North America is primarily ascribed to increased investments in digital therapeutics, improvements in the reimbursement framework for these solutions, a surge in the number of new startups in the digital therapeutics sector, and government initiatives aimed at promoting technological advancements in this region.

Digital Therapeutics (DTx) Market by Region

To know about the assumptions considered for the study, download the pdf brochure

Prominent players in digital therapeutics market include Noom, Inc (US), Teladoc Health, Inc. (US), Omada Health, Inc. (US), WellDoc, Inc (US), Biofourmis (US), Better Therapeutics, Inc (US), Amalgm Rx (US), CogniFit Inc (US), Headspace Health (US), Propeller Health (US), Virta Health Corp (US), 2Morrow, Inc. (US), Realizedcare (US), Canary Health (US), Twill Inc. (US), Click Therapeutics, Inc. (US), Akili, Inc. (US), Cognoa, Inc (US), Wellthy Therapeutics Pvt. Ltd. (India), Kaia Health (Germany), Ayogo (Canada), Mindable Health GmbH (Germany), Hinge Health, Inc. (US), and Freespira (US).

Scope of the Digital Therapeutics Industry

Report Metric

Details

Market Revenue in 2023

$6.1 billion

Projected Revenue by 2028

$21.9 billion

Revenue Rate

Poised to Grow at a CAGR of 29.1%

Market Driver

Rising focus on Preventative Healthcare

Market Opportunity

Large undiagnosed and untreated population

The research report categorizes the digital therapeutics market to forecast revenue and analyze trends in each of the following submarkets:

By Offering

  • Programs
  • Software/Platforms
  • Virtual Reality/Games

By Revenue Modal

  • Subscription
  • One time Purchase/Licensing
  • Outcome/Value based

By Sales Channel

  • B2C
  • Patients
  • Caregivers
  • B2B
  • Providers
  • Payers
  • Employers
  • Pharmaceutical Companies
  • Other Buyers

By Application

  • Preventive Applications
  • Prediabetes
  • Obesity
  • Nutrition
  • Lifestyle Management
  • Other Preventive Applications
  • Treatment/Care-related Applications
  • Diabetes
  • CNS Disorders
    • Mental Health Disorder
    • Other CNS Disorders
  • Chronic Respiratory Disorders
  • Musculoskeletal Disorders
  • Cardiovascular Diseases
  • Smoking Cessation
  • Medication Adherence
  • Gastrointestinal Disorders
  • Substance Use & Addiction Management
  • Rehabilitation & Patient Care
  • Other Treatment/Care-related Applications

By Region

  • North America
    • US
    • Canada
  • Europe
    • UK
    • Germany
    • France
    • Spain
    • Italy
    • Rest of Europe (RoE)
  • Asia Pacific
    • Japan
    • China
    • India
    • Rest of the APAC
  • Latin America (LATAM)
    • Brazil
    • Mexico
    • Rest of Latin America (RoLATAM)
  • Middle East & Africa (MEA)
    • GCC Countries
    • Rest of Middle East & Africa (RoMEA)

Recent Developments of Digital Therapeutics Industry:

  • In May 2023, Noom, Inc. announced a new program, Noom Med, designed to fight the disease of obesity. Noom Med is a program that has offers telehealth services with Noom’s personalized psychological tools for patients enrolling for weight loss.
  • In May 2023, Omada Health announced a specialized program enhancement for members taking GLP-1s, in response to the growing interest and demand for the medication.
  • In August 2022, Teladoc Health announced a home A1C (hemoglobin A1C) testing program for its Livongo product to help Teladoc Health members manage and control their diabetes via blood glucose meters.
  • In April 2021, Welldoc (US) partnered with Dexacom (US). This partnership helped provide BlueStar with Dexcom G6 CGM as a single platform to people with Type 2 diabetes for improved health.

Frequently Asked Questions (FAQ):

To speak to our analyst for a discussion on the above findings, click Speak to Analyst

TABLE OF CONTENTS
 
1 INTRODUCTION (Page No. - 40)
    1.1 STUDY OBJECTIVES 
    1.2 MARKET DEFINITION 
    1.3 INCLUSIONS AND EXCLUSIONS 
    1.4 MARKET SCOPE 
           1.4.1 MARKETS COVERED
           1.4.2 YEARS CONSIDERED
           1.4.3 CURRENCY CONSIDERED
    1.5 STAKEHOLDERS 
    1.6 RESEARCH LIMITATIONS 
    1.7 SUMMARY OF CHANGES 
    1.8 RECESSION IMPACT 
 
2 RESEARCH METHODOLOGY (Page No. - 45)
    2.1 RESEARCH DATA 
          FIGURE 1 RESEARCH DESIGN
           2.1.1 SECONDARY DATA
                    2.1.1.1 Key data from secondary sources
           2.1.2 PRIMARY DATA
                    FIGURE 2 PRIMARY SOURCES
                    2.1.2.1 Key data from primary sources
                    2.1.2.2 Key industry insights
                                FIGURE 3 BREAKDOWN OF PRIMARY INTERVIEWS (SUPPLY SIDE): BY COMPANY TYPE, DESIGNATION, AND REGION
                                FIGURE 4 BREAKDOWN OF PRIMARY INTERVIEWS (DEMAND SIDE): BY TYPE OF BUYER AND REGION
    2.2 MARKET SIZE ESTIMATION 
           2.2.1 BOTTOM-UP APPROACH
                    2.2.1.1 Approach 1: Revenue mapping-based estimation
                                FIGURE 5 DIGITAL THERAPEUTICS: REVENUE MAPPING-BASED ESTIMATION
                    2.2.1.2 Approach 2: Buyer adoption-based estimation
                                FIGURE 6 DIGITAL THERAPEUTICS ESTIMATION: BUYER ADOPTION-BASED ESTIMATION
           2.2.2 TOP-DOWN APPROACH: PENETRATION RATE-BASED MARKET SIZE ESTIMATION
                    FIGURE 7 PENETRATION RATE-BASED MARKET ESTIMATION
           2.2.3 GROWTH FORECAST
                    TABLE 1 IMPACT ANALYSIS
                    FIGURE 8 CAGR PROJECTIONS FROM ANALYSIS OF DRIVERS, RESTRAINTS, OPPORTUNITIES, AND CHALLENGES (2023–2028)
                    FIGURE 9 CAGR PROJECTIONS: SUPPLY-SIDE ANALYSIS
    2.3 MARKET BREAKDOWN AND DATA TRIANGULATION 
          FIGURE 10 DATA TRIANGULATION METHODOLOGY
    2.4 ASSUMPTIONS 
    2.5 RISK ASSESSMENT 
 
3 EXECUTIVE SUMMARY (Page No. - 59)
    FIGURE 11 DIGITAL THERAPEUTICS MARKET, BY OFFERING, 2023 VS. 2028 (USD MILLION)
    FIGURE 12 DIGITAL THERAPEUTICS INDUSTRY, BY REVENUE MODEL, 2023 VS. 2028 (USD MILLION)
    FIGURE 13 MARKET, BY APPLICATION, 2023 VS. 2028 (USD MILLION)
    FIGURE 14 MARKET FOR TREATMENT/CARE-RELATED APPLICATIONS, BY TYPE, 2023 VS. 2028 (USD MILLION)
    FIGURE 15 MARKET, BY SALES CHANNEL, 2023 VS. 2028 (USD MILLION)
    FIGURE 16 GEOGRAPHICAL SNAPSHOT OF MARKET
 
4 PREMIUM INSIGHTS (Page No. - 64)
    4.1 DIGITAL THERAPEUTICS MARKET OVERVIEW 
          FIGURE 17 INCREASING INCIDENCE OF CHRONIC DISEASES AND RISING NEED TO CURB HEALTHCARE COSTS TO DRIVE MARKET
    4.2 DIGITAL THERAPEUTICS INDUSTRY, BY SALES CHANNEL, 2023 VS. 2O28 
          FIGURE 18 B2B SALES CHANNEL SEGMENT TO DOMINATE MARKET DURING FORECAST PERIOD
    4.3 MARKET: GEOGRAPHIC GROWTH OPPORTUNITIES 
          FIGURE 19 US TO GROW AT HIGHEST CAGR DURING FORECAST PERIOD
 
5 MARKET OVERVIEW (Page No. - 67)
    5.1 INTRODUCTION 
    5.2 MARKET DYNAMICS 
          FIGURE 20 DIGITAL THERAPEUTICS MARKET: DRIVERS, RESTRAINTS, OPPORTUNITIES, AND CHALLENGES
           5.2.1 DRIVERS
                    5.2.1.1 Increasing incidence of chronic diseases
                    5.2.1.2 Growing focus on preventive healthcare
                    5.2.1.3 Rising need to curb healthcare cost
                    5.2.1.4 Surge in venture capital investments
                    5.2.1.5 Benefits of digital therapeutics
                               5.2.1.5.1 Ability to induce behavioral change
                               5.2.1.5.2 Improved drug adherence
                               5.2.1.5.3 Patient convenience and user-friendly
           5.2.2 RESTRAINTS
                    5.2.2.1 Data privacy concerns
           5.2.3 OPPORTUNITIES
                    5.2.3.1 High growth potential of emerging markets
                    5.2.3.2 Large undiagnosed and untreated population
           5.2.4 CHALLENGES
                    5.2.4.1 Unstable pricing models
                    5.2.4.2 Reluctance among patients for DTx adoption
                    5.2.4.3 Limited awareness in emerging economies
                    5.2.4.4 Resistance from traditional healthcare providers
    5.3 INDUSTRY TRENDS 
           5.3.1 VIRTUAL REALITY
           5.3.2 RISING DEMAND FOR DIGITAL SOLUTIONS IN CBT
    5.4 TECHNOLOGY ANALYSIS 
          TABLE 2 TECHNOLOGY ENABLERS, BENEFITS, AND EXAMPLES
           5.4.1 MACHINE LEARNING
           5.4.2 ARTIFICIAL INTELLIGENCE
           5.4.3 INTERNET OF THINGS
           5.4.4 BLOCKCHAIN TECHNOLOGY
           5.4.5 CLOUD COMPUTING
           5.4.6 DATA ANALYTICS
           5.4.7 EXTENDED REALITY
    5.5 VALUE CHAIN ANALYSIS 
          FIGURE 21 DIGITAL THERAPEUTICS INDUSTRY: VALUE CHAIN ANALYSIS
           5.5.1 RESEARCH & PRODUCT DEVELOPMENT
           5.5.2 MATERIAL COMPONENTS
           5.5.3 MANUFACTURERS & DEVELOPERS
           5.5.4 DISTRIBUTION & SALES
           5.5.5 END-USER INDUSTRIES
           5.5.6 POST-SALE SERVICES
    5.6 ECOSYSTEM ANALYSIS 
          FIGURE 22 ECOSYSTEM MARKET/MAP
    5.7 PIPELINE PRODUCTS 
    5.8 CASE STUDY ANALYSIS 
           5.8.1 CASE STUDY 1: WELLTHY THERAPEUTICS (INDIA)
           5.8.2 CASE STUDY 2: HAPPIFY HEALTH (US)
           5.8.3 CASE STUDY 3: OMADA HEALTH (US)
    5.9 PORTER’S FIVE FORCES ANALYSIS 
           5.9.1 THREAT OF NEW ENTRANTS
           5.9.2 BARGAINING POWER OF SUPPLIERS
           5.9.3 BARGAINING POWER OF BUYERS
           5.9.4 THREAT OF SUBSTITUTES
           5.9.5 INTENSITY OF COMPETITIVE RIVALRY
    5.10 REGULATORY LANDSCAPE 
           5.10.1 REGULATORY BODIES, GOVERNMENT AGENCIES, AND OTHER ORGANIZATIONS
                     TABLE 3 NORTH AMERICA: LIST OF REGULATORY BODIES, GOVERNMENT AGENCIES, AND OTHER ORGANIZATIONS
                     TABLE 4 EUROPE: LIST OF REGULATORY BODIES, GOVERNMENT AGENCIES, AND OTHER ORGANIZATIONS
                     TABLE 5 ASIA PACIFIC: LIST OF REGULATORY BODIES, GOVERNMENT AGENCIES, AND OTHER ORGANIZATIONS
                     TABLE 6 REST OF THE WORLD: LIST OF REGULATORY BODIES, GOVERNMENT AGENCIES, AND OTHER ORGANIZATIONS
                     TABLE 7 MARKET: REGULATORY DATA NEEDED FOR CLASS II DEVICES
    5.11 PRICING ANALYSIS 
           5.11.1 COSTS INVOLVED IN DIGITAL THERAPEUTICS
           5.11.2 INDICATIVE PRICING ANALYSIS, BY KEY PLAYER & COUNTRY
                     TABLE 8 AVERAGE SELLING PRICE OF DIGITAL THERAPEUTIC PRODUCTS, BY COUNTRY
           5.11.3 INDICATIVE PRICING ANALYSIS OF DIGITAL THERAPEUTICS, BY REGION
                     FIGURE 23 INDICATIVE PRICING ANALYSIS OF TELEHEALTH & TELEMEDICINE DEVICES, BY REGION
    5.12 REIMBURSEMENT SCENARIO 
           TABLE 9 MARKET: GLOBAL COVERAGE DETERMINATION STANDARDS
    5.13 PATENT ANALYSIS 
           5.13.1 PATENT PUBLICATION TRENDS
                     FIGURE 24 LIST OF MAJOR PATIENTS FOR DIGITAL THERAPEUTICS
           5.13.2 INSIGHTS: JURISDICTION AND TOP APPLICANT ANALYSIS
                     FIGURE 25 TOP APPLICANT COUNTRIES FOR DIGITAL THERAPEUTICS PATENTS (JANUARY 2016–NOVEMBER 2023)
           5.13.3 LIST OF MAJOR PATENTS
                     TABLE 10 KEY PATENTS IN MARKET
    5.14 KEY CONFERENCES AND EVENTS 
           TABLE 11 MARKET: DETAILED LIST OF CONFERENCES AND EVENTS (2023−2024)
    5.15 KEY STAKEHOLDERS AND BUYING CRITERIA 
           5.15.1 KEY STAKEHOLDERS IN BUYING PROCESS
                     FIGURE 26 INFLUENCE OF STAKEHOLDERS IN BUYING PROCESS FOR SALES CHANNEL
                     TABLE 12 INFLUENCE OF STAKEHOLDERS IN BUYING PROCESS FOR SALES CHANNEL, BY RANKING
           5.15.2 BUYING CRITERIA
                     FIGURE 27 KEY BUYING CRITERIA FOR SALES CHANNEL
                     TABLE 13 KEY BUYING CRITERIA FOR SALES CHANNEL, BY RANKING
    5.16 REVENUE SHIFT AND NEW REVENUE POCKETS FOR MARKET 
           FIGURE 28 TRENDS/DISRUPTIONS IMPACTING CUSTOMERS’ BUSINESSES
    5.17 INVESTMENT LANDSCAPE 
           FIGURE 29 INVESTOR DEALS & FUNDING INITIATIVES FOR DIGITAL THERAPEUTICS (2022)
           FIGURE 30 TOP FUNDING CATEGORIES FOR DIGITAL HEALTH IN 2021
           FIGURE 31 MOST VALUED TELEHEALTH & TELEMEDICINE FIRMS IN 2022 (USD BILLION)
 
6 DIGITAL THERAPEUTICS MARKET, BY OFFERING (Page No. - 107)
    6.1 INTRODUCTION 
          TABLE 14 DIGITAL THERAPEUTICS INDUSTRY, BY OFFERING, 2021–2028 (USD MILLION)
    6.2 SOFTWARE/PLATFORMS 
           6.2.1 ABILITY TO PROVIDE SCALABLE SOLUTIONS FOR DEPLOYMENT TO PROPEL MARKET
                    TABLE 15 MARKET FOR SOFTWARE/PLATFORMS, BY REGION, 2021–2028 (USD MILLION)
    6.3 PROGRAMS 
           6.3.1 INTRODUCTION OF EVIDENCE-BASED THERAPEUTIC PROGRAMS TO SUPPORT MARKET GROWTH
                    TABLE 16 MARKET FOR PROGRAMS, BY REGION, 2021–2028 (USD MILLION)
    6.4 VIRTUAL REALITY/GAMES 
           6.4.1 RISING DEMAND FOR VR SOLUTIONS TO DRIVE MARKET
                    TABLE 17 MARKET FOR VIRTUAL REALITY/GAMES, BY REGION, 2021–2028 (USD MILLION)
 
7 DIGITAL THERAPEUTICS MARKET, BY APPLICATION (Page No. - 112)
    7.1 INTRODUCTION 
          TABLE 18 DIGITAL THERAPEUTICS INDUSTRY, BY APPLICATION, 2021–2028 (USD MILLION)
    7.2 TREATMENT/CARE-RELATED APPLICATIONS 
          TABLE 19 MARKET FOR TREATMENT/CARE-RELATED APPLICATIONS, BY TYPE, 2021–2028 (USD MILLION)
          TABLE 20 MARKET FOR TREATMENT/CARE-RELATED APPLICATIONS, BY REGION, 2021–2028 (USD MILLION)
           7.2.1 DIABETES
                    7.2.1.1 Rising prevalence of diabetes to drive market
                                TABLE 21 MARKET FOR DIABETES, BY REGION, 2021–2028 (USD MILLION)
           7.2.2 CENTRAL NERVOUS SYSTEM (CNS) DISORDERS
                    TABLE 22 MARKET FOR CNS DISORDERS, BY TYPE, 2021–2028 (USD MILLION)
                    TABLE 23 MARKET FOR CNS DISORDERS, BY REGION, 2021–2028 (USD MILLION)
                    7.2.2.1 Mental health disorders
                               7.2.2.1.1 Benefits of digital therapeutics in managing mental health disorders to drive R&D
                                              TABLE 24 MARKET FOR MENTAL HEALTH DISORDERS, BY REGION, 2021–2028 (USD MILLION)
                    7.2.2.2 Other CNS disorders
                                TABLE 25 MARKET FOR OTHER CNS DISORDERS, BY REGION, 2021–2028 (USD MILLION)
           7.2.3 SMOKING CESSATION
                    7.2.3.1 Rising development of mobile applications for nicotine addiction treatment to drive market
                                TABLE 26 MARKET FOR SMOKING CESSATION, BY REGION, 2021–2028 (USD MILLION)
           7.2.4 CHRONIC RESPIRATORY DISEASES
                    7.2.4.1 Growing prevalence of COPD and asthma to drive market
                                TABLE 27 MARKET FOR CHRONIC RESPIRATORY DISEASES, BY REGION, 2021–2028 (USD MILLION)
           7.2.5 MUSCULOSKELETAL DISORDERS
                    7.2.5.1 Shortage of physiotherapists to boost demand
                                TABLE 28 MARKET FOR MUSCULOSKELETAL DISORDERS, BY REGION, 2021–2028 (USD MILLION)
           7.2.6 CARDIOVASCULAR DISEASES
                    7.2.6.1 High incidence of CVD to propel market
                                TABLE 29 MARKET FOR CARDIOVASCULAR DISEASES, BY REGION, 2021–2028 (USD MILLION)
           7.2.7 MEDICATION ADHERENCE
                    7.2.7.1 Rising number of non-adherence cases to propel market
                                TABLE 30 MARKET FOR MEDICATION ADHERENCE, BY REGION, 2021–2028 (USD MILLION)
           7.2.8 GASTROINTESTINAL DISORDERS
                    7.2.8.1 Rising incidence of IBS and GERD to support market growth
                                TABLE 31 MARKET FOR GASTROINTESTINAL DISORDERS, BY REGION, 2021–2028 (USD MILLION)
           7.2.9 REHABILITATION & PATIENT CARE
                    7.2.9.1 Increasing focus on development of patient care platforms to drive market
                                TABLE 32 MARKET FOR REHABILITATION & PATIENT CARE, BY REGION, 2021–2028 (USD MILLION)
           7.2.10 SUBSTANCE USE DISORDERS & ADDICTION MANAGEMENT
                    7.2.10.1 Growing focus on behavioral interventions to propel market
                                 TABLE 33 MARKET FOR SUBSTANCE USE DISORDERS & ADDICTION MANAGEMENT, BY REGION, 2021–2028 (USD MILLION)
           7.2.11 OTHER TREATMENT/CARE-RELATED APPLICATIONS
                     TABLE 34 MARKET FOR OTHER TREATMENT/CARE-RELATED APPLICATIONS, BY REGION, 2021–2028 (USD MILLION)
    7.3 PREVENTIVE APPLICATIONS 
          TABLE 35 MARKET FOR PREVENTIVE APPLICATIONS, BY TYPE, 2021–2028 (USD MILLION)
          TABLE 36 MARKET FOR PREVENTIVE APPLICATIONS, BY REGION, 2021–2028 (USD MILLION)
           7.3.1 PREDIABETES
                    7.3.1.1 Focus on reducing type 2 diabetes to support market growth
                                TABLE 37 MARKET FOR PREDIABETES, BY REGION, 2021–2028 (USD MILLION)
           7.3.2 OBESITY
                    7.3.2.1 Availability of cost-effective solutions for obesity management to propel market
                                TABLE 38 MARKET FOR OBESITY, BY REGION, 2021–2028 (USD MILLION)
           7.3.3 NUTRITION
                    7.3.3.1 Sedentary lifestyles and unhealthy diets to boost demand
                                TABLE 39 MARKET FOR NUTRITION, BY REGION, 2021–2028 (USD MILLION)
           7.3.4 LIFESTYLE MANAGEMENT
                    7.3.4.1 Aim to promote holistic lifestyles to drive market
                                TABLE 40 MARKET FOR LIFESTYLE MANAGEMENT, BY REGION, 2021–2028 (USD MILLION)
           7.3.5 OTHER PREVENTIVE APPLICATIONS
                    TABLE 41 MARKET FOR OTHER PREVENTIVE APPLICATIONS, BY REGION, 2021–2028 (USD MILLION)
 
8 DIGITAL THERAPEUTICS MARKET, BY REVENUE MODEL (Page No. - 129)
    8.1 INTRODUCTION 
          TABLE 42 DIGITAL THERAPEUTICS INDUSTRY, BY REVENUE MODEL, 2021–2028 (USD MILLION)
    8.2 SUBSCRIPTION-BASED MODEL 
           8.2.1 FLEXIBILITY IN PAYMENT OPTIONS TO DRIVE MARKET
                    TABLE 43 MARKET FOR SUBSCRIPTION-BASED MODEL, BY REGION, 2021–2028 (USD MILLION)
    8.3 ONE-TIME PURCHASE/ANNUAL LICENSING MODEL 
           8.3.1 BENEFITS OF LIMITED RECURRING PAYMENTS TO BOOST DEMAND
                    TABLE 44 MARKET FOR ONE-TIME PURCHASE/ANNUAL LICENSING MODEL, BY REGION, 2021–2028 (USD MILLION)
    8.4 OUTCOME /VALUE-BASED MODEL 
           8.4.1 RESULT-DRIVEN APPROACH THAT ENHANCES END-USER ENGAGEMENT TO PROPEL MARKET
                    TABLE 45 MARKET FOR OUTCOME/VALUE-BASED MODEL, BY REGION, 2021–2028 (USD MILLION)
 
9 DIGITAL THERAPEUTICS MARKET, BY SALES CHANNEL (Page No. - 134)
    9.1 INTRODUCTION 
          TABLE 46 DIGITAL THERAPEUTICS INDUSTRY, BY SALES CHANNEL, 2021–2028 (USD MILLION)
    9.2 B2B SALES CHANNEL 
          TABLE 47 MARKET FOR B2B SALES CHANNEL, BY BUYER, 2021–2028 (USD MILLION)
          TABLE 48 MARKET FOR B2B SALES CHANNEL, BY REGION, 2021–2028 (USD MILLION)
           9.2.1 PAYERS
                    9.2.1.1 Significant cost savings to boost demand
                                TABLE 49 MARKET FOR PAYERS, BY REGION, 2021–2028 (USD MILLION)
           9.2.2 EMPLOYERS
                    9.2.2.1 Rising importance of employee health management to drive market
                                TABLE 50 MARKET FOR EMPLOYERS, BY REGION, 2021–2028 (USD MILLION)
           9.2.3 PHARMACEUTICAL COMPANIES
                    9.2.3.1 Cross-industry collaborations between start-ups and pharma companies to propel market
                                TABLE 51 MARKET FOR PHARMACEUTICAL COMPANIES, BY REGION, 2021–2028 (USD MILLION)
           9.2.4 PROVIDERS
                    9.2.4.1 Advanced patient management and cost-reduction benefits to support market growth
                                TABLE 52 MARKET FOR PROVIDERS, BY REGION, 2021–2028 (USD MILLION)
           9.2.5 OTHER BUYERS
                    TABLE 53 MARKET FOR OTHER BUYERS, BY REGION, 2021–2028 (USD MILLION)
    9.3 B2C SALES CHANNEL 
          TABLE 54 MARKET FOR B2C SALES CHANNEL, BY BUYER, 2021–2028 (USD MILLION)
          TABLE 55 MARKET FOR B2C SALES CHANNEL, BY REGION, 2021–2028 (USD MILLION)
           9.3.1 CAREGIVERS
                    9.3.1.1 Ability to manage chronic conditions effectively to boost demand
                                TABLE 56 MARKET FOR CAREGIVERS, BY REGION, 2021–2028 (USD MILLION)
           9.3.2 PATIENTS
                    9.3.2.1 Growing awareness of preventive health to support market
                                TABLE 57 MARKET FOR PATIENTS, BY REGION, 2021–2028 (USD MILLION)
 
10 DIGITAL THERAPEUTICS MARKET, BY REGION (Page No. - 144)
     10.1 INTRODUCTION 
             TABLE 58 DIGITAL THERAPEUTICS INDUSTRY, BY REGION, 2021–2028 (USD MILLION)
     10.2 NORTH AMERICA 
             FIGURE 32 NORTH AMERICA: DIGITAL THERAPEUTICS MARKET SNAPSHOT
             TABLE 59 NORTH AMERICA: MARKET, BY COUNTRY, 2021–2028 (USD MILLION)
             TABLE 60 NORTH AMERICA: MARKET, BY OFFERING, 2021–2028 (USD MILLION)
             TABLE 61 NORTH AMERICA: MARKET, BY REVENUE MODEL, 2021–2028 (USD MILLION)
             TABLE 62 NORTH AMERICA: MARKET, BY APPLICATION, 2021–2028 (USD MILLION)
             TABLE 63 NORTH AMERICA: MARKET FOR TREATMENT/ CARE-RELATED APPLICATIONS, BY TYPE, 2021–2028 (USD MILLION)
             TABLE 64 NORTH AMERICA: MARKET FOR PREVENTIVE APPLICATIONS, BY TYPE, 2021–2028 (USD MILLION)
             TABLE 65 NORTH AMERICA: MARKET FOR CNS DISORDERS, BY TYPE, 2021–2028 (USD MILLION)
             TABLE 66 NORTH AMERICA: MARKET, BY SALES CHANNEL, 2021–2028 (USD MILLION)
             TABLE 67 NORTH AMERICA: MARKET FOR B2C SALES CHANNEL, BY BUYER, 2021–2028 (USD MILLION)
             TABLE 68 NORTH AMERICA: DIGITAL THERAPEUTICS MARKET FOR B2B SALES CHANNEL, BY BUYER, 2021–2028 (USD MILLION)
             10.2.1 NORTH AMERICA: RECESSION IMPACT
             10.2.2 US
                        10.2.2.1 Rising technological advancements to boost demand
                                      TABLE 69 US: DIGITAL THERAPEUTICS MARKET, BY OFFERING, 2021–2028 (USD MILLION)
                                      TABLE 70 US: MARKET, BY REVENUE MODEL, 2021–2028 (USD MILLION)
                                      TABLE 71 US: MARKET, BY APPLICATION, 2021–2028 (USD MILLION)
                                      TABLE 72 US: MARKET FOR TREATMENT/CARE-RELATED APPLICATIONS, BY TYPE, 2021–2028 (USD MILLION)
                                      TABLE 73 US: MARKET FOR PREVENTIVE APPLICATIONS, BY TYPE, 2021–2028 (USD MILLION)
                                      TABLE 74 US: MARKET FOR CNS DISORDERS, BY TYPE, 2021–2028 (USD MILLION)
                                      TABLE 75 US: MARKET, BY SALES CHANNEL, 2021–2028 (USD MILLION)
                                      TABLE 76 US: MARKET FOR B2C SALES CHANNEL, BY BUYER, 2021–2028 (USD MILLION)
                                      TABLE 77 US: MARKET FOR B2B SALES CHANNEL, BY BUYER, 2021–2028 (USD MILLION)
             10.2.3 CANADA
                        10.2.3.1 Favorable government initiatives for advanced healthcare solutions to support market growth
                                      TABLE 78 CANADA: DIGITAL THERAPEUTICS MARKET, BY OFFERING, 2021–2028 (USD MILLION)
                                      TABLE 79 CANADA: MARKET, BY REVENUE MODEL, 2021–2028 (USD MILLION)
                                      TABLE 80 CANADA: MARKET, BY APPLICATION, 2021–2028 (USD MILLION)
                                      TABLE 81 CANADA: MARKET FOR TREATMENT/ CARE-RELATED APPLICATIONS, BY TYPE, 2021–2028 (USD MILLION)
                                      TABLE 82 CANADA: MARKET FOR PREVENTIVE APPLICATIONS, BY TYPE, 2021–2028 (USD MILLION)
                                      TABLE 83 CANADA: MARKET FOR CNS DISORDERS, BY TYPE, 2021–2028 (USD MILLION)
                                      TABLE 84 CANADA: MARKET, BY SALES CHANNEL, 2021–2028 (USD MILLION)
                                      TABLE 85 CANADA: MARKET FOR B2C SALES CHANNEL, BY BUYER, 2021–2028 (USD MILLION)
                                      TABLE 86 CANADA: DIGITAL THERAPEUTICS INDUSTRY FOR B2B SALES CHANNEL, BY BUYER, 2021–2028 (USD MILLION)
     10.3 EUROPE 
             TABLE 87 EUROPE: DIGITAL THERAPEUTICS MARKET, BY COUNTRY, 2021–2028 (USD MILLION)
             TABLE 88 EUROPE: MARKET, BY OFFERING, 2021–2028 (USD MILLION)
             TABLE 89 EUROPE: MARKET, BY REVENUE MODEL, 2021–2028 (USD MILLION)
             TABLE 90 EUROPE: MARKET, BY APPLICATION, 2021–2028 (USD MILLION)
             TABLE 91 EUROPE: MARKET FOR TREATMENT/ CARE-RELATED APPLICATIONS, BY TYPE, 2021–2028 (USD MILLION)
             TABLE 92 EUROPE: MARKET FOR PREVENTIVE APPLICATIONS, BY TYPE, 2021–2028 (USD MILLION)
             TABLE 93 EUROPE: MARKET FOR CNS DISORDERS, BY TYPE, 2021–2028 (USD MILLION)
             TABLE 94 EUROPE: MARKET, BY SALES CHANNEL, 2021–2028 (USD MILLION)
             TABLE 95 EUROPE: MARKET FOR B2C SALES CHANNEL, BY BUYER, 2021–2028 (USD MILLION)
             TABLE 96 EUROPE: DIGITAL THERAPEUTICS MARKET FOR B2B SALES CHANNEL, BY BUYER, 2021–2028 (USD MILLION)
             10.3.1 EUROPE: RECESSION IMPACT
             10.3.2 GERMANY
                        10.3.2.1 Rising investments in digital health applications to drive market
                                      TABLE 97 GERMANY: DIGITAL THERAPEUTICS MARKET, BY OFFERING, 2021–2028 (USD MILLION)
                                      TABLE 98 GERMANY: MARKET, BY REVENUE MODEL, 2021–2028 (USD MILLION)
                                      TABLE 99 GERMANY: MARKET, BY APPLICATION, 2021–2028 (USD MILLION)
                                      TABLE 100 GERMANY: MARKET FOR TREATMENT/ CARE-RELATED APPLICATIONS, BY TYPE, 2021–2028 (USD MILLION)
                                      TABLE 101 GERMANY: MARKET FOR PREVENTIVE APPLICATIONS, BY TYPE, 2021–2028 (USD MILLION)
                                      TABLE 102 GERMANY: MARKET FOR CNS DISORDERS, BY TYPE, 2021–2028 (USD MILLION)
                                      TABLE 103 GERMANY: MARKET, BY SALES CHANNEL, 2021–2028 (USD MILLION)
                                      TABLE 104 GERMANY: MARKET FOR B2C SALES CHANNEL, BY BUYER, 2021–2028 (USD MILLION)
                                      TABLE 105 GERMANY: MARKET FOR B2B SALES CHANNEL, BY BUYER, 2021–2028 (USD MILLION)
             10.3.3 UK
                        10.3.3.1 High adoption of HCIT solutions to propel market
                                      TABLE 106 UK: DIGITAL THERAPEUTICS MARKET, BY OFFERING, 2021–2028 (USD MILLION)
                                      TABLE 107 UK: MARKET, BY REVENUE MODEL, 2021–2028 (USD MILLION)
                                      TABLE 108 UK: MARKET, BY APPLICATION, 2021–2028 (USD MILLION)
                                      TABLE 109 UK: MARKET FOR TREATMENT/CARE-RELATED APPLICATIONS, BY TYPE, 2021–2028 (USD MILLION)
                                      TABLE 110 UK: MARKET FOR PREVENTIVE APPLICATIONS, BY TYPE, 2021–2028 (USD MILLION)
                                      TABLE 111 UK: MARKET FOR CNS DISORDERS, BY TYPE, 2021–2028 (USD MILLION)
                                      TABLE 112 UK: MARKET, BY SALES CHANNEL, 2021–2028 (USD MILLION)
                                      TABLE 113 UK: MARKET FOR B2C SALES CHANNEL, BY BUYER, 2021–2028 (USD MILLION)
                                      TABLE 114 UK: DIGITAL THERAPEUTICS INDUSTRY FOR B2B SALES CHANNEL, BY BUYER, 2021–2028 (USD MILLION)
             10.3.4 FRANCE
                        10.3.4.1 Favorable health insurance system to boost demand
                                      TABLE 115 FRANCE: DIGITAL THERAPEUTICS MARKET, BY OFFERING, 2021–2028 (USD MILLION)
                                      TABLE 116 FRANCE: MARKET, BY REVENUE MODEL, 2021–2028 (USD MILLION)
                                      TABLE 117 FRANCE: MARKET, BY APPLICATION, 2021–2028 (USD MILLION)
                                      TABLE 118 FRANCE: MARKET FOR TREATMENT/ CARE-RELATED APPLICATIONS, BY TYPE, 2021–2028 (USD MILLION)
                                      TABLE 119 FRANCE: MARKET FOR PREVENTIVE APPLICATIONS, BY TYPE, 2021–2028 (USD MILLION)
                                      TABLE 120 FRANCE: MARKET FOR CNS DISORDERS, BY TYPE, 2021–2028 (USD MILLION)
                                      TABLE 121 FRANCE: MARKET, BY SALES CHANNEL, 2021–2028 (USD MILLION)
                                      TABLE 122 FRANCE: MARKET FOR B2C SALES CHANNEL, BY BUYER, 2021–2028 (USD MILLION)
                                      TABLE 123 FRANCE: DIGITAL THERAPEUTICS MARKET FOR B2B SALES CHANNEL, BY BUYER, 2021–2028 (USD MILLION)
             10.3.5 SPAIN
                        10.3.5.1 Rising incidence of chronic diseases to support market growth
                                      TABLE 124 SPAIN: DIGITAL THERAPEUTICS MARKET, BY OFFERING, 2021–2028 (USD MILLION)
                                      TABLE 125 SPAIN: MARKET, BY REVENUE MODEL, 2021–2028 (USD MILLION)
                                      TABLE 126 SPAIN: MARKET, BY APPLICATION, 2021–2028 (USD MILLION)
                                      TABLE 127 SPAIN: MARKET FOR TREATMENT/CARE-RELATED APPLICATIONS, BY TYPE, 2021–2028 (USD MILLION)
                                      TABLE 128 SPAIN: MARKET FOR PREVENTIVE APPLICATIONS, BY TYPE, 2021–2028 (USD MILLION)
                                      TABLE 129 SPAIN: MARKET FOR CNS DISORDERS, BY TYPE, 2021–2028 (USD MILLION)
                                      TABLE 130 SPAIN: MARKET, BY SALES CHANNEL, 2021–2028 (USD MILLION)
                                      TABLE 131 SPAIN: MARKET FOR B2C SALES CHANNEL, BY BUYER, 2021–2028 (USD MILLION)
                                      TABLE 132 SPAIN: MARKET FOR B2B SALES CHANNEL, BY BUYER, 2021–2028 (USD MILLION)
             10.3.6 ITALY
                        10.3.6.1 Increasing focus on preventive care to support market growth
                                      TABLE 133 ITALY: DIGITAL THERAPEUTICS MARKET, BY OFFERING, 2021–2028 (USD MILLION)
                                      TABLE 134 ITALY: MARKET, BY REVENUE MODEL, 2021–2028 (USD MILLION)
                                      TABLE 135 ITALY: MARKET, BY APPLICATION, 2021–2028 (USD MILLION)
                                      TABLE 136 ITALY: MARKET FOR TREATMENT/CARE-RELATED APPLICATIONS, BY TYPE, 2021–2028 (USD MILLION)
                                      TABLE 137 ITALY: MARKET FOR PREVENTIVE APPLICATIONS, BY TYPE, 2021–2028 (USD MILLION)
                                      TABLE 138 ITALY: MARKET FOR CNS DISORDERS, BY TYPE, 2021–2028 (USD MILLION)
                                      TABLE 139 ITALY: MARKET, BY SALES CHANNEL, 2021–2028 (USD MILLION)
                                      TABLE 140 ITALY: MARKET FOR B2C SALES CHANNEL, BY BUYER, 2021–2028 (USD MILLION)
                                      TABLE 141 ITALY: DIGITAL THERAPEUTICS INDUSTRY FOR B2B SALES CHANNEL, BY BUYER, 2021–2028 (USD MILLION)
             10.3.7 REST OF EUROPE
                        TABLE 142 REST OF EUROPE: DIGITAL THERAPEUTICS MARKET, BY OFFERING, 2021–2028 (USD MILLION)
                        TABLE 143 REST OF EUROPE: MARKET, BY REVENUE MODEL, 2021–2028 (USD MILLION)
                        TABLE 144 REST OF EUROPE: MARKET, BY APPLICATION, 2021–2028 (USD MILLION)
                        TABLE 145 REST OF EUROPE: MARKET FOR TREATMENT/ CARE-RELATED APPLICATIONS, BY TYPE, 2021–2028 (USD MILLION)
                        TABLE 146 REST OF EUROPE: MARKET FOR PREVENTIVE APPLICATIONS, BY TYPE, 2021–2028 (USD MILLION)
                        TABLE 147 REST OF EUROPE: MARKET FOR CNS DISORDERS, BY TYPE, 2021–2028 (USD MILLION)
                        TABLE 148 REST OF EUROPE: MARKET, BY SALES CHANNEL, 2021–2028 (USD MILLION)
                        TABLE 149 REST OF EUROPE: MARKET FOR B2C SALES CHANNEL, BY BUYER, 2021–2028 (USD MILLION)
                        TABLE 150 REST OF EUROPE: DIGITAL THERAPEUTICS MARKET FOR B2B SALES CHANNEL, BY BUYER, 2021–2028 (USD MILLION)
     10.4 ASIA PACIFIC 
             TABLE 151 ASIA PACIFIC: DIGITAL THERAPEUTICS MARKET, BY COUNTRY, 2021–2028 (USD MILLION)
             TABLE 152 ASIA PACIFIC: MARKET, BY OFFERING, 2021–2028 (USD MILLION)
             TABLE 153 ASIA PACIFIC: MARKET, BY REVENUE MODEL, 2021–2028 (USD MILLION)
             TABLE 154 ASIA PACIFIC: MARKET, BY APPLICATION, 2021–2028 (USD MILLION)
             TABLE 155 ASIA PACIFIC: MARKET FOR TREATMENT/ CARE-RELATED APPLICATIONS, BY TYPE, 2021–2028 (USD MILLION)
             TABLE 156 ASIA PACIFIC: MARKET FOR PREVENTIVE APPLICATIONS, BY TYPE, 2021–2028 (USD MILLION)
             TABLE 157 ASIA PACIFIC: MARKET FOR CNS DISORDERS, BY TYPE, 2021–2028 (USD MILLION)
             TABLE 158 ASIA PACIFIC: MARKET, BY SALES CHANNEL, 2021–2028 (USD MILLION)
             TABLE 159 ASIA PACIFIC: MARKET FOR B2C SALES CHANNEL, BY BUYER, 2021–2028 (USD MILLION)
             TABLE 160 ASIA PACIFIC: MARKET FOR B2B SALES CHANNEL, BY BUYER, 2021–2028 (USD MILLION)
             10.4.1 ASIA PACIFIC: RECESSION IMPACT
             10.4.2 JAPAN
                        10.4.2.1 Rising incidence of diabetes to propel market
                                      TABLE 161 JAPAN: DIGITAL THERAPEUTICS MARKET, BY OFFERING, 2021–2028 (USD MILLION)
                                      TABLE 162 JAPAN: MARKET, BY REVENUE MODEL, 2021–2028 (USD MILLION)
                                      TABLE 163 JAPAN: MARKET, BY APPLICATION, 2021–2028 (USD MILLION)
                                      TABLE 164 JAPAN: MARKET FOR TREATMENT/CARE-RELATED APPLICATIONS, BY TYPE, 2021–2028 (USD MILLION)
                                      TABLE 165 JAPAN: MARKET FOR PREVENTIVE APPLICATIONS, BY TYPE, 2021–2028 (USD MILLION)
                                      TABLE 166 JAPAN: MARKET FOR CNS DISORDERS, BY TYPE, 2021–2028 (USD MILLION)
                                      TABLE 167 JAPAN: MARKET, BY SALES CHANNEL, 2021–2028 (USD MILLION)
                                      TABLE 168 JAPAN: MARKET FOR B2C SALES CHANNEL, BY BUYER, 2021–2028 (USD MILLION)
                                      TABLE 169 JAPAN: DIGITAL THERAPEUTICS INDUSTRY FOR B2B SALES CHANNEL, BY BUYER, 2021–2028 (USD MILLION)
             10.4.3 CHINA
                        10.4.3.1 Rising investments in application development to propel market
                                      TABLE 170 CHINA: DIGITAL THERAPEUTICS MARKET, BY OFFERING, 2021–2028 (USD MILLION)
                                      TABLE 171 CHINA: MARKET, BY REVENUE MODEL, 2021–2028 (USD MILLION)
                                      TABLE 172 CHINA: MARKET, BY APPLICATION, 2021–2028 (USD MILLION)
                                      TABLE 173 CHINA: MARKET FOR TREATMENT/CARE-RELATED APPLICATIONS, BY TYPE, 2021–2028 (USD MILLION)
                                      TABLE 174 CHINA: MARKET FOR PREVENTIVE APPLICATIONS, BY TYPE, 2021–2028 (USD MILLION)
                                      TABLE 175 CHINA: MARKET FOR CNS DISORDERS, BY TYPE, 2021–2028 (USD MILLION)
                                      TABLE 176 CHINA: MARKET, BY SALES CHANNEL, 2021–2028 (USD MILLION)
                                      TABLE 177 CHINA: MARKET FOR B2C SALES CHANNEL, BY BUYER, 2021–2028 (USD MILLION)
                                      TABLE 178 CHINA: DIGITAL THERAPEUTICS MARKET FOR B2B SALES CHANNEL, BY BUYER, 2021–2028 (USD MILLION)
             10.4.4 INDIA
                        10.4.4.1 Low patient adherence to prescribed treatments to support market growth
                                      TABLE 179 INDIA: DIGITAL THERAPEUTICS MARKET, BY OFFERING, 2021–2028 (USD MILLION)
                                      TABLE 180 INDIA: MARKET, BY REVENUE MODEL, 2021–2028 (USD MILLION)
                                      TABLE 181 INDIA: MARKET, BY APPLICATION, 2021–2028 (USD MILLION)
                                      TABLE 182 INDIA: MARKET FOR TREATMENT/CARE-RELATED APPLICATIONS, BY TYPE, 2021–2028 (USD MILLION)
                                      TABLE 183 INDIA: MARKET FOR PREVENTIVE APPLICATIONS, BY TYPE, 2021–2028 (USD MILLION)
                                      TABLE 184 INDIA: MARKET FOR CNS DISORDERS, BY TYPE, 2021–2028 (USD MILLION)
                                      TABLE 185 INDIA: MARKET, BY SALES CHANNEL, 2021–2028 (USD MILLION)
                                      TABLE 186 INDIA: MARKET FOR B2C SALES CHANNEL, BY BUYER, 2021–2028 (USD MILLION)
                                      TABLE 187 INDIA: MARKET FOR B2B SALES CHANNEL, BY BUYER, 2021–2028 (USD MILLION)
             10.4.5 REST OF ASIA PACIFIC
                        TABLE 188 REST OF ASIA PACIFIC: DIGITAL THERAPEUTICS MARKET, BY OFFERING, 2021–2028 (USD MILLION)
                        TABLE 189 REST OF ASIA PACIFIC: MARKET, BY REVENUE MODEL, 2021–2028 (USD MILLION)
                        TABLE 190 REST OF ASIA PACIFIC: MARKET, BY APPLICATION, 2021–2028 (USD MILLION)
                        TABLE 191 REST OF ASIA PACIFIC: MARKET FOR TREATMENT/ CARE-RELATED APPLICATIONS, BY TYPE, 2021–2028 (USD MILLION)
                        TABLE 192 REST OF ASIA PACIFIC: MARKET FOR PREVENTIVE APPLICATIONS, BY TYPE, 2021–2028 (USD MILLION)
                        TABLE 193 REST OF ASIA PACIFIC: MARKET FOR CNS DISORDERS, BY TYPE, 2021–2028 (USD MILLION)
                        TABLE 194 REST OF ASIA PACIFIC: MARKET, BY SALES CHANNEL, 2021–2028 (USD MILLION)
                        TABLE 195 REST OF ASIA PACIFIC: MARKET FOR B2C SALES CHANNEL, BY BUYER, 2021–2028 (USD MILLION)
                        TABLE 196 REST OF ASIA PACIFIC: DIGITAL THERAPEUTICS INDUSTRY FOR B2B SALES CHANNEL, BY BUYER, 2021–2028 (USD MILLION)
     10.5 LATIN AMERICA 
             TABLE 197 LATIN AMERICA: DIGITAL THERAPEUTICS MARKET, BY OFFERING, 2021–2028 (USD MILLION)
             TABLE 198 LATIN AMERICA: MARKET, BY REVENUE MODEL, 2021–2028 (USD MILLION)
             TABLE 199 LATIN AMERICA: MARKET, BY APPLICATION, 2021–2028 (USD MILLION)
             TABLE 200 LATIN AMERICA: MARKET FOR TREATMENT/CARE-RELATED APPLICATIONS, BY TYPE, 2021–2028 (USD MILLION)
             TABLE 201 LATIN AMERICA: MARKET FOR PREVENTIVE APPLICATIONS, BY TYPE, 2021–2028 (USD MILLION)
             TABLE 202 LATIN AMERICA: MARKET FOR CNS DISORDERS, BY TYPE, 2021–2028 (USD MILLION)
             TABLE 203 LATIN AMERICA: MARKET, BY SALES CHANNEL, 2021–2028 (USD MILLION)
             TABLE 204 LATIN AMERICA: MARKET FOR B2C SALES CHANNEL, BY BUYER, 2021–2028 (USD MILLION)
             TABLE 205 LATIN AMERICA: DIGITAL THERAPEUTICS MARKET FOR B2B SALES CHANNEL, BY BUYER, 2021–2028 (USD MILLION)
             10.5.1 LATIN AMERICA: RECESSION IMPACT
             10.5.2 BRAZIL
                        10.5.2.1 Growing acceptance of evidence-based software applications to boost demand
                                      TABLE 206 BRAZIL: DIGITAL THERAPEUTICS MARKET, BY OFFERING, 2021–2028 (USD MILLION)
                                      TABLE 207 BRAZIL: MARKET, BY REVENUE MODEL, 2021–2028 (USD MILLION)
                                      TABLE 208 BRAZIL: MARKET, BY APPLICATION, 2021–2028 (USD MILLION)
                                      TABLE 209 BRAZIL: MARKET FOR TREATMENT/ CARE-RELATED APPLICATIONS, BY TYPE, 2021–2028 (USD MILLION)
                                      TABLE 210 BRAZIL: MARKET FOR PREVENTIVE APPLICATIONS, BY TYPE, 2021–2028 (USD MILLION)
                                      TABLE 211 BRAZIL: MARKET FOR CNS DISORDERS, BY TYPE, 2021–2028 (USD MILLION)
                                      TABLE 212 BRAZIL: MARKET, BY SALES CHANNEL, 2021–2028 (USD MILLION)
                                      TABLE 213 BRAZIL: MARKET FOR B2C SALES CHANNEL, BY BUYER, 2021–2028 (USD MILLION)
                                      TABLE 214 BRAZIL: MARKET FOR B2B SALES CHANNEL, BY BUYER, 2021–2028 (USD MILLION)
             10.5.3 MEXICO
                        10.5.3.1 Growth in target patient population to support market growth
                                      TABLE 215 MEXICO: DIGITAL THERAPEUTICS MARKET, BY OFFERING, 2021–2028 (USD MILLION)
                                      TABLE 216 MEXICO: MARKET, BY REVENUE MODEL, 2021–2028 (USD MILLION)
                                      TABLE 217 MEXICO: MARKET, BY APPLICATION, 2021–2028 (USD MILLION)
                                      TABLE 218 MEXICO: MARKET FOR TREATMENT/ CARE-RELATED APPLICATIONS, BY TYPE, 2021–2028 (USD MILLION)
                                      TABLE 219 MEXICO: MARKET FOR PREVENTIVE APPLICATIONS, BY TYPE, 2021–2028 (USD MILLION)
                                      TABLE 220 MEXICO: MARKET FOR CNS DISORDERS, BY TYPE, 2021–2028 (USD MILLION)
                                      TABLE 221 MEXICO: MARKET, BY SALES CHANNEL, 2021–2028 (USD MILLION)
                                      TABLE 222 MEXICO: MARKET FOR B2C SALES CHANNEL, BY BUYER, 2021–2028 (USD MILLION)
                                      TABLE 223 MEXICO: DIGITAL THERAPEUTICS INDUSTRY FOR B2B SALES CHANNEL, BY BUYER, 2021–2028 (USD MILLION)
             10.5.4 REST OF LATIN AMERICA
                        TABLE 224 REST OF LATIN AMERICA: DIGITAL THERAPEUTICS MARKET, BY OFFERING, 2021–2028 (USD MILLION)
                        TABLE 225 REST OF LATIN AMERICA: MARKET, BY REVENUE MODEL, 2021–2028 (USD MILLION)
                        TABLE 226 REST OF LATIN AMERICA: MARKET, BY APPLICATION, 2021–2028 (USD MILLION)
                        TABLE 227 REST OF LATIN AMERICA: MARKET FOR TREATMENT/ CARE-RELATED APPLICATIONS, BY TYPE, 2021–2028 (USD MILLION)
                        TABLE 228 REST OF LATIN AMERICA: MARKET FOR PREVENTIVE APPLICATIONS, BY TYPE, 2021–2028 (USD MILLION)
                        TABLE 229 REST OF LATIN AMERICA: MARKET FOR CNS DISORDERS, BY TYPE, 2021–2028 (USD MILLION)
                        TABLE 230 REST OF LATIN AMERICA: MARKET, BY SALES CHANNEL, 2021–2028 (USD MILLION)
                        TABLE 231 REST OF LATIN AMERICA: MARKET FOR B2C SALES CHANNEL, BY BUYER, 2021–2028 (USD MILLION)
                        TABLE 232 REST OF LATIN AMERICA: DIGITAL THERAPEUTICS MARKET FOR B2B SALES CHANNEL, BY BUYER, 2021–2028 (USD MILLION)
     10.6 MIDDLE EAST & AFRICA 
             TABLE 233 MIDDLE EAST & AFRICA: DIGITAL THERAPEUTICS MARKET, BY OFFERING, 2021–2028 (USD MILLION)
             TABLE 234 MIDDLE EAST & AFRICA: MARKET, BY REVENUE MODEL, 2021–2028 (USD MILLION)
             TABLE 235 MIDDLE EAST & AFRICA: MARKET, BY APPLICATION, 2021–2028 (USD MILLION)
             TABLE 236 MIDDLE EAST & AFRICA: MARKET FOR TREATMENT/ CARE-RELATED APPLICATIONS, BY TYPE, 2021–2028 (USD MILLION)
             TABLE 237 MIDDLE EAST & AFRICA: MARKET FOR PREVENTIVE APPLICATIONS, BY TYPE, 2021–2028 (USD MILLION)
             TABLE 238 MIDDLE EAST & AFRICA: MARKET FOR CNS DISORDERS, BY TYPE, 2021–2028 (USD MILLION)
             TABLE 239 MIDDLE EAST & AFRICA: MARKET, BY SALES CHANNEL, 2021–2028 (USD MILLION)
             TABLE 240 MIDDLE EAST & AFRICA: MARKET FOR B2C SALES CHANNEL, BY BUYER, 2021–2028 (USD MILLION)
             TABLE 241 MIDDLE EAST & AFRICA: MARKET FOR B2B SALES CHANNEL, BY BUYER, 2021–2028 (USD MILLION)
             10.6.1 MIDDLE EAST & AFRICA: RECESSION IMPACT
             10.6.2 GCC COUNTRIES
                        10.6.2.1 Improvements in healthcare infrastructure to drive market
                                      TABLE 242 GCC COUNTRIES: DIGITAL THERAPEUTICS MARKET, BY OFFERING, 2021–2028 (USD MILLION)
                                      TABLE 243 GCC COUNTRIES: MARKET, BY REVENUE MODEL, 2021–2028 (USD MILLION)
                                      TABLE 244 GCC COUNTRIES: MARKET, BY APPLICATION, 2021–2028 (USD MILLION)
                                      TABLE 245 GCC COUNTRIES: MARKET FOR TREATMENT/ CARE-RELATED APPLICATIONS, BY TYPE, 2021–2028 (USD MILLION)
                                      TABLE 246 GCC COUNTRIES: MARKET FOR PREVENTIVE APPLICATIONS, BY TYPE, 2021–2028 (USD MILLION)
                                      TABLE 247 GCC COUNTRIES: MARKET FOR CNS DISORDERS, BY TYPE, 2021–2028 (USD MILLION)
                                      TABLE 248 GCC COUNTRIES: MARKET, BY SALES CHANNEL, 2021–2028 (USD MILLION)
                                      TABLE 249 GCC COUNTRIES: MARKET FOR B2C SALES CHANNEL, BY BUYER, 2021–2028 (USD MILLION)
                                      TABLE 250 GCC COUNTRIES: DIGITAL THERAPEUTICS INDUSTRY FOR B2B SALES CHANNEL, BY BUYER, 2021–2028 (USD MILLION)
             10.6.3 REST OF MIDDLE EAST & AFRICA
                        TABLE 251 REST OF MIDDLE EAST & AFRICA: DIGITAL THERAPEUTICS MARKET, BY OFFERING, 2021–2028 (USD MILLION)
                        TABLE 252 REST OF MIDDLE EAST & AFRICA: MARKET, BY REVENUE MODEL, 2021–2028 (USD MILLION)
                        TABLE 253 REST OF MIDDLE EAST & AFRICA: MARKET, BY APPLICATION, 2021–2028 (USD MILLION)
                        TABLE 254 REST OF MIDDLE EAST & AFRICA: MARKET FOR TREATMENT/CARE-RELATED APPLICATIONS, BY TYPE, 2021–2028 (USD MILLION)
                        TABLE 255 REST OF MIDDLE EAST & AFRICA: MARKET FOR PREVENTIVE APPLICATIONS, BY TYPE, 2021–2028 (USD MILLION)
                        TABLE 256 REST OF MIDDLE EAST & AFRICA: MARKET FOR CNS DISORDERS, BY TYPE, 2021–2028 (USD MILLION)
                        TABLE 257 REST OF MIDDLE EAST & AFRICA: MARKET, BY SALES CHANNEL, 2021–2028 (USD MILLION)
                        TABLE 258 REST OF MIDDLE EAST & AFRICA: MARKET FOR B2C SALES CHANNEL, BY BUYER, 2021–2028 (USD MILLION)
                        TABLE 259 REST OF MIDDLE EAST & AFRICA: DIGITAL THERAPEUTICS MARKET FOR B2B SALES CHANNEL, BY BUYER, 2021–2028 (USD MILLION)
 
11 COMPETITIVE LANDSCAPE (Page No. - 237)
     11.1 OVERVIEW 
     11.2 KEY PLAYER STRATEGIES 
             FIGURE 33 OVERVIEW OF STRATEGIES ADOPTED BY KEY PLAYERS
     11.3 REVENUE SHARE ANALYSIS OF TOP MARKET PLAYERS 
             11.3.1 REVENUE ANALYSIS OF KEY PLAYERS IN DIGITAL THERAPEUTICS MARKET, 2020–2022 (USD MILLION)
     11.4 MARKET SHARE ANALYSIS 
             TABLE 260 DIGITAL THERAPEUTICS INDUSTRY: INTENSITY OF COMPETITIVE RIVALRY
             FIGURE 34 DIGITAL THERAPEUTICS INDUSTRY: MARKET SHARE ANALYSIS
     11.5 COMPANY EVALUATION MATRIX 
             11.5.1 STARS
             11.5.2 EMERGING LEADERS
             11.5.3 PERVASIVE PLAYERS
             11.5.4 PARTICIPANTS
                        FIGURE 35 DIGITAL THERAPEUTICS INDUSTRY: COMPANY EVALUATION MATRIX (2022)
             11.5.5 COMPANY FOOTPRINT
                        TABLE 261 MARKET: COMPETITIVE BENCHMARKING OF KEY PLAYERS
                        TABLE 262 MARKET: OFFERING FOOTPRINT ANALYSIS, BY KEY PLAYER
                        TABLE 263 MARKET: APPLICATION FOOTPRINT ANALYSIS, BY KEY PLAYER
                        TABLE 264 MARKET: SALES CHANNEL FOOTPRINT ANALYSIS, BY KEY PLAYER
                        TABLE 265 MARKET: REGIONAL FOOTPRINT ANALYSIS, BY KEY PLAYER
     11.6 COMPANY EVALUATION MATRIX FOR STARTUPS/SMES 
             11.6.1 PROGRESSIVE COMPANIES
             11.6.2 RESPONSIVE COMPANIES
             11.6.3 DYNAMIC COMPANIES
             11.6.4 STARTING BLOCKS
                        FIGURE 36 DIGITAL THERAPEUTICS INDUSTRY: STARTUP/SME EVALUATION MATRIX (2022)
             11.6.5 COMPETITIVE BENCHMARKING OF KEY STARTUPS/SMES
                        TABLE 266 DETAILED LIST OF KEY STARTUPS/SMES
                        TABLE 267 COMPETITIVE BENCHMARKING OF STARTUPS/SMES, BY REGION
     11.7 COMPETITIVE SCENARIOS AND TRENDS 
             TABLE 268 DIGITAL THERAPEUTICS INDUSTRY: PRODUCT LAUNCHES, ENHANCEMENTS, AND APPROVALS (JANUARY 2020–NOVEMBER 2023)
             11.7.1 DEALS
                        TABLE 269 DIGITAL THERAPEUTICS INDUSTRY: DEALS (JANUARY 2020–NOVEMBER 2023)
             11.7.2 OTHER DEVELOPMENTS
                        TABLE 270 DIGITAL THERAPEUTICS MARKET: OTHER DEVELOPMENTS (JANUARY 2020–NOVEMBER 2023)
 
12 COMPANY PROFILES (Page No. - 260)
     12.1 KEY PLAYERS 
(Business Overview, Products/Solutions/Services Offered, Recent Developments, MnM view (Key strengths/Right to win, Strategic choices made, Weakness/competitive threats)*
             12.1.1 NOOM, INC.
                        TABLE 271 NOOM, INC.: BUSINESS OVERVIEW
             12.1.2 TELADOC HEALTH, INC.
                        TABLE 272 TELADOC HEALTH, INC.: BUSINESS OVERVIEW
                        FIGURE 37 TELADOC HEALTH, INC.: COMPANY SNAPSHOT (2022)
             12.1.3 OMADA HEALTH, INC.
                        TABLE 273 OMADA HEALTH, INC.: BUSINESS OVERVIEW
             12.1.4 WELLDOC, INC.
                        TABLE 274 WELLDOC, INC.: BUSINESS OVERVIEW
             12.1.5 COGNIFIT, INC.
                        TABLE 275 COGNIFIT, INC.: BUSINESS OVERVIEW
             12.1.6 HEADSPACE HEALTH
                        TABLE 276 HEADSPACE HEALTH: BUSINESS OVERVIEW
             12.1.7 PROPELLER HEALTH
                        TABLE 277 PROPELLER HEALTH: BUSINESS OVERVIEW
             12.1.8 2MORROW, INC.
                        TABLE 278 2MORROW, INC.: BUSINESS OVERVIEW
             12.1.9 CANARY HEALTH
                        TABLE 279 CANARY HEALTH: BUSINESS OVERVIEW
             12.1.10 CLICK THERAPEUTICS, INC.
                        TABLE 280 CLICK THERAPEUTICS: BUSINESS OVERVIEW
             12.1.11 AKILI, INC.
                        TABLE 281 AKILI, INC.: BUSINESS OVERVIEW
             12.1.12 WELLTHY THERAPEUTICS PVT. LTD.
                        TABLE 282 WELLTHY THERAPEUTICS PVT. LTD.: BUSINESS OVERVIEW
             12.1.13 COGNOA, INC.
                        TABLE 283 COGNOA, INC.: BUSINESS OVERVIEW
             12.1.14 TWILL INC.
                        TABLE 284 TWILL INC.: BUSINESS OVERVIEW
             12.1.15 KAIA HEALTH SOFTWARE GMBH
                        TABLE 285 KAIA HEALTH SOFTWARE GMBH: BUSINESS OVERVIEW
             12.1.16 BETTER THERAPEUTICS, INC.
                        TABLE 286 BETTER THERAPEUTICS, INC.: BUSINESS OVERVIEW
             12.1.17 REALIZEDCARE
                        TABLE 287 REALIZEDCARE: BUSINESS OVERVIEW
             12.1.18 BIOFOURMIS
                        TABLE 288 BIOFOURMIS: BUSINESS OVERVIEW
             12.1.19 AYOGO INCORPORATED
                        TABLE 289 AYOGO INCORPORATED: BUSINESS OVERVIEW
             12.1.20 AMALGAM RX, INC.
                        TABLE 290 AMALGAM RX, INC.: BUSINESS OVERVIEW
     12.2 OTHER PLAYERS 
             12.2.1 MINDABLE HEALTH GMBH
             12.2.2 VIRTA HEALTH CORP.
             12.2.3 HINGE HEALTH
             12.2.4 OREXO AB
             12.2.5 FREESPIRA, INC.
 
*Details on Business Overview, Products/Solutions/Services Offered, Recent Developments, MnM view (Key strengths/Right to win, Strategic choices made, Weakness/competitive threats)* might not be captured in case of unlisted companies.
 
13 APPENDIX (Page No. - 302)
     13.1 DISCUSSION GUIDE 
     13.2 KNOWLEDGESTORE: MARKETSANDMARKETS’ SUBSCRIPTION PORTAL 
     13.3 CUSTOMIZATION OPTIONS 
     13.4 RELATED REPORTS 
     13.5 AUTHOR DETAILS 

The digital therapeutics market research study includes four key steps to estimate the market size. Extensive secondary research was carried out to gather information about the market, its key players and its parent industry. The following step was to authenticate the research outcomes, insights and evaluations through primary research with industry experts across the value chain. A combination of bottom-up and top down approaches were executed to derive the final market sizes. Market segmentation and data triangulation techniques were conducted to estimate the market size of segments and sub-segments.

Secondary Research

Secondary research served as the primary method for identifying and gathering information for the comprehensive, technical, market-oriented, and commercial analysis of the digital therapeutics market. Various secondary sources, including directories, databases such as Bloomberg Businessweek, Factiva, and Wall Street Journal, white papers, and annual reports, were consulted to extract key information about major players, market classification, and segmentation based on industry trends, regional/country-level markets, market developments, and technology perspectives.

Primary Research

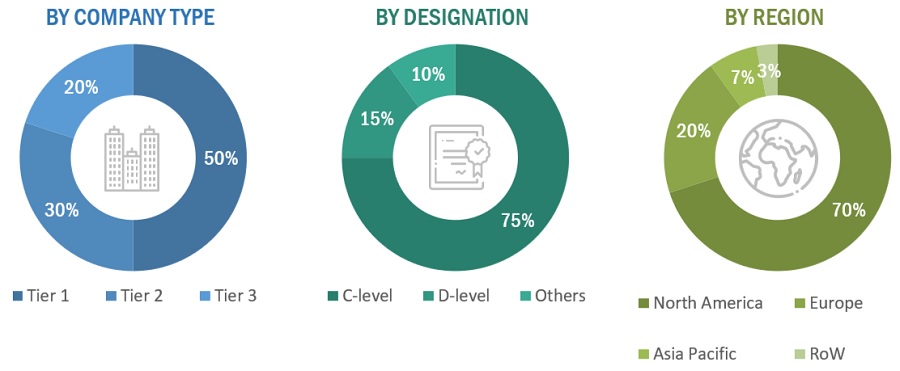
In-depth dialogues were conducted with diverse primary respondents, including subject matter experts (SMEs), key industry participants, industry consultants  and C-level executives of major market players, among other experts. This was done to acquire and validate critical qualitative and quantitative information, as well as to assess the market prospects. Various primary sources from both the supply and demand sides of the market were engaged in interviews to obtain qualitative and quantitative insights. The breakdown of primary respondents is detailed below:
Digital Therapeutics (DTx) Market Size, and Share

Note 1: C-level primaries include CEOs, CFOs, and COOs.

Note 2: Others include sales, marketing, and product and service managers.

Note 3: Tiers are defined based on a company’s total revenue, as of 2021: Tier 1 = >USD 100 million, Tier 2 = USD 100 million to USD 10 million, and Tier 3 = <USD 10 million.

To know about the assumptions considered for the study, download the pdf brochure

Market Size Estimation

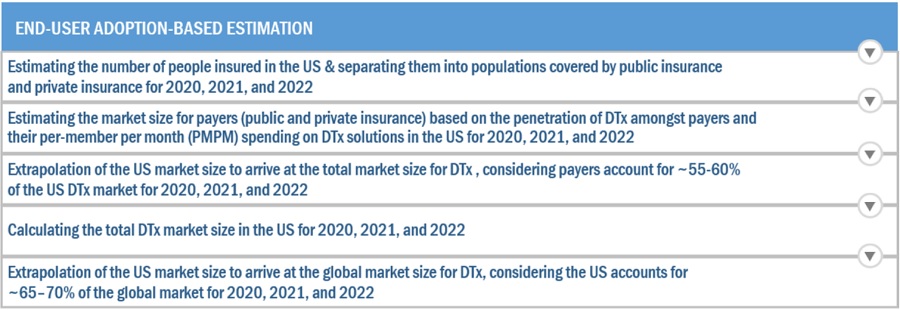
The determination of the total size of the digital therapeutics market involved the utilization of both top-down and bottom-up approaches. These methods were extensively applied to assess the sizes of various subsegments within the market. The research methodology employed for market size estimation is outlined as follows:

  • Identification of key players in the industry and markets was conducted through thorough secondary research. This involved studying annual and quarterly financial reports, regulatory filings, and data books of major market players. Additionally, insights were gathered through interviews with industry experts to obtain detailed market perspectives.
  • All percentage shares, splits, and breakdowns for the global digital therapeutics market were derived from secondary sources and subsequently verified through primary sources.
  • Key macro indicators influencing the revenue growth of market segments and subsegments were considered. These factors were examined in detail, verified through primary research, and analyzed to obtain validated quantitative and qualitative data.
  • The collected market data underwent consolidation and was complemented with detailed inputs and analysis, resulting in the comprehensive presentation found in this report.

Digital Therapeutics: Bottom Up Approach
Digital Therapeutics (DTx) Market Size, and Share

To know about the assumptions considered for the study, Request for Free Sample Report

Digital Therapeutics: Top Down Approach

Digital Therapeutics (DTx) Market Size, and Share

Data Triangulation

Following the determination of the overall market size in the estimation process, the total market was segmented into various segments and subsegments. To finalize the market engineering process and obtain precise statistics for all segments and subsegments, data triangulation and market breakdown procedures were applied whenever applicable. The triangulation of data involved a comprehensive study of various factors and trends from both the demand and supply sides of the market.

Market Definition

Digital therapeutics are health or social care interventions delivered either wholly or significantly through a smart device to induce a behavioral change in the patient. Digital therapies/programs are cost-effective and can improve patient engagement and bring about substantial changes in patient health. These solutions are evidence-based, clinically approved, and prescribed as software-as-a-drug.

Key Stakeholders

  • Digital Therapeutics Platform/Software/App/Therapy/Program Developers
  • Healthcare Institutions/Providers (Hospitals, medical Groups, Physician Practices, Community Clinics, Psychiatrists, and Outpatient Clinics)
  • Healthcare Insurance Companies/Payers
  • Healthcare IT Solution Providers
  • Venture Capitalists
  • Government Agencies
  • Market Research and Consulting Firms

Report Objectives

  • To provide detailed information regarding the major factors influencing market growth, including drivers, restraints, opportunities, and challenges.
  • To define, describe, and forecast the digital therapeutics market based on sales channel, application, and region.
  • To analyze micromarkets with respect to individual growth trends, prospects, and contributions to the overall digital therapeutics market.
  • To forecast the size of market segments in four main regions: North America, Europe, Asia Pacific (APAC), Latin America (LATAM), and Middle East & Africa (MEA).
  • To analyze the opportunities for stakeholders and provide details of the competitive landscape for market leaders.
  • To profile key players and analyze their market shares and core competencies.
  • To track and analyze competitive developments such as product launches, partnerships, agreements, expansions, mergers, and acquisitions in the digital therapeutics market.

Available Customizations

With the given market data, MarketsandMarkets offers customizations as per the company’s specific needs. The following customization options are available for this report.

Company Information

  • Detailed analysis and profiling of additional market players (up to 5)
Custom Market Research Services

We will customize the research for you, in case the report listed above does not meet with your exact requirements. Our custom research will comprehensively cover the business information you require to help you arrive at strategic and profitable business decisions.

Request Customization

Instant Answers with GPT - Ask Now!

Ask real questions. Get complete answers !
Report Code
HIT 4407
Published ON
Jan, 2024
Choose License Type
BUY NOW
  • SHARE
X
Request Customization
Speak to Analyst
Speak to Analyst
OR FACE-TO-FACE MEETING
PERSONALIZE THIS RESEARCH
  • Triangulate with your Own Data
  • Get Data as per your Format and Definition
  • Gain a Deeper Dive on a Specific Application, Geography, Customer or Competitor
  • Any level of Personalization
REQUEST A FREE CUSTOMIZATION
LET US HELP YOU!
  • What are the Known and Unknown Adjacencies Impacting the Digital Therapeutics Market
  • What will your New Revenue Sources be?
  • Who will be your Top Customer; what will make them switch?
  • Defend your Market Share or Win Competitors
  • Get a Scorecard for Target Partners
CUSTOMIZED WORKSHOP REQUEST
+1-888-600-6441
  • Call Us
  • +1-888-600-6441 (Corporate office hours)
  • +1-888-600-6441 (US/Can toll free)
  • +44-800-368-9399 (UK office hours)
CONNECT WITH US
ABOUT TRUST ONLINE
©2024 MarketsandMarkets Research Private Ltd. All rights reserved
DMCA.com Protection Status Website Feedback