
Digital Health Market Size, Growth, Share & Trends Analysis

Digital Health Market by Offering (Hardware(Wearables, Implants), Apps (Telehealth (RPM), DTx, Patient Portals, Pharmacy)), Disease (Diabetes, CVS, Mental Health), Use Case (Treatment, Monitoring, Rehab & Recovery), End User, and Region - Global Forecast to 2030


OVERVIEW
Source: Secondary Research, Interviews with Experts, MarketsandMarkets Analysis
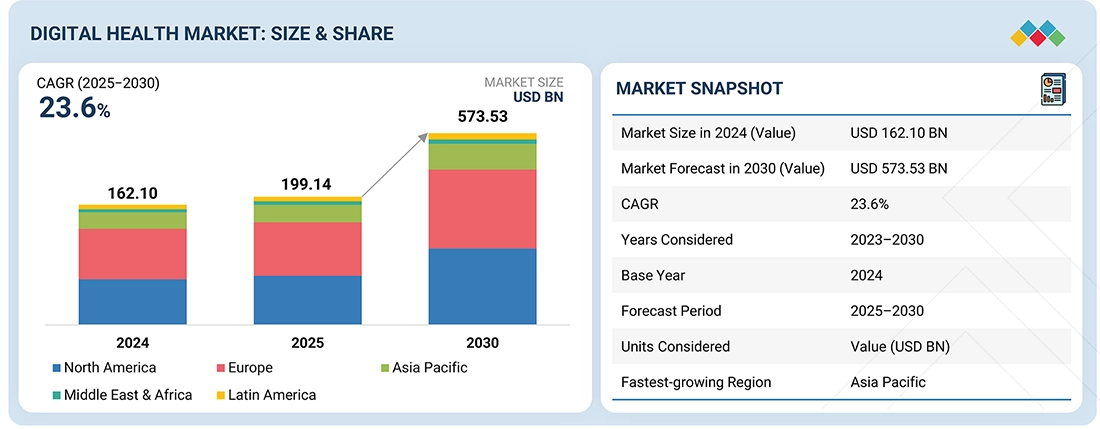
The global digital health market is expected to reach USD 573.53 billion by 2030, up from USD 199.14 billion in 2025, at a CAGR of 23.6% during the forecast period. Market growth is mainly driven by technological improvements, increasing demand for remote care, chronic disease management, cost reduction efforts, regulatory backing, and greater patient involvement.
KEY TAKEAWAYS
- The North America digital health market accounted for a 43.4% revenue share in 2025.
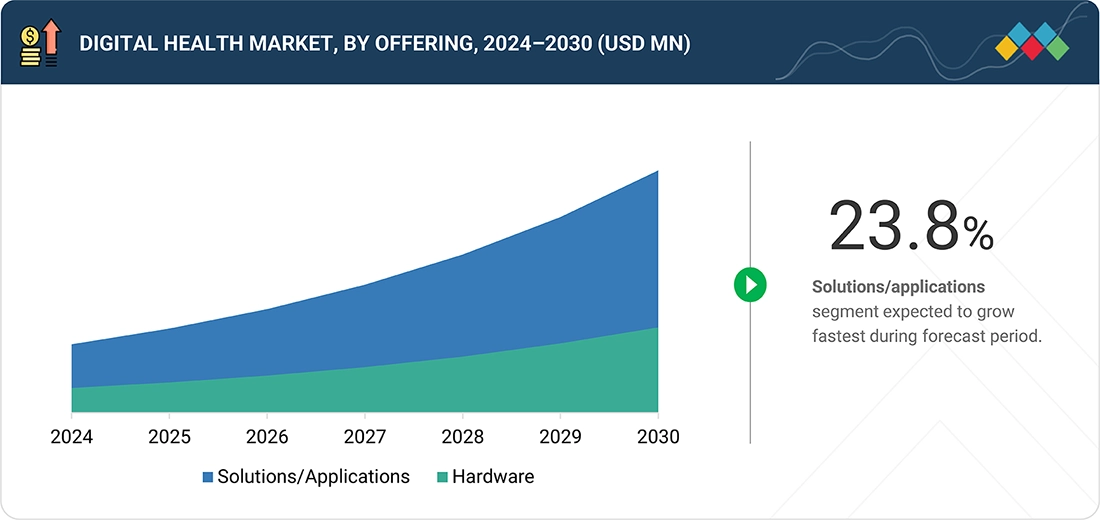
- By offering, the solutions/applications segment is expected to register the highest CAGR of 23.8%.
- By disease, the mental health & behavioural health segment is projected to grow at the fastest rate from 2025 to 2030.
- By use case, the preventive care & wellness segment is expected to dominate the market.
- By end user, the patients and consumers segment is expected to register the highest CAGR of 24.3%.
- The major market players have adopted both organic and inorganic strategies including partnerships and investments. For instance, Medtronic (Ireland), OMRON Healthcare, Inc. (Japan), Koninklijke Philips N.V. (Netherlands), Apple Inc. (US), and Dexcom, Inc. (US) entered into number of agreements and partnerships to cater to the growing demand for digital health infrastructure.
- Trudoc, Caresimple, and Biobeat, among others, have distinguished themselves among startups and SMEs by securing strong footholds in specialized niche areas, underscoring their potential as emerging market leaders
The digital health market is advancing steadily, propelled by the increasing demand for value-based care, the rising burden of chronic diseases, and a growing emphasis on preventive healthcare. Government-led initiatives India’s Ayushman Bharat Digital Mission (ABDM) is building a national digital health infrastructure, spanning EHRs, citizen health IDs, and analytics.
TRENDS & DISRUPTIONS IMPACTING CUSTOMERS' CUSTOMERS
The digital health market is undergoing rapid transformation driven by the growing adoption of remote monitoring, telehealth, and AI-enabled predictive care solutions. Increasing regulatory focus on data security and compliance is accelerating the shift toward integrated cloud-based health platforms. Disruptions such as real-time patient monitoring, digital therapeutics, and interoperable electronic health records are enabling faster decision-making, reducing hospital readmissions, and improving patient engagement. As hospitals, payers, and pharma companies embrace digital ecosystems, the impact is evident in enhanced patient safety, operational efficiency, and significant cost savings across the healthcare value chain.
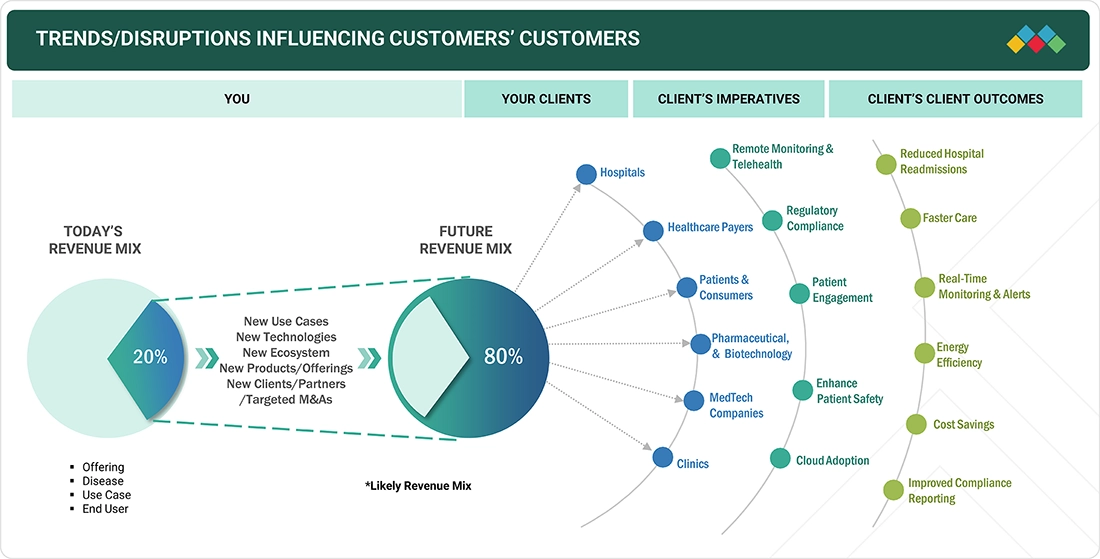
Source: Secondary Research, Interviews with Experts, MarketsandMarkets Analysis
MARKET DYNAMICS
Level
-
Rising geriatric population and subsequent increase in prevalence of chronic diseases

-
Increasing penetration of smartphones

Level
-
Low Digital Literacy in Certain Demographics

-
Interoperability issues

Level
-
Shift toward intelligent health ecosystem to deliver personalized health experiences

-
Increasing shift towards outpatient care model

Level
-
Healthcare gap in emerging economies

-
Data Privacy and security concerns

Source: Secondary Research, Interviews with Experts, MarketsandMarkets Analysis
Driver: Rising geriatric population and subsequent increase in prevalence of chronic diseases
The growing elderly population, along with the rising rate of chronic illnesses, significantly propels the digital health market forward. Older adults are more vulnerable to long-term conditions like diabetes, heart disease, and neurological disorders, creating an urgent need for ongoing and personalized care. Digital health solutions, including remote monitoring devices, mobile apps, and AI-supported tools, enable continuous health tracking and prompt medical interventions, often without the need for visits to healthcare facilities. These technologies not only enhance the well-being of aging patients but also reduce the burden on healthcare systems by decreasing hospitalizations and supporting more efficient care delivery.
Restraint: Low digital literacy in certain demographics
Limited digital literacy among certain population groups presents a major obstacle to the growth of the digital health market. Older adults, those living in remote or underserved areas, and individuals with little exposure to digital technologies often struggle to use health-related apps, telemedicine services, or connected devices. This lack of familiarity can limit engagement with digital health platforms, decreasing their ability to improve care delivery. To promote equitable access, there is a need for simplified user interfaces, language options, and educational programs that foster confidence and skills in using digital health tools.
Opportunity: Shift toward intelligent ecosystem to deliver personalized health experience
The shift toward a smarter health ecosystem is creating significant growth opportunities for the digital health industry. By integrating artificial intelligence, real-time analytics, connected medical devices, and cloud technology, healthcare providers can improve decision-making, streamline clinical workflows, and enable timely interventions. These technologies support continuous monitoring, better risk assessment, and personalized treatment plans based on real-time patient data. As demand increases for efficient and data-driven care models, digital health solutions are becoming key to developing responsive and flexible healthcare systems.
Challenge: Healthcare gap in emerging economies
Emerging economies face a unique set of healthcare challenges, marked by the dual burden of high demand and limited resources. Factors such as widespread poverty, inadequate infrastructure, workforce shortages, political instability, and a high prevalence of communicable and chronic diseases heavily obstruct healthcare delivery. In countries like Nigeria, the situation is further worsened by security risks, environmental damage, and systemic underinvestment, which lead to significant inequalities in access to quality care.
Digital Health Market: COMMERCIAL USE CASES ACROSS INDUSTRIES
| COMPANY | USE CASE DESCRIPTION | BENEFITS |
|---|---|---|
 |
Remote patient monitoring devices and digital care management platforms enabling continuous health data collection | Improved chronic disease outcomes, reduced hospital readmissions, enhanced patient engagement |
 |
Connected glucose monitors and wearable biosensors for real-time patient data sharing via mobile apps | Better therapy adherence, timely adjustments based on real-world data, and improved patient-provider communication |
 |
Continuous glucose monitoring (CGM) systems integrated with smartphones and digital health apps, enabling real-time remote tracking | Real-time intervention possible, better management of glucose levels, increased patient safety |
 |
Comprehensive telehealth solutions including RPM platforms, virtual care delivery, and integrated health data analytics to support hospital-at-home models | Greater access to care, lower healthcare costs, efficient resource utilization, improved patient satisfaction |
 |
Wearable fitness and health tracking devices providing real-time monitoring of activity, sleep, heart rate, and integration with RPM and telemedicine services | Early detection of health risks, better self-management, higher fitness adherence, integration with telehealth services |
Logos and trademarks shown above are the property of their respective owners. Their use here is for informational and illustrative purposes only.
MARKET ECOSYSTEM
The digital health market ecosystem includes key segments such as key players (Medtronic, Philips Healthcare, Fitbit, Abbott, Omron) providing connected medical devices and integrated health solutions; key startups (Vivalnk, CareSimple, Biobeat) driving innovation in specialized health tech segments; cloud service providers (AWS, Microsoft, Tencent Cloud, Alibaba Cloud, IBM Cloud) offering secure, scalable infrastructure for data management and AI analytics; and end users (Mayo Clinic, Apollo Hospitals, Cleveland Clinic) implementing digital solutions for improved patient care and operational efficiency. This interconnected ecosystem is transforming healthcare delivery globally.
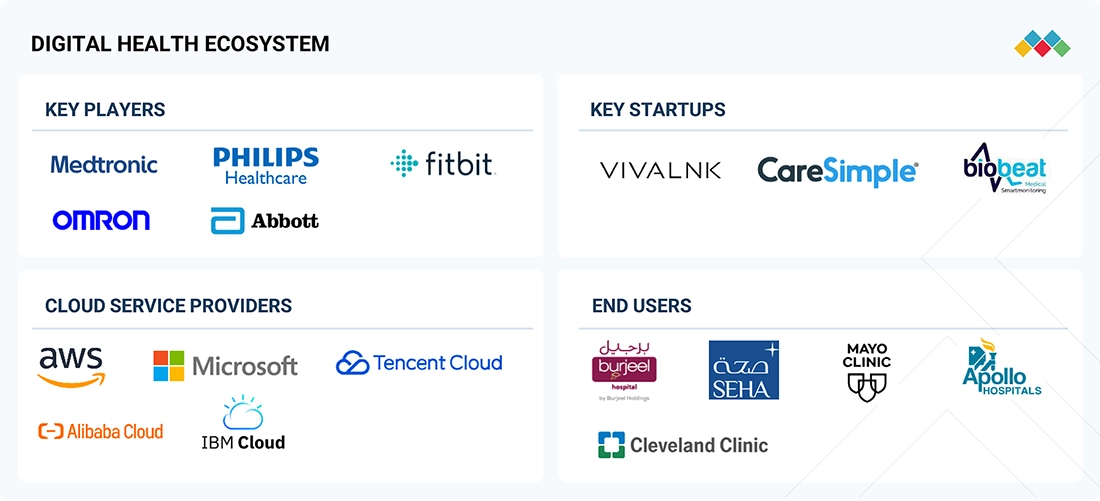
Logos and trademarks shown above are the property of their respective owners. Their use here is for informational and illustrative purposes only.
MARKET SEGMENTS
Source: Secondary Research, Interviews with Experts, MarketsandMarkets Analysis
Digital Health Market, By Offering
In 2024, the solutions/application segment held the largest share of the digital health market. Growth is driven by the integration of telemedicine across primary and specialty care, chronic disease management, behavioral health, and direct-to-consumer virtual services. Key drivers include widespread adoption among hospitals and clinics, insurance reimbursement parity, and growing use of AI for diagnostics, triage, and clinical decision support. Advances in wearable biosensors and mobile health (mHealth) tools are also fueling remote monitoring, allowing clinicians to track real-time health signals and intervene earlier in chronic cases.
Digital Health Market, By Disease
In 2024, diabetes segment accounted for the largest share of the digital health market. This growth is driven by the high global prevalence of diabetes and the increasing need for effective management solutions. Digital health technologies for diabetes include smartphone applications for glucose monitoring, continuous glucose monitoring systems, smart insulin pens, and wearable devices that track physical activity and real-time health data. These solutions enable patients to actively engage in managing their condition while allowing healthcare providers to remotely monitor and intervene when necessary.
Digital Health Market, By Use Case
In 2024, the preventive care & wellness segment accounted for the largest share of the digital health market. The segment includes digital solutions such as fitness trackers, health coaching apps, telehealth-enabled preventive services, and AI-powered personalized wellness programs that help users monitor physical activity, nutrition, stress, and sleep. These technologies support early disease detection, lifestyle modifications, and ongoing health maintenance, reducing the risk of chronic illnesses.
Digital Health Market, By End User
In 2024, the healthcare providers segment accounted for the largest share of the digital health market. Healthcare providers hold the largest share of the digital health market, with hospitals, clinics, and specialty care centers increasingly adopting digital health solutions to improve care delivery, efficiency, and patient outcomes. Providers use technologies such as electronic health records (EHRs), telemedicine platforms, remote patient monitoring systems, and AI-powered diagnostic tools to support value-based care models and real-time data access. This adoption is driven by the need for integrated, interoperable healthcare systems that enable personalized, continuous care beyond traditional settings.
REGION
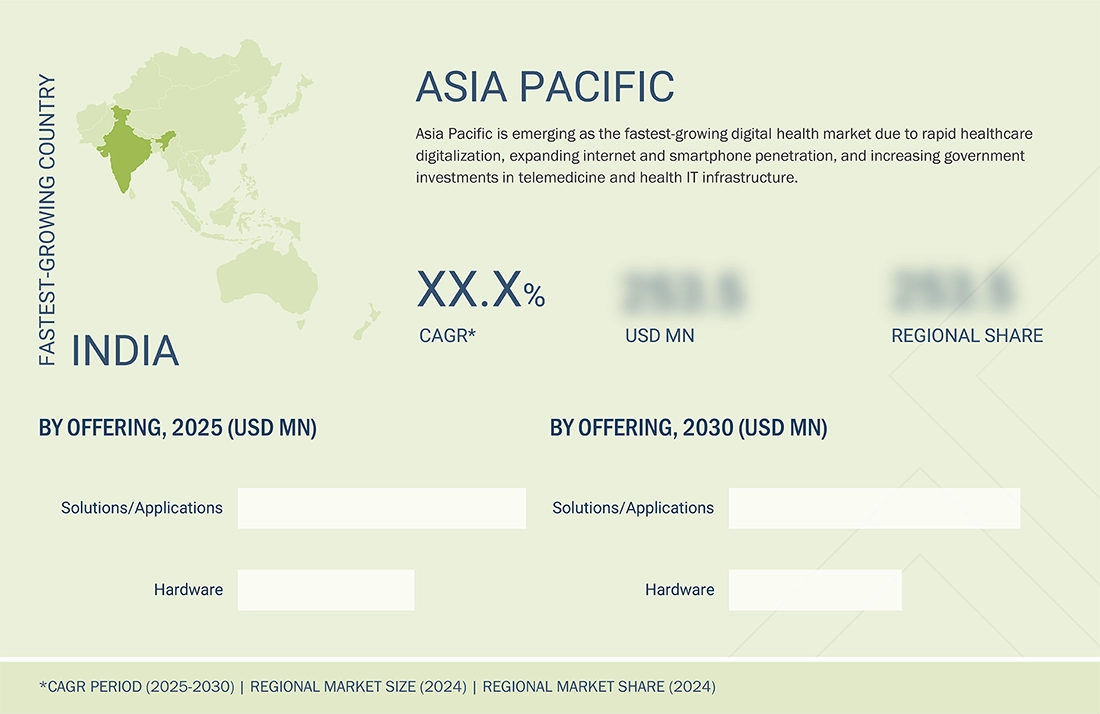
Asia Pacific to be fastest-growing region in global digital health market during forecast period
Asia Pacific region is the fastest-growing market for digital health, driven by rapid technological adoption, expanding healthcare infrastructure, and strong government initiatives promoting digital transformation in healthcare. Countries such as China, India, Japan, South Korea, and Australia are seeing increased use of telemedicine, mobile health (mHealth), electronic health records (EHRs), and AI-driven diagnostics. Additionally, supportive policies like India’s Ayushman Bharat Digital Mission and China’s Healthy China 2030 plan are advancing large-scale digital integration across healthcare systems.
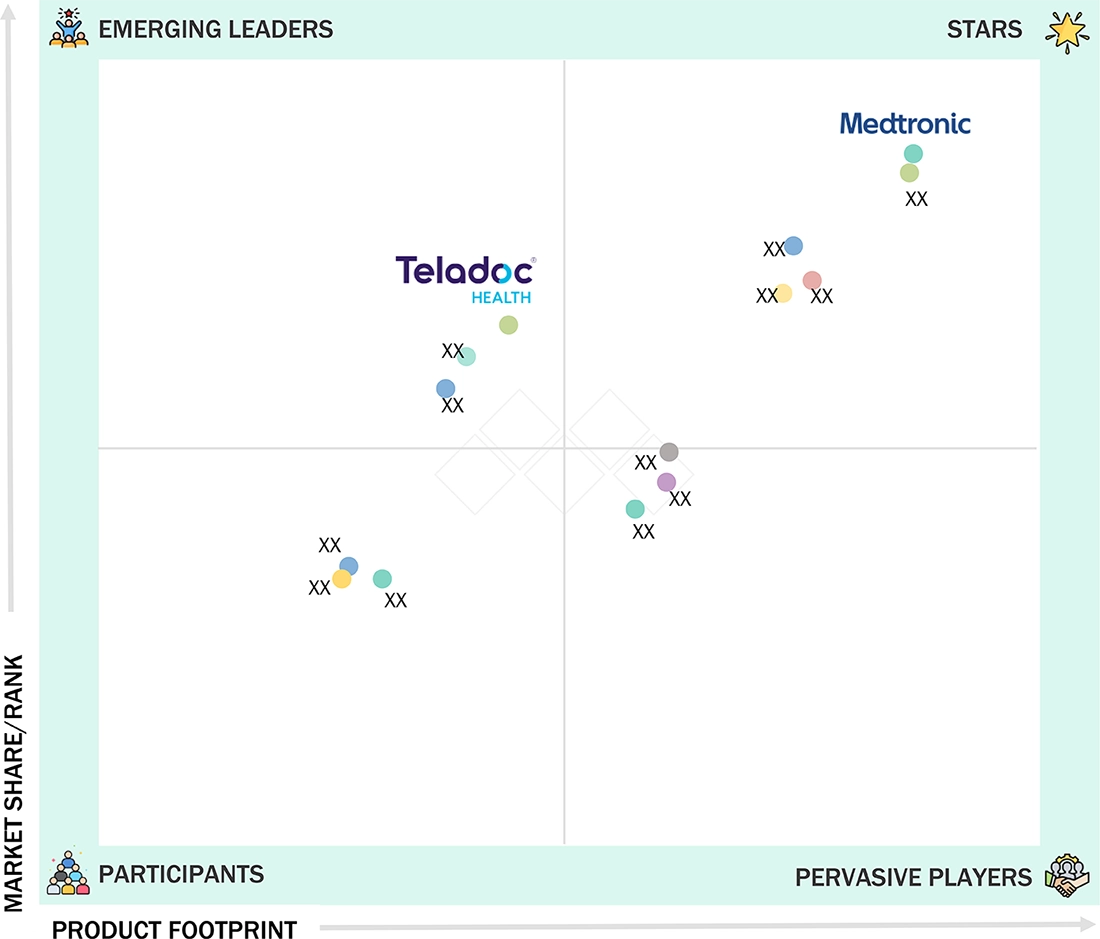
Digital Health Market: COMPANY EVALUATION MATRIX
In the digital health market matrix, Medtronic (Star) leads with a strong market presence and extensive product portfolio, driven by its due to its comprehensive portfolio of connected medical devices and remote monitoring platforms that enable proactive, patient-centered care. The company’s digital offerings include the CareLink network, which allows physicians to remotely monitor cardiac device data. Teladoc Health (Emerging Leader) is gaining traction. The company offers a broad spectrum of telemedicine services, including virtual doctor consultations, mental health therapy, and chronic condition management.
Source: Secondary Research, Interviews with Experts, MarketsandMarkets Analysis
KEY MARKET PLAYERS
MARKET SCOPE
| REPORT METRIC | DETAILS |
|---|---|
| Market Size in 2024 (Value) | USD 162.10 Billion |
| Market Forecast in 2030 (value) | USD 573.53 Billion |
| Growth Rate | CAGR of 23.6% from 2025-2030 |
| Years Considered | 2023-2030 |
| Base Year | 2024 |
| Forecast Period | 2025-2030 |
| Units Considered | Value (USD Million/Billion) |
| Report Coverage | Revenue forecast, company ranking, competitive landscape, growth factors, and trends. |
| Segments Covered |
|
| Regions Covered | North America, Asia Pacific, Europe, Latin America, Middle East & Africa |
| Related Segment & Geographic Reports | Mental Health Apps Market |
WHAT IS IN IT FOR YOU: Digital Health Market REPORT CONTENT GUIDE
DELIVERED CUSTOMIZATIONS
We have successfully delivered the following deep-dive customizations:
| CLIENT REQUEST | CUSTOMIZATION DELIVERED | VALUE ADDS |
|---|---|---|
| Local Competitive Landscape | Profiles of key manufacturers (e.g., Abbott, Medtronic, Dexcom, Inc.), covering regional market share, segmental revenue, recent product launches, and recent innovations in telemedicine, remote monitoring, AI-driven analytics | Enables competitive benchmarking, identification of technology and portfolio gaps, and strategic planning for digital infrastructure investments |
| Regional Market Entry Strategy | Detailed analysis of region-specific market entry barriers, such as regulatory requirements, reimbursement policies, digital infrastructure readiness, patient adoption rates, and key partnership opportunities, including payer collaborations and provider network | Reduces entry risk for new market entrants, accelerates regional product adoption and supports localization strategies |
| Local Risk & Opportunity Assessment | Identification of evolving regulatory frameworks, cybersecurity and data privacy challenges, technology acceptance hurdles, and untapped opportunities in behavioral health, chronic disease management | Supports proactive risk mitigation, strategic investments, and adaptation to evolving clinical practices and regulatory framework |
| Technology Adoption by Region | Insights on regional adoption patterns for telemedicine platforms, wearable device integrations, AI-powered diagnostics, and digital therapeutics, focusing on drivers such as government health initiatives and digital literacy | Guides R&D focus, product positioning, and investment decisions for targeted technology deployment and regional innovation partnerships |
RECENT DEVELOPMENTS
- May 2025 : Medtronic partnered with Corsano Health to exclusively distribute its medically certified multiparameter wearable in Western Europe. The wearable enables continuous real-time monitoring of vital signs such as heart rate, respiration, ECG, and cuffless blood pressure. It enhances hospital and hospital-at-home care by supporting predictive analytics and AI-powered clinical decision-making.
- December 2024 : Dexcom, Inc. launched a proprietary GenAI platform integrated with its CGM ecosystem, starting with the Stelo OTC iCGM. Built on Google Cloud’s Vertex AI and Gemini models, it enhances weekly insights with personalized, contextual recommendations based on glucose, activity, and sleep data.
- June 2024 : Abbott Lingo (consumer biowearable glucose tracker) and Libre Rio (OTC CGM for Type 2 diabetes) received FDA approval. The device allows direct-to-consumer access to metabolic monitoring with high-accuracy sensors.
Table of Contents
 Exclusive indicates content/data unique to MarketsandMarkets and not available with any competitors.
Methodology
The study involved several key activities to estimate the current size of the digital health market. Extensive secondary research was conducted to gather information on this market. The next step was to validate the findings, assumptions, and size estimates by consulting industry experts throughout the value chain through primary research. Various methods, including top-down and bottom-up approaches, were employed to estimate the overall market size. Following this, market segmentation and data triangulation techniques were used to determine the size of specific segments and subsegments within the digital healthcare market.
Secondary Research
This research study involved the wide use of secondary sources, directories, and databases such as Dun & Bradstreet, Bloomberg Business, and Factiva; white papers, annual reports, and companies’ house documents; investor presentations; and the SEC filings of companies. The market for companies providing digital healthcare solutions is assessed using secondary data from both paid and free sources. This involves analyzing the product portfolios of major players in the industry and evaluating these companies based on their performance and quality. Various resources were utilized in the secondary research process to gather information for this study. The sources include annual reports, press releases, investor presentations, white papers, academic journals, certified publications, articles by recognized authors, directories, and databases.
Secondary research was used to identify and collect information useful for the extensive, technical, market-oriented, and commercial study of the digital healthcare market. It was also used to obtain important information about the key players and market classification and segmentation according to industry trends to the bottom-most level, and key developments related to market and technology perspectives. A database of the key industry leaders was also prepared using secondary research.
Primary Research
In the primary research process, various primary sources from both the supply and demand sides were interviewed to obtain qualitative and quantitative information for this report. Primary sources are mainly industry experts from the core and related industries and preferred suppliers, manufacturers, distributors, technology developers, researchers, and organizations related to all segments of this industry’s value chain. In-depth interviews were conducted with various primary respondents, including key industry participants, subject-matter experts, C-level executives of key market players, and industry consultants, among other experts, to obtain and verify the critical qualitative and quantitative information as well as assess prospects.
Primary research was conducted to identify segmentation types, industry trends, key players, and key market dynamics such as drivers, restraints, opportunities, challenges, and strategies adopted by key players.
After completing the market engineering process, which includes calculations for market statistics, market breakdown, size estimations, forecasting, and data triangulation, extensive primary research was conducted. This research aimed to gather information and verify the critical numbers obtained during the market analysis. Additionally, primary research was conducted to identify different types of market segmentation, analyze industry trends, evaluate the competitive landscape of digital healthcare offered by various players, and understand key market dynamics such as drivers, restraints, opportunities, challenges, industry trends, and strategies employed by key market participants.
In the complete market engineering process, the top-down and bottom-up approaches and several data triangulation methods were extensively used to perform the market estimation and market forecasting for the overall market segments and subsegments listed in this report. Extensive qualitative and quantitative analysis was performed on the complete market engineering process to list the key information/insights throughout the report.
A breakdown of the primary respondents:

Others include sales, marketing, and product managers.
Note: Tiers are defined based on a company’s total revenue, as of 2024: Tier 1 = >USD 1 billion, Tier 2 = USD 500 million to USD 1 billion, and Tier 3 = < USD 500 million.
To know about the assumptions considered for the study, download the pdf brochure
Market Size Estimation
The market size estimates and forecasts provided in this study are derived through a mix of the bottom-up approach (revenue share analysis of leading players) and top-down approach (assessment of utilization/adoption/penetration trends, by offering, disease, use case, end user, and region).

Market Definition
The digital health market covers hardware, software, and services that use technology to improve healthcare delivery, patient outcomes, and system efficiency. It includes consumer-facing wellness, self-management applications, regulated medical software and device solutions, interoperable platforms, connectivity tools, and embedded sensor systems. Its applications span preventive care, diagnosis, treatment, patient engagement, remote monitoring, and health system management, driving more personalized, efficient, and data-driven healthcare.
Stakeholders
- Healthcare Providers
- Digital Health Providers
- Healthcare Payers
- Healthcare Consumers
- Academic Research Institutes
- Pharmaceutical and Biotechnology Companies
- Medical Device Companies
- Telehealth & Virtual Care Providers
- Government Institutions
- Market Research and Consulting Firms
- Venture Capitalists and Investors
Report Objectives
- To define, describe, and forecast the global digital health market based on offering, disease, use case, end user, and region
- To provide detailed information regarding the factors influencing the growth of the market (such as drivers, restraints, opportunities, and challenges)
- To strategically analyze micromarkets with respect to individual growth trends, prospects, and contributions to the overall digital health market
- To analyze market opportunities for stakeholders and provide details of the competitive landscape for market leaders
- To forecast the size of the digital health market in five main regions (along with their respective key countries): North America, Europe, the Asia Pacific, Latin America, and the Middle East & Africa
- To profile key players and comprehensively analyze their product portfolios, market positions, and core competencies in the market
- To track and analyze competitive developments such as product & service launches, expansions, partnerships, agreements, and collaborations, and acquisitions in the digital health market
- To benchmark players within the digital health market using the Company Evaluation Matrix framework, which analyzes market players on various parameters within the broad categories of business strategy, market share, and product offering
Key Questions Addressed by the Report
Which are the top industry players in the global digital health market?
The top players in the global digital health market include Medtronic (Ireland), Abbott (US), OMRON Healthcare, Inc. (Japan), and Koninklijke Philips N.V. (Netherlands).
Which offerings have been included in the digital health market report?
The report includes hardware and solutions/applications as the main offerings.
Which geographical region is leading in the global digital health market?
The market is segmented into North America, Europe, Asia Pacific, and Rest of the World, with North America holding the largest share and Asia Pacific anticipated to record the fastest growth during the forecast period.
Which end user segments have been included in the digital health market report?
The end user segments in the report include pharmaceutical, biotechnology, and MedTech companies, patients and consumers, healthcare providers, healthcare payers, and other end users such as academic institutes, research centers, and government bodies.
What is the total CAGR expected to be recorded for the digital health market during 2025–2030?
The digital health market is expected to record a CAGR of 23.6% from 2025 to 2030.
Need a Tailored Report?
Customize this report to your needs
Get 10% FREE Customization
Customize This ReportPersonalize This Research
- Triangulate with your Own Data
- Get Data as per your Format and Definition
- Gain a Deeper Dive on a Specific Application, Geography, Customer or Competitor
- Any level of Personalization
Let Us Help You
- What are the Known and Unknown Adjacencies Impacting the Digital Health Market
- What will your New Revenue Sources be?
- Who will be your Top Customer; what will make them switch?
- Defend your Market Share or Win Competitors
- Get a Scorecard for Target Partners

Custom Market Research Services
We Will Customise The Research For You, In Case The Report Listed Above Does Not Meet With Your Requirements
Get 10% Free CustomisationTESTIMONIALS

JAYANT RAJPUROHIT
Director of Market Insights, Data and Analytics
SFI Health,
Leading Pharmaceutical Companywww.sfihealth.com/

We at SFI Health approached MarketsandMarkets for an Opportunity Assessment on "Incidence and Prevalence of Focus Indications" as we wanted to know the most attractive HCPs like Physician, Functional MD, Naturopath and Pharmacist. The project was critical for us to ensure our focus on the right target which would enable sustainable growth and profitability for SFI Health. The business insights provided exceeded our expectations and we were extremely impressed. The team at MarketsandMarkets is highly professional and detail oriented and very well understood our business needs. MarketsandMarkets offers a unique combination of expertise and dedicated engagement model. We identified 2 new products to be launched in coming months, based on the research findings provided by MarketsandMarkets. We are happy with the services and would strongly recommend MarketsandMarkets to my peers in the industry.

BEATRIZ DE LA CALLE
Head of Commercial Analytics
Qualicaps,
Leading Pharmaceutical Companywww.qualicaps.com/

We partnered with MarketsandMarkets for an assessment study on hard empty capsules. The team was extremely professional in understanding our business requirements and we received timely responses to all our queries. The market intelligence and the recommendations has met our business requirements. We were extremely impressed to see the final study results; it really exceeded our expectations. The market intelligence offered by MarketsandMarkets, and clarity on next steps will help us achieve our business objective for the Year 2021. We are happy with the services and would strongly recommend MarketsandMarkets to my peers in the industry.

Bob Williams,
Senior Director Business Development & Innovation
Bracco Diagnostics Inc.,
Italian Multinational in life sciences sector and a World Leader in imaging diagnosticsimaging.bracco.com/us-en
We were pleased with targeted insights that MarketsandMarkets identified from a custom study on the 'Radiation Dose Management Solutions Market'. Your team identified and characterized the market participants as well as underlying trends accurately. This study was useful to Bracco in formulating business strategies for our dose monitoring product lines and we thank MarketsandMarkets for the job well done.
Cody Coonradt,
Market Development and Strategy Manager
3M Health Information Systems,
Leader in Health care Coding, Payment & Analytics Solutions.www.3m.com/3M/en_US/health-information-systems-us
The value for our organization comes from three things: depth of research, specificity of segments and being easy to work with. As important as the first two are, the third can't be underestimated. MarketsandMarkets, maybe more than any other research vendor, wants to know what is top of mind for our team and what big questions we are grappling to answer.
Their customer first approach and high value engagement model, have given us great analysis and excellent value for money


Growth opportunities and latent adjacency in Digital Health Market