Digital Utility Market by Network (Generation, Transmission and Distribution, and Retail), Technology (Hardware and Integrated Solutions (Cloud and Software, Services)), and Region (North America, Europe, and Asia-Pacific) - Global Forecast to 2022


[144 Pages Report] The global digital utility market was valued at USD 121.54 Billion in 2016 and is expected to grow at a CAGR of 12.57%, from 2017 to 2022. An increase in the number of distributed and renewable power generation projects, energy efficiency mandates demanding carbon emission reduction, and strict regulatory requirements for electric utilities are the major drivers that would trigger growth in the market.
The years considered for the study are as follows:
- Base Year: 2016
- Estimated Year: 2017
- Projected Year: 2022
- Forecast Period: 2017 to 2022
The base year considered for company profiles is 2016. Whenever information was unavailable for the base year, the prior year has been considered.
Objectives of the Study
- To define, describe, and forecast the global digital utility market by network, technology, and region
- To provide detailed information on the major factors influencing the growth of the market (drivers, restraints, opportunities, and industry-specific challenges)
- To strategically analyze the market with respect to individual growth trends, future prospects, and contribution of each segment to the market
- To analyze market opportunities for stakeholders and details of a competitive landscape for market leaders
- To strategically profile key players and comprehensively analyze their market rankings and core competencies
- To track and analyze competitive developments such as contracts & agreements, expansions, new product developments, and mergers & acquisitions in the digital utility market
Research Methodology
This research study involved the use of extensive secondary sources, directories, and databases, such as Hoover�s, Bloomberg Businessweek, Factiva, and OneSource, to identify and collect information useful for a technical, market-oriented, and commercial study of the global market. Primary sources are mainly industry experts from core and related industries, OEMs, vendors, suppliers, technology developers, alliances, and organizations related to all segments of this industry�s value chain. The points given below explain the research methodology.
- Study of the annual revenue and market developments of the major players providing digital utility solutions
- Analysis of digital transformation for electric utilities
- Assessment of future trends and growth of the market
- Assessment of the digital utility market with respect to the demand for each type of digital technology used for different applications
- Study of market trends in various regions and countries, by network, of the market
- Study of contracts and developments related to digital utility by key players across different regions
- Finalization of overall market sizes by triangulating the supply-side data, which includes product developments and annual revenues of companies providing digital utility solutions across the globe
After arriving at the overall digital utility market size, the total market has been split into several segments and subsegments. The figure given below illustrates the breakdown of primaries conducted during the research study on the basis of company type, designation, and region.
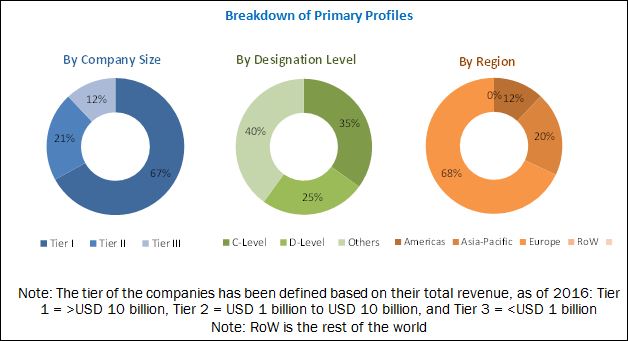
To know about the assumptions considered for the study, download the pdf brochure
Market Ecosystem:
The digital utility market ecosystem comprises system integrators such as Accenture plc (Ireland), Cognizant Technology Solutions Corporation (U.S.), and Cap Gemini S.A. (France), among others; automation and integrated solutions providers such as ABB Ltd (Switzerland), Siemens AG (Germany), and General Electric Company (U.S.), among others; cloud platform companies such as SAP SE (Germany), International Business Machines Corporation (U.S.), and Oracle Corporation (U.S.), among others.
Target Audience:
The target audience of this report includes:
- Electric utilities
- Distributed energy resource (DER) companies
- Electrical infrastructure providers
- IT vendors
- Transmission and distribution systems operators
- Systems integrators
- Government agencies
- Investors and financial community professionals
Scope of the Report:
- Generation
- Transmission and Distribution
- Retail
- Hardware
- Integrated Solutions
- Cloud and Software
- Services
- North America
- Europe
- Asia-Pacific
- Middle East
- South America
- Africa
By Network
By Technology
By Region
Available Customizations:
With the given market data, MarketsandMarkets offers customizations as per the client�s specific needs. The following customization options are available for this report:
Regional Analysis
Further breakdown of region or country-specific analysis
Company Information
Detailed analysis and profiling of additional market players (up to five)
The global digital utility market is projected to grow at a CAGR of 12.57%, from 2017 to 2022, to reach a market size of USD 244.31 Billion by 2022. An increase in the number of distributed and renewable power generation projects, energy efficiency mandates demanding carbon emission reduction, and strict regulatory requirements for electric utilities will drive the market during the forecast period.
The report segments the digital utility market, by network, into generation, transmission and distribution, and retail. The transmission and distribution subsegment dominated the network segment as it accounted for the largest part of the spending on aged infrastructure. New digital devices and communications and control systems improve the efficiency of assets and increase the ability of operators to monitor and manage electric transmission and distribution systems.
Based on technology, the digital utility market is segmented into integrated solutions and hardware. Hardware is the largest segment of the market, by technology. Hardware covers all the equipment in a digital substation, such as smart meters, smart thermostats, programmable logic controllers, and smart transformers, among others. The cost of hardware is high and, hence, the segment accounts for a larger share of the market.
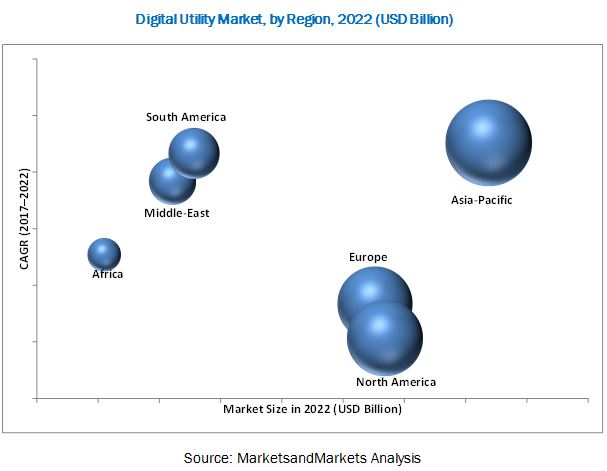
In this report, the digital utility market has been analyzed with respect to six regions, namely, North America, Europe, Asia-Pacific, South America, the Middle East, and Africa. The market in North America is expected to lead the global market during the forecast period, due to the upgradation of aging infrastructure and increase in electricity demand in the region.
Upcoming smart cities and a need to improve the productivity and efficiency of power utilities can lead to opportunities in the market. But, high initial costs could be a restraint for the market, leading to declining profits.
Some of the leading players in the digital utility market include Accenture plc (Ireland), Cap Gemini S.A. (France), General Electric Company (U.S.), Siemens AG (Germany), SAP SE (Germany), and International Business Machines Corporation (U.S.), among others. Contracts & agreements and new product launches were the most adopted strategies by players to ensure their dominance in the market.
To speak to our analyst for a discussion on the above findings, click Speak to Analyst
 Exclusive indicates content/data unique to MarketsandMarkets and not available with any competitors.
Table of Contents
1 Introduction (Page No. - 14)
1.1 Objectives of the Study
1.2 Market Definition
1.3 Market Scope
1.3.1 Markets Covered
1.3.2 Countries Covered
1.3.3 Years Considered for the Study
1.4 Currency & Pricing
1.5 Limitations
1.6 Stakeholders
2 Research Methodology (Page No. - 18)
2.1 Introduction
2.1.1 Secondary Data
2.1.1.1 Key Data From Secondary Sources
2.1.2 Primary Data
2.1.2.1 Key Data From Primary Sources
2.1.2.2 Key Industry Insights
2.1.2.3 Breakdown of Primaries
2.2 Market Size Estimation
2.3 Market Breakdown & Data Triangulation
2.4 Research Assumptions
2.4.1 Assumptions
3 Executive Summary (Page No. - 26)
4 Premium Insights (Page No. - 30)
4.1 Attractive Opportunities in the Digital Utility Market, 2017�2022
4.2 Digital Utility, By Region, 2016
4.3 Digital Utility, By Network, 2017 & 2022
4.4 Digital Utility, By Technology, 2022
5 Market Overview (Page No. - 33)
5.1 Introduction
5.2 Market Dynamics
5.2.1 Drivers
5.2.1.1 Increasing Number of Distributed and Renewable Power Generation Projects
5.2.1.2 Strict Regulatory Requirements for Electric Utilities
5.2.1.3 Need to Improve the Productivity and Efficiency of Utilities
5.2.2 Restraints
5.2.2.1 High Initial Costs
5.2.3 Opportunities
5.2.3.1 Upcoming Smart Cities
5.2.4 Challenges
5.2.4.1 Cybersecurity Threats in the Power and Utilities Sector
5.2.4.2 Challenges Associated With New Technology Implementation
6 Digital Utility Market, By Network (Page No. - 41)
6.1 Introduction
6.2 Generation
6.3 Transmission & Distribution
6.4 Retail
7 Digital Utility Market, By Technology (Page No. - 46)
7.1 Introduction
7.2 Hardware
7.3 Integrated Solutions
7.3.1 Cloud & Software
7.3.2 Services
8 Digital Utility Market, By Region (Page No. - 51)
8.1 Introduction
8.2 North America
8.2.1 By Network
8.2.2 By Technology
8.2.2.1 By Integrated Solution
8.2.3 By Country
8.2.3.1 The U.S.
8.2.3.2 Canada
8.2.3.3 Mexico
8.3 Europe
8.3.1 By Network
8.3.2 By Technology
8.3.2.1 By Integrated Solution
8.3.3 By Country
8.3.3.1 Germany
8.3.3.2 The U.K.
8.3.3.3 France
8.3.3.4 Spain
8.3.3.5 Denmark
8.3.3.6 The Rest of Europe
8.4 Asia-Pacific
8.4.1 By Network
8.4.2 By Technology
8.4.2.1 By Integrated Solution
8.4.3 By Country
8.4.3.1 China
8.4.3.2 Japan
8.4.3.3 South Korea
8.4.3.4 Australia
8.4.3.5 India
8.4.3.6 The Rest of Asia-Pacific
8.5 Middle East
8.5.1 By Network
8.5.2 By Technology
8.5.2.1 By Integrated Solution
8.5.3 By Country
8.5.3.1 Saudi Arabia
8.5.3.2 The U.A.E.
8.5.3.3 Qatar
8.5.3.4 The Rest of the Middle East
8.6 South America
8.6.1 By Network
8.6.2 By Technology
8.6.2.1 By Integrated Solution
8.6.3 By Country
8.6.3.1 Brazil
8.6.3.2 Argentina
8.6.3.3 Chile
8.6.3.4 The Rest of the South America
8.7 Africa
8.7.1 By Network
8.7.2 By Technology
8.7.2.1 By Integrated Solution
8.7.3 By Country
8.7.3.1 South Africa
8.7.3.2 The Rest of Africa
9 Competitive Landscape (Page No. - 83)
9.1 Overview
9.2 Global Market Scenario
9.3 Digital Utility Market: Competitive Leadership Mapping, 2017
9.3.1 Visionary Leaders
9.3.2 Dynamic Differentiators
9.3.3 Emerging Companies
9.3.4 Innovators
9.4 Competitive Benchmarking
9.4.1 Strength of Product Portfolio (25 Players)
9.4.2 Business Strategy Excellence (25 Players)
9.5 Competitive Situation & Trends
10 Company Profiles (Page No. - 90)
(Overview, Strength of Product Portfolio , Business Strategy Excellence , Products Offering, Recent Development�s, Business Strategy)*
10.1 Introduction
10.2 ABB Ltd.
10.3 Accenture PLC
10.4 Capgemini SA
10.5 Cisco Systems Inc.
10.6 Eaton Corporation PLC
10.7 General Electric Company
10.8 International Business Machine Corporation
10.9 Mircosoft Corporation
10.10 Oracle Corporation
10.11 SAP SE
10.12 Schneider Electric SE
10.13 Siemens AG
*Details on Overview, Strength of Product Portfolio, Business Strategy Excellence, Products Offering, Recent Development�s, Business Strategy Might Not Be Captured in Case of Unlisted Companies.
11 Appendix (Page No. - 134)
11.1 Insights of Industry Experts
11.3 Knowledge Store: Marketsandmarkets� Subscription Portal
11.4 Introducing RT: Real-Time Market Intelligence
11.5 Available Customizations
11.6 Related Reports
11.7 Author Details
List of Tables (63 Tables)
Table 1 Digital Utility Market Snapshot (Share, CAGR, and USD Billion)
Table 2 Price Structure of Distributed Energy Resource Technology
Table 3 Market, By Network, 2015�2022 (USD Billion)
Table 4 Generation: Market Size, By Region, 2015�2022 (USD Billion)
Table 5 Transmission & Distribution: Market Size, By Region, 2015�2022 (USD Billion)
Table 6 Retail: Market Size, By Region, 2015�2022 (USD Billion)
Table 7 Market Size, By Technology, 2015�2022 (USD Billion)
Table 8 Integrated Solution: Digital Utility Market Size, By Type, 2015�2022 (USD Billion)
Table 9 Hardware: Market Size, By Region, 2015�2022 (USD Billion)
Table 10 Integrated Solution: Market Size, By Region, 2015�2022 (USD Billion)
Table 11 Cloud & Software: Market Size, By Region, 2015�2022 (USD Billion)
Table 12 Services: Market Size, By Region, 2015�2022 (USD Billion)
Table 13 Market Size, By Region, 2015�2022 (USD Billion)
Table 14 North America: Digital Utility Market Size, By Network, 2015�2022 (USD Billion)
Table 15 North America: Market Size, By Technology, 2015�2022 (USD Billion)
Table 16 North America: Market Size, By Integrated Solution, 2015�2022 (USD Billion)
Table 17 North America: Market Size, By Country, 2015�2022 (USD Billion)
Table 18 U.S.: Market Size, By Technology, 2015�2022 (USD Billion)
Table 19 Canada: Market Size, By Technology, 2015�2022 (USD Billion)
Table 20 Mexico: Market Size, By Technology, 2015�2022 (USD Billion)
Table 21 Europe: Digital Utility Market Size, By Network, 2015�2022 (USD Billion)
Table 22 Europe: Market Size, By Technology, 2015�2022 (USD Billion)
Table 23 Europe: Market Size, By Integrated Solution, 2015�2022 (USD Billion)
Table 24 Europe: Market Size, By Country, 2015�2022 (USD Billion)
Table 25 Germany: Market Size, By Technology, 2015�2022 (USD Billion)
Table 26 U.K.: Digital Utility Market Size, By Technology, 2015�2022 (USD Billion)
Table 27 France: Market Size, By Technology, 2015�2022 (USD Billion)
Table 28 Spain: Market Size, By Technology, 2015�2022 (USD Billion)
Table 29 Denmark: Market Size, By Technology, 2015�2022 (USD Billion)
Table 30 The Rest of Europe: Market Size, By Technology, 2015�2022 (USD Billion)
Table 31 Asia-Pacific: Digital Utility Market Size, By Network, 2015�2022 (USD Billion)
Table 32 Asia-Pacific: Market Size, By Technology, 2015�2022 (USD Billion)
Table 33 Asia-Pacific: Market Size, By Integrated Solution, 2015�2022 (USD Billion)
Table 34 Asia-Pacific: Market Size, By Country, 2015�2022 (USD Billion)
Table 35 China: Market Size, By Technology, 2015�2022 (USD Billion)
Table 36 South Korea: Market Size, By Technology, 2015�2022 (USD Billion)
Table 37 Australia: Market Size, By Technology, 2015�2022 (USD Billion)
Table 38 India: Market Size, By Technology, 2015�2022 (USD Billion)
Table 39 The Rest of Asia-Pacific: Market Size, By Technology, 2015�2022 (USD Billion)
Table 40 Middle East: Digital Utility Market Size, By Network, 2015�2022 (USD Billion)
Table 41 Middle East: Market Size, By Technology, 2015�2022 (USD Billion)
Table 42 Middle East: Market Size, By Integrated Solution, 2015�2022 (USD Billion)
Table 43 Middle East: Market Size, By Country, 2015�2022 (USD Billion)
Table 44 Saudi Arabia: Market Size, By Technology, 2015�2022 (USD Billion)
Table 45 U.A.E.: Market Size, By Technology, 2015�2022 (USD Billion)
Table 46 Qatar: Market Size, By Technology, 2015�2022 (USD Billion)
Table 47 The Rest of the Middle East: Market Size, By Technology, 2015�2022 (USD Billion)
Table 48 South America: Digital Utility Market Size, By Network, 2015�2022 (USD Billion)
Table 49 South America: Market Size, By Technology, 2015�2022 (USD Billion)
Table 50 South America: Market Size, By Integrated Solution, 2015�2022 (USD Billion)
Table 51 South America: Market Size, By Country, 2015�2022 (USD Billion)
Table 52 Brazil: Digital Utility Market Size, By Technology, 2015�2022 (USD Billion)
Table 53 Argentina: Market Size, By Technology, 2015�2022 (USD Billion)
Table 54 Chile: Market Size, By Technology, 2015�2022 (USD Billion)
Table 55 The Rest of the South America: Market Size, By Technology, 2015�2022 (USD Billion)
Table 56 Africa: Digital Utility Market Size, By Network, 2015�2022 (USD Billion)
Table 57 Africa: Market Size, By Technology, 2015�2022 (USD Billion)
Table 58 Africa: Market Size, By Integrated Solution, 2015�2022 (USD Billion)
Table 59 Africa: Market Size, By Country, 2015�2022 (USD Billion)
Table 60 South Africa: Market Size, By Technology, 2015�2022 (USD Billion)
Table 61 The Rest of Africa: Market Size, By Technology, 2015�2022 (USD Billion)
Table 62 Digital Utility Market Ranking, 2016
Table 63 Key Players in the Market
List of Figures (35 Figures)
Figure 1 Digital Utility Market: Research Design
Figure 2 Breakdown of Primary Interviews: By Company Type, Designation, & Region
Figure 3 Market Size Estimation Methodology: Bottom-Up Approach
Figure 4 Market Size Estimation Methodology: Top-Down Approach
Figure 5 Data Triangulation Methodology
Figure 6 The North American Market Dominated the Market in 2016
Figure 7 The Transmission & Distribution Segment is Expected to Lead the Digital Utility Market During the Forecast Period
Figure 8 Integrated Solutions Associated With the Digital Utility Poised to Grow at the Fastest Rate During the Forecast Period
Figure 9 Increase in Investment in Electrical Networks is Expected to Drive the Digital Utility Market During the Forecast Period
Figure 10 The Market in Asia-Pacific is Expected to Grow at the Fastest Pace During the Forecast Period
Figure 11 The Transmission & Distribution Segment is Expected to Hold the Largest Share During the Forecast Period
Figure 12 The Hardware Segment is Expected to Lead the Global Digital Utility Market During the Forecast Period
Figure 13 The Improving Productivity & Efficiency of Utilities is Expected to Drive the Global Market During the Forecast Period
Figure 14 Renewable Energy Use, 2014 & 2030
Figure 15 Cyber Attacks in Industries
Figure 16 Digital Utility Market Segment, By Region, 2016
Figure 17 Regional Snapshot: Growth Rate of the Global Market in Various Countries, From 2017 to 2022
Figure 18 North America: Market Snapshot
Figure 19 Regional Snapshot: Asia-Pacific Offered Attractive Market Opportunities in 2016
Figure 20 Key Developments in the Global Digital Utility Market, 2013�2017
Figure 21 Market Evaluation Framework: New Product Developments, Mergers & Acquisitions, Contracts & Agreements, & Expansions Fueled the Growth of Companies From January 2013 to April 2017
Figure 22 Competitive Leadership Mapping
Figure 23 Battle for Digital Utility Market Share: Contracts & Agreements Was the Key Strategy, 2013�2017
Figure 24 ABB Ltd.: Company Snapshot
Figure 25 Accenture PLC: Company Snapshot
Figure 26 Capgemini SA: Company Snapshot
Figure 27 Cisco Systems Inc.: Company Snapshot
Figure 28 Eaton Corporation PLC: Company Snapshot
Figure 29 General Electric Company: Company Snapshot
Figure 30 International Business Machine Corporation: Company Snapshot
Figure 31 Microsoft Corporation: Company Snapshot
Figure 32 Oracle Corporation: Company Snapshot
Figure 33 SAP SE: Company Snapshot
Figure 34 Schneider Electric SE: Company Snapshot
Figure 35 Siemens AG: Company Snapshot


Growth opportunities and latent adjacency in Digital Utility Market