Feeder Automation Market by Application (Commercial, Industrial, & Residential), by Product (Hardware, Software, & Services), and Region - Global Trends & Forecasts to 2019


[210 Pages Report] Feeder automation is a constituent of distribution automation system, which principally focuses on remote monitoring and control of the distribution systems & their equipment. Distribution feeders include control devices, most common being the shunt capacitors to meet local volt-ampere reactive (VAR) requirements or support voltage regulation. In addition, it comprises components such as line reclosers, load break switches, and sectionalizers. Reactors are employed to limit the fault current in the system. Integration of such automatic devices in the feeder system is done in order to optimize the management of capital assets and enhance operation and maintenance efficiencies with minimal human intervention.
Factors driving the feeder automation market include rising electricity prices with increased consumption, renewable energy integration, and improved reliability and efficiency. Growing demand for energy, coupled with increasing investment in automation activities, is expected to drive the global feeder automation market to $3,445.0 Million by 2019, at a CAGR of 7.2% from 2014 to 2019.
The market for this system in regions such as the Americas has grown in the past decade due to its benefits, which include labor cost savings, reduction in unconsumed energy, and reduction in electrical losses. The global market is expected to witness sound growth in the near future, supported by various governments for effective installation and reconfiguration of networks for real-time optimization.
Feeder Automation Market Size, by Region (2012 - 2019)
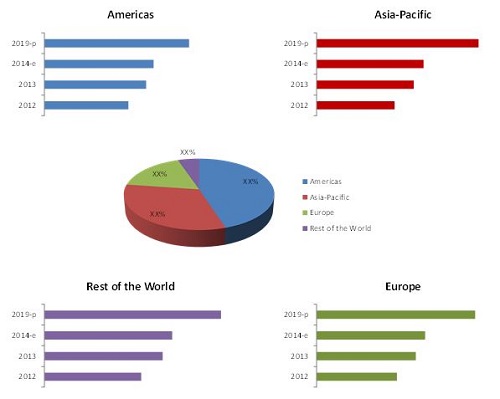
Source: MarketsandMarkets Analysis
Scope of the report: This report covers the global feeder automation market for distribution by the intensity of feeder automation activities in the power distribution system. It highlights some of the key industrial issues and market impulse factors. It also describes some important dynamics such as drivers, restraints, opportunities, and challenges.
On the basis of Application: Commercial, Industrial, and Residential
On the basis of Product: Hardware, Software, and Services
On the basis of Region: The Americas, Europe, Asia-Pacific, and Rest of the World
To provide an in-depth understanding of the competitive landscape, the report includes profiles of some of the major players, which combines manufacturers as well as service providers, such as Eaton Corporation PLC. (Ireland), Advanced Control Systems Inc. (Georgia), ABB Ltd. (Switzerland), G&W Electric (U.S.), Schneider Electric SE (France), Crompton Greaves Ltd. (India), Siemens AG (Germany), Moxa (China), and Schweitzer Engineering Laboratories (U.S.).
Market share analysis, by revenue, of the top companies has also been included in the report. The scope accordingly aids market participants to identify high growth markets and help managing key investment decisions. For this report, major players in the distribution feeder automation market have been identified through various primary and secondary sources, which include annual reports of top market players, interviews with key opinion leaders such as CEOs, directors, and marketing people. Based on this research, the market shares have been evaluated and validated.
Distribution system is implementing new technologies for automation of components or equipment used in the feeder systems. There are several intelligent devices, communication infrastructure, and integration techniques being used in feeder automation systems. The applications of feeder automation, such as automated load switching and Volt/VAR control are seeking attraction of feeder systems to be installed in distribution networks. The automated devices, which are installed in the feeder systems, help to automate the distribution system in such a way that it can detect the fault in the circuit with the help of fault indicators and can balance the load over the network while the fault is located & rectified, after which, service is restored.
Optimization is achieved at a greater level through feeder systems such that it is resulting in installation of many distribution feeders for applications in industrial network, then in commercial area, and finally in residential networks. The market under study analyzes the above mentioned application areas (commercial, industrial, and residential).
In recent years, moderate growth has been observed in the feeder automation market due to increasing concerns of continuous power supply. Key products include hardware, software, and services, which incorporate the feeder automation. Hardware products can be RTUs, protection relays, automated switches, automatic circuit reclosers, network protector monitoring and control, fault detectors, sectionalizers. Software products include SCADA system, human machine interface, and management information systems; services are inclusive of installation activities, commissioning of the entire feeder automation.
The global feeder automation market is projected to reach a value of $3.4 Billion market by 2019, at a CAGR of 7.2% from 2014 to 2019.
The figure below shows the feeder automation market share, based on regions, as of 2013.
Feeder Automation Market Share (by Value), by Region, 2013
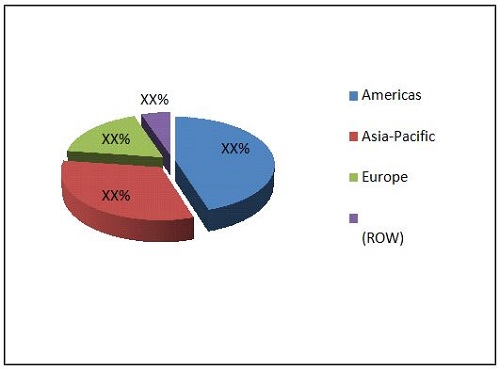
Source: MarketsandMarkets Analysis
Currently, the Americas account for the largest consumption of feeder automation as a large number of commercial and industrial activities are being carried out in the region. The Asia-Pacific market holds the second position, and its high growth is because of new potential industries approaching the Asia-Pacific region, especially in China, Japan, India, and Indonesia.
The market, based on region, has been segmented into Asia-Pacific, Europe, the Americas, and Rest of the World (RoW). The study covers different strategies such as contract agreements, equipment supply, mergers & acquisitions, and expansions. Eaton Corporation PLC (Ireland), Advanced Control Systems Inc. (Georgia), ABB Ltd. (Switzerland), G&W Electric (U.S.), Schneider Electric SE (France), Crompton Greaves Ltd. (India), Siemens AG (Germany), Moxa (China), and Schweitzer Engineering Laboratories (U.S.) are the dominant market leaders providing specialized services and solutions.
 Exclusive indicates content/data unique to MarketsandMarkets and not available with any competitors.
Table of Contents
1 Introduction
1.1 Objectives of the Study
1.2 Market Definition
1.3 Market Scope
1.3.1 Markets Covered
1.3.2 Years Considered for the Study
1.4 Currency
1.5 Limitations
1.6 Stakeholders
2 Research Methodology
2.1 Research Data
2.1.1 Secondary Data
2.1.1.1 Key Data From Secondary Sources
2.1.2 Primary Data
2.1.2.1 Key Data From Primary Sources
2.1.2.2 Key Industry Insights
2.1.2.3 Breakdown of Primary Interviews
2.2 Market Size Estimation
2.3 Market Breakdown & Data Triangulation
2.4 Research Assumptions
3 Executive Summary
4 Premium Insights
4.1 Attractive Market Opportunity for Industrial Distribution Feeder Automation System
4.2 Hardware Products Dominated the Feeder Automation Market in 2013
4.3 U.S. Accounts for One-Third of the Market Share
4.4 Americas Dominated the Feeder Automation Market in 2013
4.5 Top Five Countries in the Feeder Automation Market
4.6 Demand for Hardware Products Will Rise in the Next Five Years
5 Market Overview
5.1 Introduction
5.2 Market Segmentation
5.2.1 on the Basis of Product
5.2.2 on the Basis of Application
5.2.3 on the Basis of Region
5.3 Market Dynamics
5.3.1 Market Drivers
5.3.1.1 Rising Electricity Prices With Increased Consumption
5.3.1.2 Renewable Energy Integration
5.3.1.3 Improved Reliability & Efficiency
5.3.2 Restraint
5.3.2.1 Lag in Implementation Due to High Costs & Standards
5.3.3 Opportunities
5.3.3.1 Smart Grid Technology
5.3.3.2 Related Environmental Norms
5.3.4 Challenge
5.3.4.1 Cyber Security
6 Industry Trends
6.1 Value Chain Analysis
6.2 Porter�s Five Forces Analysis
6.2.1 Threat of Substitutes
6.2.2 Bargaining Power of Buyers
6.2.3 Bargaining Power of Suppliers
6.2.4 Threat of New Entrants
6.2.5 Intensity of Rivalry
6.3 Supply Chain Analysis
7 Feeder Automation Market, By Product
7.1 Introduction
8 Feeder Automation Market, By Application
8.1 Introduction
8.2 By Application , 2012-2019 ($Million)
8.3 By Top Five Countries
8.4 By Product
9 Feeder Automation Market, By Region
9.1 Introduction
9.1.1 By Region
9.2 Americas
9.2.1 By Product
9.2.2 By Country
9.2.2.1 Canada
9.2.2.2 Mexico
9.2.2.3 Brazil
9.2.2.4 Rest of Americas
9.2.3 By Application
9.2.3.1 U.S.
9.2.3.2 Canada
9.2.3.3 Mexico
9.2.3.4 Brazil
9.2.3.5 Rest of Americas
9.3 Europe
9.3.1 By Product
9.3.2 By Country
9.3.2.1 U.K.
9.3.2.2 France
9.3.2.3 Germany
9.3.2.4 Rest of Europe
9.3.3 By Application
9.3.3.1 U.K.
9.3.3.2 France
9.3.3.3 Germany
9.3.3.4 Rest of Europe
9.4 Asia-Pacific
9.4.1 By Product
9.4.2 By Country
9.4.2.1 China
9.4.2.2 Japan
9.4.2.3 India
9.4.2.4 Indonesia
9.4.2.5 Rest of Asia-Pacific
9.4.3 By Application
9.4.3.1 China
9.4.3.2 Japan
9.4.3.3 India
9.4.3.4 Indonesia
9.4.3.5 Rest of Asia-Pacific
9.5 Rest of the World
9.5.1 By Product
9.5.2 By Country
9.5.3 By Application
10 Competitive Landscape
10.1 Overview
10.2 Competitive Situation & Trends
10.3 Market Share Analysis, Feeder Automation Market (By Key Players)
10.4 Contracts & Agreements
10.5 Expansions
10.6 Mergers, Acquisitions, & Joint Ventures
10.7 New Product/Technology Launch
10.8 Other Developments
11 Company Profiles
11.1 Introduction
11.2 ABB Ltd.
11.2.1 Business Overview
11.2.2 Product Portfolio
11.2.3 Strategy & Insights
11.2.4 SWOT Analysis
11.2.5 MNM View
11.2.6 Recent Developments, 2011-2014
11.3 Crompton Greaves Ltd.
11.3.1 Business Overview
11.3.2 Product Portfolio
11.3.3 Strategy & Insights
11.3.4 SWOT Analysis
11.3.5 MNM View
11.3.6 Recent Developments, 2010-2014
11.4 General Electric Company (GE)
11.4.1 Introduction
11.4.2 Product Portfolio
11.4.3 Key Strategies
11.4.4 SWOT Analysis
11.4.5 MNM View
11.4.6 Recent Developments, 2009-2013
11.5 Schneider Electric SE
11.5.1 Business Overview
11.5.2 Product Portfolio
11.5.3 Strategy & Insights
11.5.4 SWOT Analysis
11.5.5 MNM View
11.5.6 Recent Developments, 2011-2015
11.6 Siemens AG
11.6.1 Business Overview
11.6.2 Products & Services
11.6.3 SWOT Analysis
11.6.4 MNM View
11.6.5 Recent Developments, 2014-2012
11.7 Beckwith Electric Co. Inc.
11.7.1 Business Overview
11.7.2 Product Portfolio
11.7.3 Key Strategies
11.7.4 Recent Developments, 2010-2013
11.8 Schweitzer Engineering Laboratories (SEL)
11.8.1 Business Overview
11.8.2 Product Portfolio
11.8.3 Key Strategies
11.8.4 Recent Developments, 2012-2014
11.9 G&W Electric
11.9.1 Business Overview
11.9.2 Product Portfolio
11.9.3 Key Strategies
11.9.4 Recent Developments, 2010-2014
11.10 S&C Electric Company
11.10.1 Business Overview
11.10.2 Product Portfolio
11.10.3 Key Strategies
11.10.4 Recent Developments, 2013-2014
11.11 MOXA
11.11.1 Business Overview
11.11.2 Product Portfolio
11.11.3 Key Strategies
11.11.4 Recent Developments, 2009-2014
11.12 Advanced Control Systems Inc.
11.12.1 Business Overview
11.12.2 Product Portfolio
11.12.3 Strategy & Insights
11.12.4 Recent Developments, 2012-2014
11.13 Eaton Corporation PLC.
11.13.1 Business Overview
11.13.2 Product Portfolio
11.13.3 Strategy & Insights
11.13.4 Recent Developments, 2010-2014
11.14 Tatung Co.
11.14.1 Business Overview
11.14.2 Product Portfolio
11.14.3 Strategy & Insights
11.14.4 Recent Developments, 2011-2014
11.15 Viola Systems Ltd.
11.15.1 Business Overview
11.15.2 Product Portfolio
11.15.3 Strategy & Insights
11.15.4 Recent Developments, 2011-2013
12 Appendix
12.1 Insights of Industry Experts
12.2 Other Developments
12.3 Discussion Guide
12.4 Introducing RT: Real Time Market Intelligence
12.5 Available Customizations
12.6 Related Reports
List of Tables (71 Tables)
Table 1 Improved Reliability & Rising Electricity Prices With Increased Consumption Are Propelling the Growth of Distribution Feeder Automation System
Table 2 Lag in Implementation Due to High Costs & Standards Restrain the Market Growth
Table 3 Smart-Grid Technology & Related Environmental Norms Are Propelling the Growth of the Feeder Automation Market
Table 4 Cyber Security is A Major Challenge for Industry Players
Table 5 Feeder Automation Market Size, By Product, 2012-2019 ($Million)
Table 6 Hardware Feeder Automation Market Size, By Region, 2012-2019 ($Million)
Table 7 Software Feeder Automation Market Size, By Region, 2012-2019 ($Million)
Table 8 Services Feeder Automation Market Size, By Region, 2012-2019 ($Million)
Table 9 Hardware Feeder Automation Market Size, By Top Five Country, 2012-2019 ($Million)
Table 10 Software Feeder Automation Market Size, By Top Five Country, 2012-2019 ($Million)
Table 11 Services Feeder Automation Market Size, By Top Five Country, 2012-2019 ($Million)
Table 12 Hardware Feeder Automation Market Size, By Application , 2012-2019 ($Million)
Table 13 Software Feeder Automation Market Size, By Application , 2012-2019 ($Million)
Table 14 Services Feeder Automation Market Size, By Application , 2012-2019 ($Million)
Table 15 Feeder Automation Market Size, By Application, 2012-2019 ($Million)
Table 16 Commercial Feeder Automation Market Size, By Region, 2012-2019 ($Million)
Table 17 Industrial Feeder Automation Market Size, By Region, 2012-2019 ($Million)
Table 18 Residential Feeder Automation Market Size, By Region, 2012-2019 ($Million)
Table 19 Feeder Automation Market Size: By Top Five Country, 2012-2019 ($Million)
Table 20 Commercial Feeder Automation Market Size, By Top Five Country, 2012-2019 ($Million)
Table 21 Industrial Feeder Automation Market Size, By Top Five Country, 2012-2019 ($Million)
Table 22 Residential Feeder Automation Market Size, By Top Five Country, 2012-2019 ($Million)
Table 23 Commercial Feeder Automation Market Size, By Product, 2012-2019 ($Million)
Table 24 Industrial Feeder Automation Market Size, By Product, 2012-2019 ($Million)
Table 25 Residential Feeder Automation Market Size, By Product, 2012-2019 ($Million)
Table 26 Feeder Automation Market Size, By Region, 2012-2019 ($Million)
Table 27 Americas: Feeder Automation Market Size, By Product, 2012-2019 ($Million)
Table 28 Americas: Feeder Automation Market Size, By Country, 2012-2019 ($Million)
Table 29 U.S.: Feeder Automation Market Size, By Product, 2012-2019 ($Million)
Table 30 Canada: Feeder Automation Market Size, By Product, 2012-2019 ($Million)
Table 31 Mexico: Feeder Automation Market Size, By Product, 2012-2019 ($Million)
Table 32 Brazil: Feeder Automation Market Size, By Product, 2012-2019 ($Million)
Table 33 Rest of Americas: Feeder Automation Market Size, By Product, 2012-2019 ($Million)
Table 34 Americas: Feeder Automation Market Size, By Application, 2012-2019 ($Million)
Table 35 U.S.: Feeder Automation Market Size, By Application, 2012-2019 ($Million)
Table 36 Canada: Feeder Automation Market Size, By Application, 2012-2019 ($Million)
Table 37 Mexico: Feeder Automation Market Size, By Product, 2012-2019 ($Million)
Table 38 Brazil: Feeder Automation Market Size, By Application, 2012-2019 ($Million)
Table 39 Rest of Americas: Feeder Automation Market Size, By Application, 2012-2019 ($Million)
Table 40 Europe: Feeder Automation Market Size, By Product, 2012-2019 ($Million)
Table 41 Europe: Market Size, By Country, 2012-2019 ($Million)
Table 42 U.K.: Feeder Automation Market Size, By Product, 2012-2019 ($Million)
Table 43 France: Feeder Automation Market Size, By Product, 2012-2019 ($Million)
Table 44 Germany: Feeder Automation Market Size, By Product, 2012-2019 ($Million)
Table 45 Rest of Europe: Feeder Automation Market Size, By Product, 2012-2019 ($Million)
Table 46 Europe: Feeder Automation Market Size, By Application, 2012-2019 ($Million)
Table 47 U.K.: Feeder Automation Market Size, By Application, 2012-2019 ($Million)
Table 48 France: Feeder Automation Market Size, By Application, 2012-2019 ($Million)
Table 49 Germany: Feeder Automation Market Size, By Application, 2012-2019 ($Million)
Table 50 Rest of Europe: Feeder Automation Market Size, By Application, 2012-2019 ($Million)
Table 51 Asia-Pacific: Feeder Automation Market Size, By Product, 2012-2019 ($Million)
Table 52 Asia-Pacific: Feeder Automation Market Size, By Country, 2012-2019 ($Million)
Table 53 China: Feeder Automation Market Size, By Product, 2012-2019 ($Million)
Table 54 Japan: Feeder Automation Market Size, By Product, 2012-2019 ($Million)
Table 55 India: Feeder Automation Market Size, By Product, 2012-2019 ($Million)
Table 56 Indonesia: Feeder Automation Market Size, By Product, 2012-2019 ($Million)
Table 57 Rest of Asia-Pacific: Feeder Automation Market Size, By Product, 2012-2019 ($Million)
Table 58 Asia-Pacific: Feeder Automation Market Size, By Application, 2012-2019 ($Million)
Table 59 China: Feeder Automation Market Size, By Application, 2012-2019 ($Million)
Table 60 Japan: Feeder Automation Market Size, By Application, 2012-2019 ($Million)
Table 61 India: Feeder Automation Market Size, By Application, 2012-2019 ($Million)
Table 62 Indonesia: Feeder Automation Market Size, By Application, 2012-2019 ($Million)
Table 63 Rest of Asia-Pacific: Feeder Automation Market Size, By Application, 2012-2019 ($Million)
Table 64 RoW: Feeder Automation Market Size, By Product, 2012-2019 ($Million)
Table 65 Rest of the World: Feeder Automation Market Size, By Country, 2012-2019 ($Million)
Table 66 Rest of the World: Feeder Automation Market Size, By Application, 2012-2019 ($Million)
Table 67 Contracts & Agreements, 2011-2014
Table 68 Expansions, 2011-2014
Table 69 Mergers, Acquisitions, & Joint Ventures, 2011-2014
Table 70 New Product/Technology Launches, 2011-2014
Table 71 Other Developments, 2011-2014
List of Figures (50 Figures)
Figure 1 Markets Covered: Feeder Automation Market
Figure 2 Feeder Automation Market: Research Design
Figure 3 Breakdown of Primary Interviews: By Company, Designation, & Region
Figure 4 Market Size Estimation Methodology: Top-Down Approach
Figure 5 Market Size Estimation Methodology: Bottom-Up Approach
Figure 6 Market Estimation Approach & Data Triangulation Methodology
Figure 7 the Americas Dominated the Feeder Automation Market in 2013
Figure 8 Industrial Market is Expected to Grow at the Highest CAGR During the Forecast Period
Figure 9 Industrial Market to Grow at the Fastest Rate Among the Top Three Applications of Distribution Feeder Automation Systems
Figure 10 More Than Half of the Distribution Feeder Automation Systems Market Was Dominated By Hardware Products in 2013
Figure 11 U.S. Held the Major Market Share in 2013
Figure 12 Americas Dominated All Applications in the Distribution Feeder Automation Systems Market in 2013
Figure 13 U.S., China, & Canada Are Expected to Acquire More Than 45% of the Total Market in the Next Five Years
Figure 14 The Hardware Product Market in Americas is Expected to Grow at the Highest CAGR During the Forecast Period
Figure 15 Market Segmentation for Distribution Feeder Automation Systems
Figure 16 Market Segmentation Based on Product
Figure 17 Market Segmentation Based on Application
Figure 18 Market Segmentation Based on Region
Figure 19 Market Dynamics: Distribution Feeder Automation System
Figure 20 Value Chain Analysis: Major Value is Added in Providing Service for Distribution Feeder Automation System
Figure 21 Porter�s Five Forces Analysis � Feeder Automation Market
Figure 22 Supply Chain Analysis: Feeder Automation Market
Figure 23 China is Expected to Have A High Growth Rate During the Forecast Period
Figure 24 Hardware is the Fastest Growing Product of Distribution Feeder Automation Systems in Asia-Pacific
Figure 25 Indonesia is Expected to Be the Fastest Growing Nation for Distribution Feeder Automation Systems in Asia-Pacific
Figure 26 Industrial Sector is the Leading Application in Asia-Pacific
Figure 27 Companies Adopted the Strategy of New Product/Technology Launches to Grab the Maximum Market Share
Figure 28 Battle for Market Share: New Product/Technology Launch is the Key Strategy Adopted By Major Players
Figure 29 Market Evolution Framework : Significant New Product/Technology Launch Have Fuelled Growth & Innovation From 2011 to 2014
Figure 30 General Electric Company Leads the Market Share (By Value)
Figure 31 Geographic Revenue Mix of Top 5 Players
Figure 32 ABB Ltd.: Company Snapshot
Figure 33 ABB Ltd.: SWOT Analysis
Figure 34 Crompton Greaves Ltd.: Company Snapshot
Figure 35 Crompton Greaves Ltd.: SWOT Analysis
Figure 36 General Electric Company: Company Snapshot
Figure 37 General Electric Company: SWOT Analysis
Figure 38 Schneider Electric SE: Company Snapshot
Figure 39 Schneider Electric SE: SWOT Analysis
Figure 40 Siemens AG: Company Snapshot
Figure 41 Siemens: SWOT Analysis
Figure 42 Beckwith Electric Co. Inc.: Company Snapshot
Figure 43 Schweitzer Engineering Laboratories: Company Snapshot
Figure 44 G&W Electric: Company Snapshot
Figure 45 S&C Electric Company: Company Snapshot
Figure 46 MOXA: Company Snapshot
Figure 47 Advanced Control Systems Inc.: Company Snapshot
Figure 48 Eaton Corporation PLC.: Company Snapshot
Figure 49 Tatung Co.: Company Snapshot
Figure 50 Viola Systems Ltd.: Company Snapshot


Growth opportunities and latent adjacency in Feeder Automation Market