Electroactive Polymer Market by Type (Conductive Plastic, Inherently Conductive Polymer, Inherently Dissipative Polymer), Application (ESD Protection, EMI Shielding, Actuators, Capacitors, Batteries, Sensors), and Region - Global Forecast to 2022


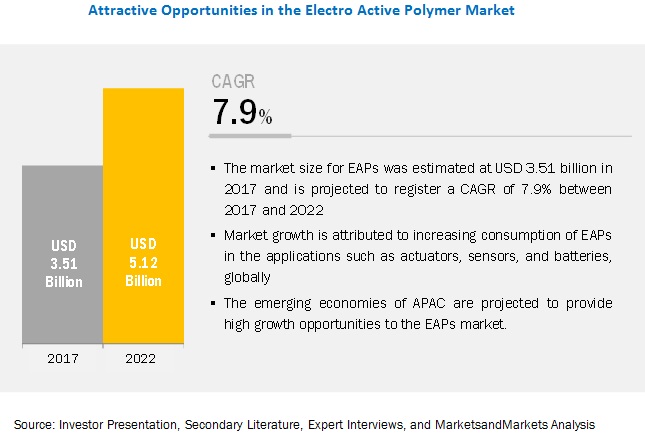
[134 Pages Report] The electroactive polymers market is estimated at USD 3.51 billion in 2017 and is projected to reach USD 5.12 billion by 2022, at a CAGR of 7.9% from 2017 to 2022. EAPs find applications in various end-use industries because of their unique properties. Contrary to conventional materials (metals), EAP products are lighter in weight, durable, and have better conductive properties. These factors are expected to drive the growth of the electroactive polymers market during the forecast period.
The inherently conductive polymers segment is projected to account for the largest share during the forecast period.
The electroactive polymers market has been classified on the basis of product type into conductive plastics, inherently conductive polymers, and inherently dissipative polymers. Among types, the inherently conductive polymers market is projected to grow at the highest CAGR during the forecast period. Inherently conductive polymers include materials, such as polythiophenes, polyanilines, polypyrroles, and polyacetylenes. ICPs are soluble, low-cost organic polymers which have electrical properties like other conductive metals and semiconductors. ICPs are a kind of ionic electroactive polymers which alter shape by motion or diffusion of ions and their conjugated substance. The high demand globally can be attributed to the extensive R&D activities being undertaken in key countries, such as the US, Canada, and Mexico on various potential applications of inherently conductive polymers. The demand for inherently conductive polymers in robotics, artificial muscles, actuators & sensors in the medical, energy harvesting, and electrical & electronics industries is the highest and is expected to drive the EAPs market during the forecast period.
The actuator application segment is expected to witness the highest CAGR during the forecast period.
On the basis of application, the electroactive polymers market has been classified into Electrostatic Discharge (ESD) protection, Electromagnetic Interference (EMI), shielding, actuators, capacitors, batteries, sensors, and others. The actuator application is projected to lead the electroactive polymers market during the forecast period. The growth of this segment can be attributed to the increasing use of electroactive polymers in actuator applications owing to their operational efficiency over conventional materials. The actuator application is projected to grow at the highest CAGR between 2017 and 2022.
APAC is expected to account for the largest market share during the forecast period.
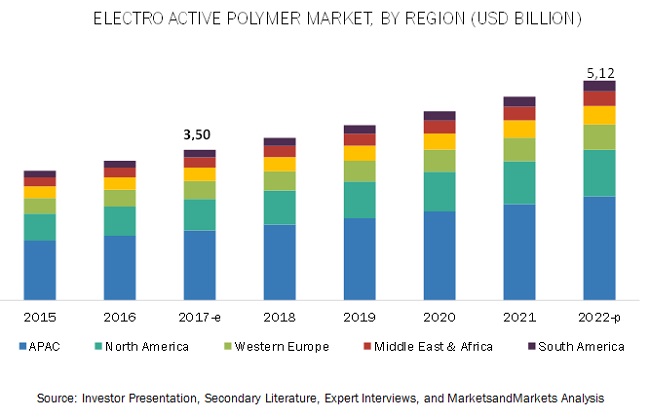
The Asia Pacific region is the largest market for electroactive polymers across the globe, and is projected to grow at the highest CAGR between 2017 and 2022. The growth of the Asia Pacific region can be attributed to the presence of various key manufacturers of electroactive polymers and increasing demand for electronic applications from countries, such as China, South Korea, Japan, and India. Moreover, the easy availability of raw materials in the Asia Pacific region has attracted several global companies and investors to set up their production facilities in the region, thereby fueling the growth of the Asia Pacific electroactive polymers market.
Market Dynamics
Driver: Growing smart fabric market
Electromechanical systems such as sensors, actuators, electronics, and power sources can be directly woven into textiles called sensing and actuating microfibers. The flexibility and low cost of EAPs allow them to be used as smart fabrics. Polypyrrole and polyanilines are used in developing smart fabrics. The demand for EAPs in smart fabrics is expected to increase in the near future owing to increased R&D and rapid growth in countries such as the US, Japan, and China. The US is the largest market for smart fabrics. Europe and APAC are also expected to show rapid growth during the forecast period.
Smart fabrics act as multifunctional interactive fabrics, and they have huge scope in disciplines including health monitoring, rehabilitation, ergonomics, sports, and telemedicine. This rapid development in the smart fabrics market plays an important role in driving the demand for EAPs.
Restraint: Environmental impact
Raw materials used for manufacturing of EAPs are difficult to extract and often environmentally hazardous. One of the major concerns is the disposal of waste generated by EAPs. Improper disposal of EAP products may be detrimental to the environment and would ultimately affect the food chain. EAP manufacturers might witness increased cost related to the disposal of some EAPs, which cannot be disposed through biodegradation. Therefore, the government has enforced stringent regulations on the use of such polymers. The environmental regulations on the use of petroleum products restrict the growth of the EAPs market
Opportunity: Increasing biomimetic application
Biomimetics is the most significant application of EAPs. In biomimetics, polymers are fabricated to resemble muscles. Although this technology is still in the development phase, various machines have been developed to imitate birds, fish, insects, and even plants. An EAP actuated fish called floajet, which is commercially available in Japan, was developed by Eamex Corporation (Japan). Currently, R&D on developing artificial intelligence, artificial vision, and artificial muscle is in progress. EAPs with characteristics such as flexibility, resilience, large actuation, and damage tolerance, which are similar to biological muscles, have high growth potential in these future applications. EAP technology based on electric field induced deformation of polymer dielectrics has promising opportunities, as it has high strains and energy densities. This technology has aided in developing human-like robots. Materials such as polypyrroles provide huge opportunities in this field. These materials have favorable biocompatibility properties and can be operated in body fluids, including blood. One of the major challenges in the development of biomimetics is the lack of commercial actuator technology that can mimic natural muscles. Some of the major properties required for biomimetic performance of EAPs are strain, actuation pressure, density, efficiency, and speed. No material has yet been able to match the overall performance of natural muscles. Hence, biomimetics provide huge growth opportunities for the EAPs market in the future.
Challenge: Lack of extensive commoditization of EAPs
EAPs have been witnessing rapid R&D to realize their full benefits for high voltage and high strength applications. The high voltage applications involve risk of polymer breakdown resulting in loss of operability. This has led to increased demand for EAPs with high heat resistance and improved physical and mechanical properties, which requires capital-intensive R&D. In addition, research on EAP materials with long-term operations is also under process. Leading manufacturers of EAPs are yet to tap the potential applications of EAPs in biomimetics, better actuation mechanisms, and mass production techniques. Refining of processes such as synthesizing, fabrication, electroding, and shaping needs to be improved to provide better actuation capability and durability in EAPs for applications such as artificial muscle and biomimetics. High level of R&D is also required for improved actuation force, energy conversion efficiency, long-term usage, and improved reliability of EAPs. Only a few players are involved in the R&D of EAPs for the biomimetic application. These factors pose a challenge to the growth of the EAPs market, which is yet to be highly commoditized.
Scope of the Report
|
Report Metric |
Details |
|
Years considered for the study |
2015-2022 |
|
Base year considered |
2016 |
|
Forecast period |
2017-2022 |
|
Units considered |
Value (USD Million) and Volume (Kiloton) |
|
Segments covered |
Type, Application, and Region |
|
Regions covered |
APAC, Europe, North America, Middle East & Africa, and South America |
|
Companies profiled |
Solvay (Belgium), Parker Hannifin (US) Agfa-Gevaert (Belgium), 3M (US), Merck (Germany), Lubrizol (US), Novasentis (US), Premix (Finland), and PolyOne Corporation (US), among others |
This research report categorizes the electro active polymer market based on type, end-use industry, and region.
Electro Active Polymer Market, by Type:
- Conductive Plastics
- Inherently Conductive Polymers
- Inherently Dissipative Polymers
Electro Active Polymer Market, by Application:
- Electrostatic Discharge Protection
- Electromagnetic Interference Shielding
- Actuators
- Capacitors
- Batteries
- Sensors
- Others (textile and fabrics, OLEDs, solar cells, and organic/plastic transistors)
Electro Active Polymer Market, by Region:
- APAC
- Western Europe
- North & Central Europe
- North America
- Middle East & Africa
- South America
Key Market Players
Some of the key players operating in the electro active polymer market are Solvay (Belgium), Parker Hannifin (US) Agfa-Gevaert (Belgium), 3M (US), Merck (Germany), Lubrizol (US), Novasentis (US), Premix (Finland), and PolyOne Corporation (US). Competition among these players is high, and they mostly compete with each other on prices and quality of their products and product customization. The growth of the end-use segments of the electro active polymer market is likely to encourage the manufactures to provide better products and technologies to their customers and explore the untapped markets.
Recent Developments
- In March 2017, Parker Hannifin, through its chomerics division, launched PREMIER PBT-225, a conductive plastic that offers superior performance and hydrolysis resistance
- In June 2016, Parker Hannifin launched SensoNODE High-Strain Sensor highlighting EAP technology. SensoNODE High-Strain is prepared with a stretchable polymer, which can take precise interpretations and readings for a long period of service life
- In January 2015, Solvay completed the acquisition of Ryton Polyphenylene Sulfide (PPS) business from Chevron Phillips Chemical Limited (US). Solvay has bought two Ryton PPS resin manufacturing units in Borger, Texas. The acquisition will help the company in expanding its footprint in new region and tap the untapped market.
Key questions addressed by the report
- Which are the revenue pockets in the electro active polymer market?
- What are the prime strategies of leaders in the electro active polymer market?
- What is the future product mix of electro active polymer market?
- Which key developments are expected to have a high impact on the electro active polymer market?
- Which product/technologies are expected to cannibalize existing technologies?
To speak to our analyst for a discussion on the above findings, click Speak to Analyst
 Exclusive indicates content/data unique to MarketsandMarkets and not available with any competitors.
Table of Contents
1 Introduction (Page No. - 13)
1.1 Objectives of the Study
1.2 Market Definition
1.3 Scope of the Study
1.3.1 Years Considered for the Study
1.4 Currency
1.5 Unit Considered
1.6 Limitations
1.7 Stakeholders
2 Research Methodology (Page No. - 17)
2.1 Research Data
2.1.1 Secondary Data
2.1.1.1 Key Data From Secondary Sources
2.1.2 Primary Data
2.1.2.1 Key Data From Primary Sources
2.1.2.2 Key Industry Insights
2.1.2.3 Breakdown of Primary Interviews
2.2 Market Size Estimation
2.2.1 Top-Down Approach
2.2.2 Bottom-Up Approach
2.3 Data Triangulation
2.4 Assumptions
3 Executive Summary (Page No. - 25)
4 Premium Insights (Page No. - 28)
4.1 Attractive Opportunities in the Market
4.2 Electroactive Polymers Market, By Type
4.3 Electroactive Polymers Market in APAC, By Application and Country
4.4Electroactive Polymers Market Attractiveness
5 Market Overview (Page No. - 30)
5.1 Introduction
5.2 Market Dynamics
5.2.1 Drivers
5.2.1.1 Low Cost of Materials, Ease of Synthesis, Lightweight, and Flexibility
5.2.1.2 Growing Smart Fabrics Market
5.2.1.3 Growing Demand From Smart Electronics Market
5.2.2 Restraints
5.2.2.1 Environmental Impact
5.2.3 Opportunities
5.2.3.1 Increasing Biomimetic Applications
5.2.3.2 Better Surface Conductivity
5.2.4 Challenges
5.2.4.1 Lack of Extensive Commoditization of EAPS
5.2.4.2 Volatile Pricing
5.3 Porter�s Five Forces Analysis
5.3.1 Bargaining Power of Suppliers
5.3.2 Threat of New Entrants
5.3.3 Threat of Substitutes
5.3.4 Bargaining Power of Buyers
5.3.5 Intensity of Competitive Rivalry
5.4 Macroeconomic Indicators
6 Electroactive Polymers Market, By Type (Page No. - 38)
6.1 Introduction
6.2 Conductive Plastics
6.2.1 ESD/EMI Compounds
6.2.2 Antistatic Additives
6.2.3 Carbon/Metal Fibers
6.2.4 Carbon Nanotubes
6.2.5 Others (Blends of Conductive Plastics and Powder Coatings)
6.3 Inherently Conductive Polymers
6.3.1 Polythiophenes
6.3.2 Polyanilines
6.3.3 Polyacetylenes
6.3.4 Polyphenylene Vinylenes
6.3.5 Polyfluorenes
6.3.6 Polyphenylene Sulfide
6.3.7 Polynaphthalenes
6.3.8 Other ICPS
6.3.8.1 Polypyrroles
6.3.8.2 Poly (3,4-Ethylenedioxythiophene)
6.4 Inherently Dissipative Polymers
6.5 Others
6.5.1 Dielectric Elastomers
6.5.2 Ferroelectrets
7 Electroactive Polymers Market, By Application (Page No. - 47)
7.1 Introduction
7.2 Electrostatic Discharge Protection
7.3 Electromagnetic Interference Shielding
7.4 Actuators
7.5 Capacitors
7.6 Batteries
7.6.1 Lithium Battery
7.6.2 All-Polymer Battery
7.6.3 Button Battery
7.6.4 Automotive Battery
7.6.5 Portable Computer Battery
7.7 Sensors
7.7.1 Gas Sensors
7.7.2 Odor Sensors
7.7.3 Chemical Sensors
7.7.4 Biosensors
7.7.5 Smart Fabric Sensors
7.8 Antistatic Packaging
7.9 Organic Light Emitting Diodes (OLED)
7.10 Others
8 Electroactive Polymers Market, By Region (Page No. - 54)
8.1 Introduction
8.2 APAC
8.2.1 China
8.2.2 Japan
8.2.3 South Korea
8.2.4 India
8.2.5 Taiwan
8.2.6 Malaysia
8.2.7 Rest of APAC
8.3 North America
8.3.1 US
8.3.2 Mexico
8.3.3 Canada
8.4 Western Europe
8.4.1 Germany
8.4.2 France
8.4.3 UK
8.4.4 Italy
8.4.5 Spain
8.4.6 Rest of Western Europe
8.5 Central & Eastern Europe
8.5.1 Hungary
8.5.2 Czech Republic
8.5.3 Poland
8.5.4 Rest of Central & Eastern Central & Eastern Europe
8.6 Middle East & Africa
8.6.1 Saudi Arabia
8.6.2 UAE
8.6.3 Rest of Middle East & Africa
8.7 South America
8.7.1 Brazil
8.7.2 Argentina
8.7.3 Rest of South America
9 Competitive Landscape (Page No. - 96)
9.1 Introduction
9.2 Competitive Scenario
9.3 New Product Development
9.4 Agreement & Joint Venture
9.5 Merger & Acquisition
9.6 Market Ranking of Major Players
10 Company Profiles (Page No. - 101)
(Business Overview, Products Offered, Recent Developments, SWOT Analysis, MnM View)*
10.1 Solvay
10.2 Parker Hannifin
10.3 AGFA-Gevaert
10.4 3M
10.5 Merck
10.6 Lubrizol
10.7 Novasentis
10.8 Polyone
10.9 Premix
10.10 Heraeus
*Details on Business Overview, Products Offered, Recent Developments, SWOT Analysis, MnM View Might Not Be Captured in Case of Unlisted Companies.
10.11 Additional Company Profiles
10.11.1 Eamex
10.11.2 Eeonyx
10.11.3 Cambridge Display Technologies
10.11.4 Kenner Material & System
10.11.5 Hyperion Catalysis International
10.11.6 American Dye Source
10.11.7 RT p Company
10.11.8 Rieke Metals.
10.11.9 Danfoss
10.11.10 Artificial Muscle
10.11.11 Cedrat Technologies
10.11.12 Leap Technology
10.11.13 Nanosonic
10.11.14 Stretchsense
10.11.15 Ras Labs
11 Appendix (Page No. - 124)
11.1 Insights From Industry Experts
11.2 Discussion Guide
11.3 Knowledge Store: Marketsandmarkets� Subscription Portal
11.4 Introducing RT: Real-Time Market Intelligence
11.5 Available Customizations
11.6 Related Reports
11.7 Author Details
List of Tables (78 Tables)
Table 1 Trends and Forecast of Per Capita GDP (USD)
Table 2 Electroactive Polymers Market Size, By Type, 2015�2022 (USD Million)
Table 3 Market Size, By Type, 2015�2022 (Kiloton)
Table 4 Conductive Plastics Market Size, By Region, 2015�2022 (USD Million)
Table 5 Conductive Plastics Market Size, By Region, 2015�2022 (Kiloton)
Table 6 Inherently Conductive Polymers Market Size, By Region, 2015�2022 (USD Million)
Table 7 Inherently Conductive Polymers Market Size, By Region, 2015�2022 (Kiloton)
Table 8 Inherently Dissipative Polymers Market Size, By Region, 2015�2022 (USD Million)
Table 9 Inherently Dissipative Polymers Market Size, By Region, 2015�2022 (Kiloton)
Table 10 Electroactive Polymers Market Size, By Application, 2015�2022 (USD Million)
Table 11 Market Size in ESD Protection, By Region, 2015�2022 (USD Million)
Table 12 Market Size in EMI Shielding, By Region, 2015�2022 (USD Million)
Table 13 Market Size in Actuators, By Region, 2015�2022 (USD Million)
Table 14 Market Size in Capacitors, By Region, 2015�2022 (USD Million)
Table 15 Market Size in Batteries, By Region, 2015�2022 (USD Million)
Table 16 Market Size in Sensors, By Region, 2015�2022 (USD Million)
Table 17 Market Size in Other Applications, By Region, 2015�2022 (USD Million)
Table 18 Electroactive Polymers Market Size, By Region, 2015�2022 (USD Million)
Table 19 Market Size, By Region, 2015�2022 (Kiloton)
Table 20 APAC: Market Size, By Country, 2015�2022 (USD Million)
Table 21 APAC: Market Size, By Country, 2015�2022 (Kiloton)
Table 22 APAC: Market Size, By Type, 2015�2022 (USD Million)
Table 23 APAC: Market Size, By Type, 2015�2022 (Kiloton)
Table 24 APAC: Market Size, By Application, 2015�2022 (USD Million)
Table 25 China: Electroactive Polymers Market Size, By Application, 2015�2022 (USD Million)
Table 26 Japan: Market Size, By Application, 2015�2022 (USD Million)
Table 27 South Korea: Market Size, By Application, 2015�2022 (USD Million)
Table 28 India: Electroactive Polymers Market Size, By Application, 2015�2022 (USD Million)
Table 29 Taiwan: Market Size, By Application, 2015�2022 (USD Million)
Table 30 Malaysia: Market Size, By Application, 2015�2022 (USD Million)
Table 31 Rest of APAC: Electroactive Polymers Market Size, By Application, 2015�2022 (USD Million)
Table 32 North America: Market Size, By Country, 2015�2022 (USD Million)
Table 33 North America: Market Size, By Country, 2015�2022 (Kiloton)
Table 34 North America: Market Size, By Type, 2015�2022 (USD Million)
Table 35 North America: Market Size, By Type, 2015�2022 (Kiloton)
Table 36 North America: Market Size, By Application, 2015�2022 (USD Million)
Table 37 US: Market Size, By Application, 2015�2022 (USD Million)
Table 38 Mexico: Market Size, By Application, 2015�2022 (USD Million)
Table 39 Canada: Electroactive Polymers Market Size, By Application, 2015�2022 (USD Million)
Table 40 Western Europe: Market Size, By Type, 2015�2022 (USD Million)
Table 41 Western Europe: Market Size, By Type, 2015�2022 (Kiloton)
Table 42 Western Europe: Market Size, By Type, 2015�2022 (USD Million)
Table 43 Western Europe: Market Size, By Type, 2015�2022 (Kiloton)
Table 44 Western Europe: Market Size, By Application, 2015�2022 (USD Million)
Table 45 Germany: Market Size, By Application, 2015�2022 (USD Million)
Table 46 France: Market Size, By Application, 2015�2022 (USD Million)
Table 47 UK: Market Size, By Application, 2015�2022 (USD Million)
Table 48 Italy: Market Size, By Application, 2015�2022 (USD Million)
Table 49 Spain: Electroactive Polymers Market Size, By Application, 2015�2022 (USD Million)
Table 50 Rest of Western Europe: Market Size, By Application, 2015�2022 (USD Million)
Table 51 Central & Eastern Europe: Market Size, By Country, 2015�2022 (USD Million)
Table 52 Central & Eastern Europe: Market Size, By Country, 2015�2022 (Kiloton)
Table 53 Central & Eastern Europe: Market Size, By Type, 2015�2022 (USD Million)
Table 54 Central & Eastern Europe: Market Size, By Type, 2015�2022 (Kiloton)
Table 55 Central & Eastern Europe: Market Size, By Application, 2015�2022 (USD Million)
Table 56 Hungary: Market Size, By Application, 2015�2022 (USD Million)
Table 57 Czech Republic: Electroactive Polymers Market Size, By Application, 2015�2022 (USD Million)
Table 58 Poland: Market Size, By Application, 2015�2022 (USD Million)
Table 59 Rest of Central & Eastern Europe: Market Size, By Application, 2015�2022 (USD Million)
Table 60 Middle East & Africa: Market Size, By Country, 2015�2022 (USD Billion)
Table 61 Middle East & Africa: Market Size, By Country, 2015�2022 (Kiloton)
Table 62 Middle East & Africa: Market Size, By Type, 2015�2022 (USD Billion)
Table 63 Middle East & Africa: Market Size, By Product Type, 2015�2022 (Kiloton)
Table 64 Middle East & Africa: Market Size, By Application, 2015�2022 (USD Billion)
Table 65 Saudi Arabia: Market Size, By Application, 2015�2022 (USD Million)
Table 66 UAE: Electroactive Polymers Market Size, By Application, 2015�2022 (USD Million)
Table 67 Rest of Middle East & Africa: Market Size, By Application, 2015�2022 (USD Million)
Table 68 South America: Market Size, By Country, 2015�2022 (USD Billion)
Table 69 South America: Market Size, By Country, 2015�2022 (Kiloton)
Table 70 South America: Market Size, By Type, 2015�2022 (USD Billion)
Table 71 South America: Market Size, By Type, 2015�2022 (USD Billion)
Table 72 South America: Market Size, By Application, 2015�2022 (USD Billion)
Table 73 Brazil: Electroactive Polymers Market Size, By Application, 2015�2022 (USD Million)
Table 74 Argentina: Market Size, By Application, 2015�2022 (USD Million)
Table 75 Rest of South America: Market Size, By Application, 2015�2022 (USD Million)
Table 76 New Product Developments (2012�2017)
Table 77 Agreements & Joint Ventures, 2012�2017
Table 78 Mergers & Acquisitions, 2012�2017
List of Figures (35 Figures)
Figure 1 EAPS Market Segmentation
Figure 2 EAPS Market: Research Design
Figure 3 Market Size Estimation: Top-Down Approach
Figure 4 Market Size Estimation: Bottom-Up Approach
Figure 5 EAPS Market: Data Triangulation
Figure 6 Conductive Plastics to Be the Largest Segment of the Market
Figure 7 Actuators to Be the Fastest-Growing Application of the Market
Figure 8 APAC Was the Largest Electroactive Polymers Market in 2016
Figure 9 Growing Smart Fabrics and Smart Electronics Market to Drive the Demand of Electroactive Polymers During the Forecast Period
Figure 10 Conductive Plastics to Be the Largest Segment
Figure 11 ESD Protection Was the Largest Application in APAC in 2016
Figure 12 China to Emerge as Most Lucrative Market to Between 2017 and 2022 (USD Million)
Figure 13 Drivers, Restraints, Opportunities, and Challenges of EAPS Market
Figure 14 Porter�s Five Forces Analysis: EAPS Market
Figure 15 Inherently Conductive Polymers to Be the Fastest-Growing Segment
Figure 16 APAC to Be the Largest Market for Conductive Plastics Between 2017 and 2022
Figure 17 ESD Protection to Be the Largest Application in the EAPS Market
Figure 18 APAC to Be the Largest EAPS Market in ESD Protection
Figure 19 APAC Market to Register Highest CAGR Between 2017 and 2022
Figure 20 APAC EAPS Market Snapshot
Figure 21 North American EAPS Market Snapshot
Figure 22 Western European EAPS Market Snapshot
Figure 23 Central & Eastern European EAPS Market Snapshot
Figure 24 Middle East & African EAPS Market Snapshot
Figure 25 South American EAPS Market Snapshot
Figure 26 Companies Adopted Mergers & Acquisitions as the Major Growth Strategies (2012�2016)
Figure 27 Electroactive Polymers Market Key Players Ranking, 2016
Figure 28 Solvay: Company Snapshot
Figure 29 Parker Hannifin: Company Snapshot
Figure 30 AGFA-Gevaert: Company Snapshot
Figure 31 3M: Company Snapshot
Figure 32 Merck: Company Snapshot
Figure 33 Lubrizol: Company Snapshot
Figure 34 Polyone: Company Snapshot
Figure 35 Heraeus: Company Snapshot


Growth opportunities and latent adjacency in Electroactive Polymer Market
Interested in specific information on Anti-static Packaging market
Europe Electroactive polymer market