Electrodeionization Market by Design (Plate and Frame Construction, and Spiral Wound Construction), End-use Industry (Power Generation, Pharmaceuticals, Electronics & Semiconductor), and Region - Global Forecast to 2024


[108 Pages Report] The electrodeionization market in 2019 is estimated to be USD 827 million and is projected to reach USD 1,124 million by 2024, at a CAGR of 6.3% from 2019 to2024. The key factor driving the growth of the electrodeionization market is the increasing demand for ultrapure water from the power generation, electronics & semiconductor, and pharmaceuticals industries.
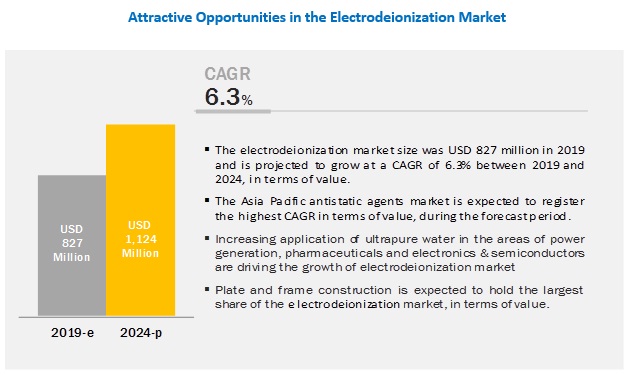
Based on design, the plate and frame segment is projected to lead the electrodeionization market during the forecast period
The plate and frame segment is estimated to account for the largest share of the electrodeionization market in 2019. Plate and frame construction design electrodeionization market accounts for larger market share owing to lower operating cost, simple design, and high durability. The plate and frame construction design consists of 2 compartments that are identical to each other, due to which, the plate and frame design offers the advantage of equal water flow and electric current distribution among the stacks, lower operating cost, simple design, and greater durability.
By end-use industry, the power generation industry is projected to lead the electrodeionization market during the forecast period
Major end-use industries in the electrodeionization market include power generation, pharmaceuticals, electronics & semiconductor, and others. The demand for ultrapure water from the power generation industry is growing at a significant pace. Ultrapure water is needed to prevent clotting or disruption in boiler tubes as well as high temperature corrosion. Major challenges faced by manufacturers of electrodeionization include availability of alternative technologies to produce ultrapure water.
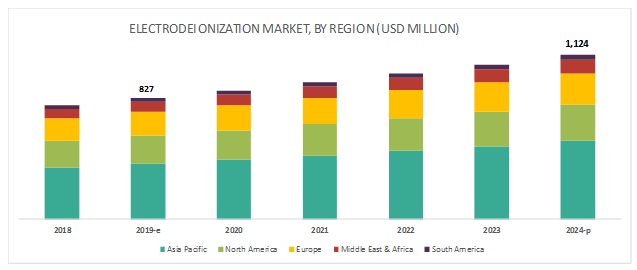
Asia Pacific is projected to lead the electrodeionization market during the forecast period
The electrodeionization market in the Asia Pacific region is projected to grow at the highest CAGR between 2019 and 2024. China, Japan, and India have witnessed economic growth, owing to increased construction activity and foreign direct investments undertaken for the expansion or upgradation of manufacturing facilities. Moreover, initiatives undertaken by various governments worldwide to support growth in the manufacturing sector, such as power generation, pharmaceuticals, and electronics & semiconductor are further expected to propel the demand for electrodeionization in the Asia Pacific region.
Key Market Players
Suez SA (France), Veolia Environnement S.A. (France), Evoqua Water Technologies LLC (US), Qua Group (US), DowDuPont Inc. (US), Snowpure LLC (US), Mega a.s. (Czech Republic), Ovivo Inc. (Canada), and Pure Aqua Inc. (US), among others are the major players in the electrodeionization market. These players have been focusing on developmental strategies, such as contracts, mergers & acquisitions, expansions, and divestments, which have helped them expand their businesses in untapped and potential markets. They have also been adopting various organic and inorganic growth strategies, such as new product developments, acquisitions, and expansions, to enhance their current positions in the electrodeionization market.
Scope of the Report:
|
Report Metric |
Details |
|
Market size available for years |
2017�2024 |
|
Base year considered |
2018 |
|
Forecast period |
2019�2024 |
|
Forecast units |
Value (USD) |
|
Segments covered |
Design, End-use Industry, and Region |
|
Regions covered |
Asia Pacific, North America, Europe, Middle East & Africa, and South America |
|
Companies covered |
Suez SA (France), Veolia Environnement S.A. (France), Evoqua Water Technologies LLC (US), Qua Group (US), DowDuPont Inc. (US), Snowpure LLC (US), Mega a.s. (Czech Republic), Ovivo Inc. (Canada), Pure Aqua Inc. (US) and others |
This report categorizes the electrodeionization market based on design, end-use industry, and region.
On the basis of design, the electrodeionization market is segmented as follows:
- Plate and frame construction
- Spiral wound construction
On the basis of end-use industry, the electrodeionization market is segmented as follows:
- Power Generation
- Pharmaceuticals
- Electronics & Semiconductor
- Others (automotive, chemicals and food & beverages)
On the basis of region, the electrodeionization market is segmented as follows:
- North America
- Europe
- Asia Pacific
- South America
- Middle East & Africa
Recent Developments
- In September 2016, Suez SA acquired GE Water & Process Technologies to enhance the product portfolio of the company. The combination of GE�s activities and Suez�s own industrial water treatment has covered the wastewater process value chain to design and build projects which could be further served to multiple sectors of industries.
- In July 2016, Evoqua Water Technologies awarded a contract to Quassim Power Plant to use its brand Ionpure continuous electrodeionization to ensure the highest quality of water flows through the boiler for the generation of steam. With this contract, Evoqua Water Technologies strengthened its customer base in the Arabian Peninsula by meeting the demand for power in Quassim.
- In May 2016, Ovivo was awarded a contract worth over USD 21 million in China and the US. The contract was to supply the ultrapure water system to the leading TFT/LCD manufacturer in China and to the energy and electronics segment in the US. With this contract, the company has expanded its global services.
Key questions addressed by the report
- What are the future revenue pockets in the electrodeionization market?
- Which key developments are expected to have a long-term impact on the electrodeionization market?
- Which design is expected to cannibalize existing markets?
- How is the current regulatory framework expected to impact the market?
- What will be the future product mix of the electrodeionization market?
- What are the prime strategies of leaders in the electrodeionization market?
To speak to our analyst for a discussion on the above findings, click Speak to Analyst
 Exclusive indicates content/data unique to MarketsandMarkets and not available with any competitors.
Table of Contents
1 Introduction (Page No. - 14)
1.1 Objectives of the Study
1.2 Market Definition
1.3 Study Scope
1.3.1 Markets Covered
1.3.2 Years Considered for the Study
1.4 Currency
1.5 Stakeholders
1.6 Limitations
2 Research Methodology (Page No. - 17)
2.1 Research Data
2.1.1 Secondary Data
2.1.1.1 Key Data From Secondary Sources
2.1.2 Primary Data
2.1.2.1 Key Data From Primary Sources
2.1.2.2 Key Industry Insights
2.1.2.3 Break Down of Primaries
2.2 Market Size Estimation
2.3 Market Breakdown and Data Triangulation
2.4 Assumptions
3 Executive Summary (Page No. - 23)
4 Premium Insights (Page No. - 25)
4.1 Attractive Opportunities in the Electrodeionization Market
4.2 Electrodeionization Market, By Design
4.3 Electrodeionization Market, By End-Use Industry and Design
5 Market Overview (Page No. - 27)
5.1 Introduction
5.2 Market Dynamics
5.2.1 Drivers
5.2.1.1 Increasing Demand for Ultrapure Water From the Power Generation, Pharmaceutical, and Electronics & Semiconductor End-Use Industries
5.2.1.2 Increasing Industrialization in Emerging Economies
5.2.1.3 Increase in the Generation of Wastewater
5.2.2 Restraints
5.2.2.1 Availability of Alternative Technologies to Obtain Ultrapure Water
5.2.3 Opportunities
5.2.3.1 Chemical-Free Process
5.2.3.2 Growing Demand for Energy�Efficient and Advanced Water Systems
5.2.4 Challenges
5.2.4.1 High Installation and Operational Cost
5.3 Porter�s Five Forces Analysis
5.3.1 Threat of New Entrants
5.3.2 Threat of Substitutes
5.3.3 Bargaining Power of Suppliers
5.3.4 Bargaining Power of Buyers
5.3.5 Intensity of Competitive Rivalry
6 Electrodeionization Market, By Design (Page No. - 33)
6.1 Introduction
6.2 Plate and Frame Construction
6.2.1 Low Operating Cost, Simple Design, and High Durability are Expected to Drive the Growth of the Plate and Frame Construction Segment
6.3 Spiral Wound Construction
6.3.1 Spiral Wound Construction Segment is Expected to Grow Owing to Its Sleek Design and Leak-Free Operation
7 Electrodeionization Market, By End-Use Industry (Page No. - 37)
7.1 Introduction
7.2 Power Generation
7.2.1 Awareness Regarding the Advantages of Ultrapure Water in the Power Generation Industry is Expected to Drive the Market
7.3 Pharmaceuticals
7.3.1 Increasing Applications of Ultrapure Water in Pharmaceuticals are Anticipated to Fuel the Market for Electrodeionization
7.4 Electronics & Semiconductor
7.4.1 Increasing Demand for Ultrapure Water in the Electronics & Semiconductor Industry for Wafer Washing has Fueled the Growth of the Market
7.5 Others
7.5.1 Rising Demand for Ultrapure Water is Projected to Drive the Electrodeionization Market for Other End-Use Industries During the Forecast Period
8 Regional Analysis (Page No. - 42)
8.1 Introduction
8.2 Asia Pacific
8.2.1 China
8.2.1.1 China is Projected to Lead the Asia Pacific Electrodeionization Market During the Forecast Period
8.2.2 Japan
8.2.2.1 Rise in Production of Electronic Components is Projected to Fuel the Growth of the Market in Japan
8.2.3 India
8.2.3.1 Availability of Cheap Labor and Rise in the Inflow of Fdi in the Manufacturing Sector of the Country are Fueling the Growth of
the Market in India 48
8.2.4 Australia
8.2.4.1 Rising Environmental Concerns and Increasing End-Use Industries are Expected to Contribute to the Growth of the Market in
Australia
8.2.5 South Korea
8.2.5.1 Increasing Demand for Ultrapure Water in the Electronics & Semiconductor Industry in the Country is Projected to Drive the Growth
of the Market in South Korea
8.2.6 Rest of Asia Pacific
8.2.6.1 Growth of Various End-Use Industries is Expected to Lead the Market in the Rest of Asia Pacific
8.3 North America
8.3.1 US
8.3.1.1 US is Projected to Lead the North America Market From 2019 to 2024
8.3.2 Canada
8.3.2.1 Increasing Demand for Ultrapure Water From Various End-Use Industries in Canada is Expected to Drive the Growth of the Market in
the Country
8.3.3 Mexico
8.3.3.1 Increasing Investments in the Manufacturing Sector are Expected to Drive the Growth of the Market in Mexico
8.4 Europe
8.4.1 Germany
8.4.1.1 Strict Environmental Regulations are Expected to Drive the Growth of the Market in Germany
8.4.2 Russia
8.4.2.1 Increase in Energy Consumption is Expected to Drive the Market in Russia
8.4.3 Italy
8.4.3.1 Increasing Investment in the Power Generation Sector is Expected to Drive the Growth of the Market in Italy
8.4.4 France
8.4.4.1 Increasing Foreign Investments in Various End-Use Industries are Expected to Fuel the Growth of the Market in France
8.4.5 UK
8.4.5.1 Increasing Investments and Innovations in Water Treatment Technologies in the Country are Expected to Drive the Growth of the
Market in the UK
8.4.6 Spain
8.4.6.1 Increasing Pharmaceutical Industries are Expected to Fuel the Growth of the Market in Spain
8.4.7 Rest of Europe
8.4.7.1 Growth of Various End-Use Industries is Expected to Contribute to the Growth of the Market in the Rest of Europe
8.5 Middle East & Africa (MEA)
8.5.1 Saudi Arabia
8.5.1.1 Significant Industrial Infrastructure and Increase in Demand for Ultrapure Water for Industrial Applications is Fueling the Growth of the Saudi Arabia Market
8.5.2 UAE
8.5.2.1 Increasing Demand for Water Treatment Plants is Expected to Fuel the Growth of the UAE Market
8.5.3 South Africa
8.5.3.1 Increasing Need for Reuse of Wastewater to Obtain Ultrapure Water for Industrial Use is Driving the Growth of the Market in South Africa
8.5.4 Rest of Middle East & Africa
8.5.4.1 Rising Demand for Electrodeionization From the Automotive and Chemicals Sectors is Projected to Propel the Growth of the Market in the Rest of Middle East & Africa
8.6 South America
8.6.1 Brazil
8.6.1.1 Increased Government Initiatives for Improved Water Services is Expected to Fuel the Demand for Electrodeionization in the Country
8.6.2 Argentina
8.6.2.1 Increasing Environmental Concerns are Expected to Lead to the Growth of the Market in Argentina
8.6.3 Rest of South America
8.6.3.1 Increase in Demand for Ultrapure Water is Expected to Fuel the Growth of the Rest of South America Market
9 Competitive Landscape (Page No. - 77)
9.1 Introduction
9.1.1 Visionaries
9.1.2 Innovators
9.1.3 Dynamic Differentiators
9.1.4 Emerging Companies
9.2 Market Ranking of Key Players in the Electrodeionization Market
10 Company Profiles (Page No. - 79)
(Business Overview, Products/Solutions Offered, Recent Developments, SWOT Analysis, MnM View)*
10.1 Suez SA
10.2 Veolia Environnement S.A.
10.3 Evoqua Water Technologies LLC
10.4 Dowdupont Inc.
10.5 Ovivo Inc.
10.6 Mega A.S.
10.7 Qua Group
10.8 Snowpure, LLC
10.9 Pure Aqua Inc.
10.10 Newterra Ltd.
10.11 Other Key Players
10.11.1 Guangzhou Kaiyuan Water Treatment Equipment Co. Ltd
10.11.2 Westech Engineering, Inc.
10.11.3 Bwt Pharma & Biotech Gmbh
10.11.4 Hinada Water Treatment Tech Co., Ltd
10.11.5 Applied Membranes, Inc.
10.11.6 Samco Technologies, Inc.
10.11.7 Progressive Water Treatment
10.11.8 Real Water Tech Co., Ltd
10.11.9 Heliant Technologies
10.11.10 Axeon Water Technologies
10.11.11 Xi'an Xin Sheng Tai Water Treatment Technology Co. Ltd.
10.11.12 Osmo Sistemi S.R.L.
10.11.13 Angstrom M�hendislik
10.11.14 Millipure Water System
10.11.15 Martin Water Technologies Inc
*Details on Business Overview, Products/Solutions Offered, Recent Developments, SWOT Analysis, MnM View Might Not Be Captured in Case of Unlisted Companies.
11 Appendix (Page No. - 101)
11.1 Industry Experts
11.2 Discussion Guide
11.3 Knowledge Store: Marketsandmarkets Subscription Portal
11.4 Available Customizations
11.5 Related Reports
11.6 Author Details
List of Tables (70 Tables)
Table 1 Electrodeionization Market, By Design, 2017�2024 (USD Million)
Table 2 Plate and Frame Construction Electrodeionization Market, By Region, 2017�2024 (USD Million)
Table 3 Spiral Wound Construction Electrodeionization Market, By Region, 2017�2024 (USD Million)
Table 4 EDI Market, By End-Use Industry, 2017�2024 (USD Million)
Table 5 Electrodeionization (EDI) Market for Power Generation, By Region, 2017�2024 (USD Million)
Table 6 Electrodeionization (EDI) System Market for Pharmaceuticals, By Region, 2017�2024 (USD Million)
Table 7 Electrodeionization Market for Electronics & Semiconductor, By Region, 2017�2024 (USD Million)
Table 8 EDI Market for Other End-Use Industries, By Region, 2017�2024 (USD Million)
Table 9 Electrodeionization (EDI) Market, By Region, 2017�2024 (USD Million)
Table 10 Asia Pacific Electrodeionization Market, By Country, 2017�2024 (USD Million)
Table 11 Asia Pacific EDI Market, By End-Use Industry, 2017�2024 (USD Million)
Table 12 Asia Pacific Electrodeionization (EDI) Market, By Design, 2017�2024 (USD Million)
Table 13 China Electrodeionization (EDI) System Market, By End-Use Industry, 2017�2024 (USD Million)
Table 14 China Plate and Frame Construction Electrodeionization Market, By Design, 2017�2024 (USD Million)
Table 15 Japan Electrodeionization Market, By End-Use Industry, 2017�2024 (USD Million)
Table 16 Japan EDI Market, By Design, 2017�2024 (USD Million)
Table 17 India Electrodeionization (EDI) Market, By End-Use Industry, 2017�2024 (USD Million)
Table 18 India Electrodeionization (EDI) System Market, By Design, 2017�2024 (USD Million)
Table 19 Australia Plate and Frame Construction Electrodeionization Market, By End-Use Industry, 2017�2024 (USD Million)
Table 20 Australia Electrodeionization Market, By Design, 2017�2024 (USD Million)
Table 21 South Korea EDI Market, By End-Use Industry, 2017�2024 (USD Million)
Table 22 South Korea Electrodeionization (EDI) Market, By Design, 2017�2024 (USD Million)
Table 23 Rest of Asia Pacific Electrodeionization (EDI) System Market, By End-Use Industry, 2017�2024 (USD Million)
Table 24 Rest of Asia Pacific Plate and Frame Construction Electrodeionization Market, By Design, 2017�2024 (USD Million)
Table 25 North America Electrodeionization Market, By Country, 2017�2024 (USD Million)
Table 26 North America EDI Market, By End-Use Industry, 2017�2024 (USD Million)
Table 27 North America Electrodeionization (EDI) Market, By Design, 2017�2024 (USD Million)
Table 28 US Electrodeionization (EDI) System Market, By End-Use Industry, 2017�2024 (USD Million)
Table 29 US Plate and Frame Construction Electrodeionization Market, By Design, 2017�2024 (USD Million)
Table 30 Canada Electrodeionization Market, By End-Use Industry, 2017�2024 (USD Million)
Table 31 Canada EDI Market, By Design, 2017�2024 (USD Million)
Table 32 Mexico Electrodeionization (EDI) Market, By End-Use Industry, 2017�2024 (USD Million)
Table 33 Mexico Electrodeionization (EDI) System Market, By Design, 2017�2024 (USD Million)
Table 34 Europe Electrodeionization Market, By Country, 2017�2024 (USD Million)
Table 35 Europe EDI Market, By End-Use Industry, 2017�2024 (USD Million)
Table 36 Europe Electrodeionization (EDI) Market, By Design, 2017�2024 (USD Million)
Table 37 Germany Electrodeionization (EDI) System Market, By End-Use Industry, 2017�2024 (USD Million)
Table 38 Germany Plate and Frame Construction Electrodeionization Market, By Design, 2017�2024 (USD Million)
Table 39 Russia Electrodeionization Market, By End-Use Industry, 2017�2024 (USD Million)
Table 40 Russia EDI Market, By Design, 2017�2024 (USD Million)
Table 41 Italy Electrodeionization (EDI) Market, By End-Use Industry, 2017�2024 (USD Million)
Table 42 Italy Electrodeionization (EDI) System Market, By Design, 2017�2024 (USD Mllion)
Table 43 France Plate and Frame Construction Electrodeionization Market, By End-Use Industry, 2017�2024 (USD Million)
Table 44 France Electrodeionization Market, By Design, 2017�2024 (USD Million)
Table 45 UK EDI Market, By End-Use Industry, 2017�2024 (USD Million)
Table 46 UK Electrodeionization (EDI) Market, By Design, 2017�2024 (USD Million)
Table 47 Spain Electrodeionization (EDI) System Market, By End-Use Industry, 2017�2024 (USD Million)
Table 48 Spain Plate and Frame Construction Electrodeionization Market, By Design, 2017�2024 (USD Million)
Table 49 Rest of Europe Electrodeionization Market, By End-Use Industry, 2017�2024 (USD Million)
Table 50 Rest of Europe EDI Market, By Design, 2017�2024 (USD Million)
Table 51 Middle East & Africa Electrodeionization Market, By Country, 2017�2024 (USD Million)
Table 52 Middle East & Africa EDI Market, By End-Use Industry, 2017�2024 (USD Million)
Table 53 Middle East & Africa Electrodeionization (EDI) Market, By Design, 2017�2024 (USD Million)
Table 54 Saudi Arabia Electrodeionization (EDI) System Market, By End-Use Industry, 2017�2024 (USD Million)
Table 55 Saudi Arabia Plate and Frame Construction Electrodeionization Market, By Design, 2017�2024 (USD Million)
Table 56 UAE Electrodeionization Market, By End-Use Industry, 2017�2024 (USD Million)
Table 57 UAE EDI Market, By Design, 2017�2024 (USD Million)
Table 58 South Africa Electrodeionization (EDI) Market, By End-Use Industry, 2017�2024 (USD Million)
Table 59 South Africa Electrodeionization (EDI) System Market, By Design, 2017�2024 (USD Million)
Table 60 Rest of Middle East & Africa Plate and Frame Construction Electrodeionization Market, By End-Use Industry, 2017�2024 (USD Million)
Table 61 Rest of Middle East & Africa Market, By Design, 2017�2024 (USD Million)
Table 62 South America Electrodeionization Market, By Country, 2017�2024 (USD Million)
Table 63 South America EDI Market, By End-Use Industry, 2017�2024 (USD Million)
Table 64 South America Electrodeionization (EDI) Market, By Design, 2017�2024 (USD Million)
Table 65 Brazil Electrodeionization (EDI) System Market, By End-Use Industry, 2017�2024 (USD Million)
Table 66 Brazil Plate and Frame Construction Electrodeionization Market, By Design, 2017�2024 (USD Million)
Table 67 Argentina Electrodeionization Market, By End-Use Industry, 2017�2024 (USD Million)
Table 68 Argentina EDI Market, By Design, 2017�2024 (USD Million)
Table 69 Rest of South America Electrodeionization (EDI) Market, By End-Use Industry, 2017�2024 (USD Million)
Table 70 Rest of South America Electrodeionization (EDI) System Market, By Design, 2017�2024 (USD Million)
List of Figures (33 Figures)
Figure 1 Electrodeionization Market: Research Design
Figure 2 Breakdown of Primary Interviews: By Company, Designation, and Region
Figure 3 Market Size Estimation: Top-Down Approach
Figure 4 Market Size Estimation: Bottom-Up Approach
Figure 5 Power Generation Segment Expected to Lead the Electrodeionization Market From 2019 to 2024 in Terms of Value
Figure 6 Asia Pacific Region Projected to Lead the Electrodeionization Market From 2019 to 2024
Figure 7 Asia Pacific Electrodeionization Market to Grow at the Highest Cagr During the Forecast Period
Figure 8 Plate and Frame Construction Projected to Be the Larger and Faster-Growing Design Segment During the Forecast Period
Figure 9 Power Generation End-Use Industry Accounted for the Largest Share of the Electrodeionization Market in 2018
Figure 10 Electrodeionization Market Dynamics
Figure 11 Porter�s Five Forces Analysis
Figure 12 Electrodeionization Market, By Design, 2019 & 2024 (USD Million)
Figure 13 Pharmaceuticals End-Use Industry Segment is Projected to Grow at the Highest Cagr From 2019 to 2024
Figure 14 The Electrodeionization Market in the Asia Pacific is Projected to Grow at the Highest Cagr From 2019 to 2024
Figure 15 Asia Pacific Electrodeionization Market Snapshot
Figure 16 North America Electrodeionization Market Snapshot
Figure 17 Europe Electrodeionization Market Snapshot
Figure 18 Middle East Electrodeionization Market Snapshot
Figure 19 South America Electrodeionization Market Snapshot
Figure 20 Dive Chart
Figure 21 Suez SA: Company Snapshot
Figure 22 Suez SA: SWOT Analysis
Figure 23 Veolia Environnement S.A.: Company Snapshot
Figure 24 Veolia Environnement S.A.: SWOT Analysis
Figure 25 Evoqua Water Technologies LLC: Company Snapshot
Figure 26 Evoqua Water Technologies LLC: SWOT Analysis
Figure 27 Dowdupont Inc.: Company Snapshot
Figure 28 Dowdupont Inc.: SWOT Analysis
Figure 29 Ovivo Inc.: Company Snapshot
Figure 30 Ovivo Inc.: SWOT Analysis
Figure 31 Mega A.S.: Company Snapshot
Figure 32 Mega A.S.: SWOT Analysis
Figure 33 Snowpure, LLC: SWOT Analysis
The study involved 4 major activities in estimating the current market size for electrodeionization. Exhaustive secondary research was carried out to collect information on the market, peer markets, and the parent market. The next step was to validate the findings collected from secondary sources, assumptions, and sizing with industry experts across the value chain through primary research. Both, the top-down and bottom-up approaches were employed to estimate the complete market size. Thereafter, market breakdown and data triangulation procedures were used to estimate the market size of segments and subsegments.
Secondary Research
In the secondary research process, sources, such as D&B Hoovers, Bloomberg BusinessWeek, and Dun & Bradstreet, were referred to for identifying and collecting information for this study. Other secondary sources included annual reports, press releases & investor presentations of companies, whitepapers, certified publications, articles by recognized authors, gold standard & silver standard websites, associations, regulatory bodies, trade directories, and databases.
Primary Research
The electrodeionization market comprises stakeholders, such as module suppliers, systems and equipment manufacturers, and regulatory organizations in the supply chain. The demand side of this market is characterized by developments in the power generation, pharmaceuticals, electronics & semiconductor and other end-use industries. The supply side is characterized by market consolidation activities undertaken by electrodeionization manufacturers. Several primary sources from both, the supply and demand sides of the market were interviewed to obtain qualitative and quantitative information. Following is the breakdown of primary respondents.
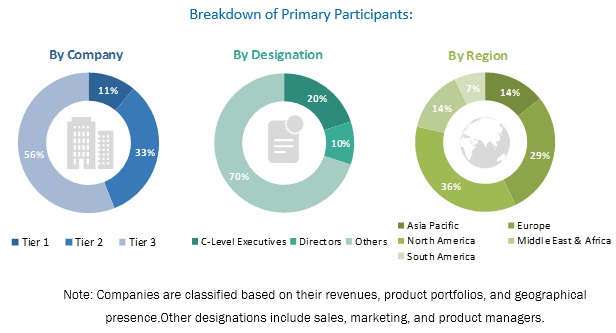
To know about the assumptions considered for the study, download the pdf brochure
Market Size Estimation:
Both, the top-down and bottom-up approaches were used to estimate and validate the total size of the electrodeionization market. These methods were also used extensively to estimate the size of various subsegments in the market. The research methodology used to estimate the market size included the following:
- Key players in the industry and markets were identified through extensive secondary research.
- The industry�s supply chain and market size, in terms of volume, were determined through primary and secondary research processes.
- All percentage shares, splits, and breakdowns were determined using secondary sources and verified through primary sources.
Data Triangulation:
After arriving at the overall market size-using the market size estimation process explained above-the market was split into several segments and subsegments. In order to complete the overall market engineering process and arrive at the exact statistics of each market segment and subsegment, the data triangulation and market breakdown procedures were employed, wherever applicable. The data was triangulated by studying various factors and trends from both, the demand and supply sides.
Report Objectives:
- To define and describe the size of the electrodeionization market based on design, end-use industry, and region
- To estimate and forecast the size of the electrodeionization market, in terms of value (USD million).
- To analyze region-specific trends in North America, Europe, Asia Pacific, the Middle East & Africa, and South America
- To identify and analyze the key drivers, restraints, opportunities, and challenges impacting the growth of the electrodeionization market across the globe
- To strategically identify and profile key market players, and analyze their core competencies1 in the market
- To analyze competitive developments, such as acquisitions, new product launches, and expansions that have taken place in the market
Available Customizations:
Along with the market data, MarketsandMarkets offers customizations according to the specific needs of companies. The following customization options are available for the report:
Regional Analysis
- A further breakdown of the regional electrodeionization market to the country level by process
Country Information
- Regional market split by major countries
Company Information
- Detailed analysis and profiles of additional market players (up to 5)


Growth opportunities and latent adjacency in Electrodeionization Market