Emission Monitoring System Market

Emission Monitoring System Market by System Type (CEMS and PEMS), Device Type (Gas Analyzers, Flow & Opacity Monitors, Sample Probes, Data Controllers, Filters), Software, Services, Industry and Region - Global Forecast to 2028

Report Code: SE 3919 Nov, 2023, by marketsandmarkets.com

[220 Pages Report] The global emission monitoring system market size is expected to grow from USD 3.2 billion in 2023 to USD 5.0 billion by 2028, at a CAGR of 9.3% from 2023 to 2028. Manufacturing companies are required to ensure that their pollutant emission rates are within specified limits. To achieve this, countries have issued laws and ordinances that provide detailed instructions for emission control measures. For instance, the Federal Emission Control Act was introduced in Germany, while the United States implemented the Environmental Protection Agency (EPA) Clean Air Act. The concern over hazardous gas emissions has led to an increase in demand for emission monitoring systems that help protect the environment.

Emission Monitoring System Market

Emission Monitoring System Market

Emission Monitoring System Market Forecast to 2028

To know about the assumptions considered for the study, Request for Free Sample Report

Market Dynamics

DRIVERS: Rising emphasis on ambient air quality monitoring

Air quality monitoring for outdoor environments is considered critical in several countries worldwide. Several cities worldwide that have an advanced civic technology environment or those planning major infrastructure upgrades in their existing ones should consider integrating EMS into their infrastructures. Cities with “Smart City” agendas and advanced data management capabilities can measure emissions using these systems. People living in highly polluted towns and cities are realizing the impact of harmful gases and particles. For instance, a European city London faces high air pollution and in minority of the cases the air pollution considered as the proven fatal. Thus, it is becoming necessary to monitor the ambient air quality in major cities to maintain environmental and human health.

RESTRAINTS: High maintenance costs associated with emission monitoring systems

A continuous emission monitoring system (CEMS) is a hardware-based emission monitoring system that collects data with the help of gas analyzers and sensors. Industries require emission monitoring systems that remain operational even in extreme environmental conditions. Manufacturers have to carry out regular or frequent maintenance of continuous emission monitoring systems to keep them working 24 hours a day and obtain a high level of reliability. Depending on the application, continuous emission monitoring systems require maintenance daily, monthly, quarterly, semi-annually, or annually. The maintenance cost of these systems is very high.

OPPORTUNITIES: Growing pharmaceuticals industry

The pharmaceutical industry is rapidly growing worldwide due to an aging population and an increased prevalence of chronic diseases, which drives the demand for prescription drugs. Additionally, advancements in technology within the industry are contributing to its growth. However, the manufacturing processes in pharmaceuticals are complex and involve the use of various chemicals and solvents that can release pollutants such as volatile organic compounds (VOCs), hazardous air pollutants (HAPs), and particulate matter (PM) that can harm the environment. Therefore, the US Environmental Protection Agency (EPA) has recently finalized regulations for controlling emissions of HAPs from pharmaceutical manufacturing facilities. These regulations will require pharmaceutical companies to install and operate emission monitoring systems to monitor and control their emissions.

CHALLENGES: Performance limitations of emission monitoring systems in harsh operating conditions

Emission monitoring systems face technical challenges due to strict regulatory frameworks. These systems need to be maintained and designed to comply with regulations. They operate in harsh environments and extreme conditions such as dust, fog, and rain, making them susceptible to accuracy and performance-related issues.  In various critical industries, including chemicals, petrochemicals, and oil & gas, emission monitoring systems are commonly utilized. However, these systems face challenges in providing precise and dependable data due to the installation of analyzers in hard-to-reach locations. This can cause issues with calibration, maintenance, and replacement of the devices, which may further compound the problems.

Emission Monitoring System Market Ecosystem

Prominent companies in this market include well-established, financially stable manufacturers such as ABB (Switzerland), AMETEK. Inc. (US), Emerson Electric Co. (US), Siemens (Germany), and Thermo Fisher Scientific Inc. (US). These companies have been operating in the market for several years and possess a diversified product portfolio and strong global sales and marketing networks. Along with the well-established companies, there are a large number of startups and small companies operating in this market, such as Gasmet Technologies Oy ( Finland) and Protea Ltd. (UK).

Emission Monitoring System Market by Ecosystem

Hardware segment is expected to hold largest market share during the forecast period.

Emission monitoring systems rely highly on hardware components to collect accurate data on emissions. These components play a vital role in the system’s ability to monitor emissions effectively. Continuous emission monitoring systems (CEMS) function through hardware components, whereas predictive emission monitoring systems (PEMS) are powered by software and use few hardware components such as sensors to predict gas emissions. Gas analyzers, gas sampling systems, flow and opacity monitors, particulate matter monitors, sample probes, sample lines, data controllers, and filters are examples of some hardware components deployed in CEMS. CEMS are used to collect data regarding emissions of gases from various industries, such as power generation, oil & gas, chemicals, building materials, and waste incineration. The increasing number of regulations for pollution monitoring in various industries has led to a rise in demand for CEMS, which, in turn, has boosted demand for hardware components.

The market for PEMS is projected to grow with substantial CAGR during the forecast period.

A PEMS provides continuous data recording and generates reports in accordance with US Environmental Protection Agency (US EPA) regulations. It is an improved version of the emission monitoring system. Moreover, the PEMS software is easy to configure using a non-proprietary user interface. It uses process sensors and mathematical or statistical models to analyze gas concentrations or emission rates. The cost of PEMS is lower than that of CEMS because the preventive emission monitoring system is based on software, thereby eliminating the need for costly sensors and analyzers. However, some PEMS solutions may recommend the use of additional hardware components, such as a data acquisition system (DAS), to improve the accuracy of the predictions.

The market in Asia Pacific is projected to hold the largest market share from 2023 to 2028.

Emission Monitoring System Market by Region

Emission Monitoring System Market by Region

To know about the assumptions considered for the study, download the pdf brochure

The EMS market in Asia Pacific is classified into China, Japan, South Korea, India, and Rest of Asia Pacific. Countries such as China, India, and South Korea are witnessing increasing demand for emission monitoring systems. China and India are significant contributors to the EMS market growth in Asia Pacific. The market growth can also be attributed to the growing power generation and chemicals end-user industries—prime users of emission monitoring systems in the region. Moreover, the increasing capacities of coal-fired power plants is another reason for the growing demand for emission monitoring systems.

China is one of the fastest-growing economies in the world. It has significant coal, oil, natural gas, iron ore, copper, lead, zinc, gold, and diamond reserves. The rapid economic growth of the country has expanded energy needs. China is one of the largest producers, consumers, and importers of coal. Moreover, the rapid development of industries across the country to meet the increasing customer demands is expected to fuel the growth of the EMS market in the country.

Key Market Players

ABB (Switzerland), AMETEK. Inc. (US), Emerson Electric Co. (US), Siemens (Germany), and Thermo Fisher Scientific Inc. (US), are among a few top players in the emission monitoring system companies.

Get online access to the report on the World's First Market Intelligence Cloud

  • Easy to Download Historical Data & Forecast Numbers
  • Company Analysis Dashboard for high growth potential opportunities
  • Research Analyst Access for customization & queries
  • Competitor Analysis with Interactive dashboard
  • Latest News, Updates & Trend analysis
Request Sample

Scope of the Report

Report Metric

Details

Market Size Available for Years

2019–2028

Base Year

2022

Forecast Period

2023–2028

Units

Value (USD Million/Billion)

Segments Covered

Types of Emission, Offering,  System Type, and Industry

Geographic Regions Covered

North America, Europe, Asia Pacific, and RoW

Companies Covered

Major Players:  ABB (Switzerland), AMETEK. Inc. (US), Emerson Electric Co. (US), Siemens (Germany), Thermo Fisher Scientific Inc. (US), SICK AG (Germany), Fuji Electric Co., Ltd. (Japan), HORIBA, Ltd. (Japan), Baker Hughes Company (US), Teledyne Technologies Incorporated (US), Honeywell International Inc. (US), Spectris (UK), and Others - (Total 24 players have been covered)

Emission Monitoring System Market Highlights

This research report categorizes the emission monitoring system market by types of emission, offering,  system type, industry, and region.

Segment

Subsegment

Types of Emission:

  • Oxygen
  • Carbon Monoxide
  • Carbon Dioxide
  • Ammonia
  • Hydrogen Sulfide
  • Nitrogen Oxide
  • Hydrocarbons

By System Type:

  • Continuous Emission Monitoring System (CEMS)
  • Predictive Emission Monitoring System (PEMS)

By Offering:

  • Hardware
  • Software
  • Services

By Industry:

  • Power Generation
  • Oil & Gas
  • Chemicals, Petrochemicals, Refineries, and Fertilizers
  • Building Materials
  • Pulp & Paper
  • Pharmaceuticals
  • Metals
  • Mining
  • Marine & Shipping
  • Waste Incineration

By Region

  • North America
    • US
    • Canada
    • Mexico
  • Europe
    • Germany
    • UK
    • France
    • Rest of Europe
  • Asia Pacific
    • China
    • Japan
    • India
    • South Korea
    • Rest of Asia Pacific
  • Rest of the World
    • GCC
    • South America
    • Rest of Middle East & Africa

Recent Developments

  • In November 2021, AMETEK. Inc. announced the acquisition of Alphasense Ltd, which is one of the leading providers of gas and particulate sensors for air quality applications. This acquisition will help the company to expand its existing sensor business.
  • In October 2021, ABB launched ABB Ability Genix Datalyzer, that helps in optimization of emission monitoring equipment. Further, it is a cloud-based data analytics solution, which is designed for industries such as cement, chemicals, steel, and power generation. The cloud-based modular application provides real-time status across a fleet of analyzers and plants.
  • In September 2021, Emerson Electric Co. launched the Rosemount XE10 CEMS. It is designed to help industrial plants meet increasingly strict environmental regulations and evolving sustainability demands.

Frequently Asked Questions (FAQ’s):

To speak to our analyst for a discussion on the above findings, click Speak to Analyst

TABLE OF CONTENTS
 
1 INTRODUCTION (Page No. - 29)
    1.1 STUDY OBJECTIVES 
    1.2 MARKET DEFINITION 
    1.3 INCLUSIONS AND EXCLUSIONS 
    1.4 MARKETS COVERED 
           FIGURE 1 EMISSION MONITORING SYSTEM MARKET SEGMENTATION
           1.4.1 REGIONAL SCOPE
           1.4.2 YEARS CONSIDERED
    1.5 CURRENCY CONSIDERED 
    1.6 UNITS CONSIDERED 
    1.7 STAKEHOLDERS 
    1.8 SUMMARY OF CHANGES 
    1.9 RECESSION IMPACT 
 
2 RESEARCH METHODOLOGY (Page No. - 34)
    2.1 RESEARCH DATA 
           FIGURE 2 EMISSION MONITORING SYSTEM MARKET: RESEARCH DESIGN
           2.1.1 SECONDARY AND PRIMARY RESEARCH
                    FIGURE 3 EMISSION MONITORING SYSTEM MARKET: RESEARCH APPROACH
           2.1.2 SECONDARY DATA
                    2.1.2.1 List of major secondary sources
                    2.1.2.2 Key data from secondary sources
           2.1.3 PRIMARY DATA
                    2.1.3.1 Primary interviews with experts
                    2.1.3.2 Key data from primary sources
                    2.1.3.3 Key industry insights
                    2.1.3.4 Breakdown of primaries
    2.2 MARKET SIZE ESTIMATION 
           2.2.1 TOP-DOWN APPROACH
                    2.2.1.1 Estimation of market size using top-down approach
                               FIGURE 4 EMISSION MONITORING SYSTEM MARKET: TOP-DOWN APPROACH
           2.2.2 BOTTOM-UP APPROACH
                    2.2.2.1 Estimation of market size using bottom-up approach
                               FIGURE 5 EMISSION MONITORING SYSTEM MARKET: BOTTOM-UP APPROACH
                               FIGURE 6 MARKET SIZE ESTIMATION METHODOLOGY: SUPPLY-SIDE ANALYSIS
    2.3 DATA TRIANGULATION 
           FIGURE 7 DATA TRIANGULATION
    2.4 RESEARCH ASSUMPTIONS 
           FIGURE 8 ASSUMPTIONS
    2.5 LIMITATIONS 
    2.6 PARAMETERS CONSIDERED TO ANALYZE IMPACT OF RECESSION ON EMISSION MONITORING SYSTEM MARKET 
    2.7 RISK ASSESSMENT 
           TABLE 1 RISK ANALYSIS
 
3 EXECUTIVE SUMMARY (Page No. - 46)
    FIGURE 9 EMISSION MONITORING SYSTEM MARKET, 2019–2028 (USD MILLION)
    FIGURE 10 PEMS SEGMENT TO REGISTER HIGHER CAGR DURING FORECAST PERIOD
    FIGURE 11 HARDWARE SEGMENT TO ACCOUNT FOR LARGEST MARKET SHARE FROM 2023 TO 2028
    FIGURE 12 POWER GENERATION SEGMENT TO ACCOUNT LARGEST MARKET SHARE FROM 2023 TO 2028
    FIGURE 13 ASIA PACIFIC TO DOMINATE GLOBAL EMISSION MONITORING SYSTEM MARKET DURING FORECAST PERIOD
 
4 PREMIUM INSIGHTS (Page No. - 50)
    4.1 ATTRACTIVE OPPORTUNITIES FOR PLAYERS IN EMISSION MONITORING SYSTEM MARKET 
           FIGURE 14 GROWING DEMAND FOR EMS IN CHEMICALS, PETROCHEMICALS, REFINERIES, AND FERTILIZERS INDUSTRIES TO DRIVE MARKET
    4.2 EMISSION MONITORING SYSTEM MARKET, BY SYSTEM TYPE 
           FIGURE 15 CEMS SEGMENT TO ACCOUNT FOR LARGER MARKET SHARE DURING FORECAST PERIOD
    4.3 EMISSION MONITORING SYSTEM MARKET, BY INDUSTRY 
           FIGURE 16 POWER GENERATION SEGMENT TO CAPTURE LARGEST MARKET SHARE DURING FORECAST PERIOD
    4.4 NORTH AMERICA: EMISSION MONITORING SYSTEM MARKET, BY INDUSTRY AND COUNTRY 
           FIGURE 17 POWER GENERATION INDUSTRY AND US TO HOLD LARGEST SHARE OF NORTH AMERICAN EMISSION MONITORING SYSTEM MARKET IN 2028
    4.5 EMISSION MONITORING SYSTEM MARKET, BY COUNTRY 
           FIGURE 18 INDIA TO EXHIBIT HIGHEST CAGR IN GLOBAL EMISSION MONITORING SYSTEM MARKET DURING FORECAST PERIOD
 
5 MARKET OVERVIEW (Page No. - 54)
    5.1 INTRODUCTION 
    5.2 MARKET DYNAMICS 
           FIGURE 19 GLOBAL EMS MARKET: DRIVERS, RESTRAINTS, OPPORTUNITIES, AND CHALLENGES
           5.2.1 DRIVERS
                    5.2.1.1 High reliance on coal-fired power plants to generate electricity worldwide
                    5.2.1.2 Growing focus on reducing hazardous gas emissions and environmental protection
                    5.2.1.3 Rising emphasis on ambient air quality monitoring
                               FIGURE 20 ANALYSIS OF IMPACT OF DRIVERS ON EMISSION MONITORING SYSTEM MARKET
           5.2.2 RESTRAINTS
                    5.2.2.1 High maintenance costs associated with emission monitoring systems
                               FIGURE 21 ANALYSIS OF IMPACT OF RESTRAINTS ON EMISSION MONITORING SYSTEM MARKET
           5.2.3 OPPORTUNITIES
                    5.2.3.1 Rise in number of petrochemical plants and refineries
                    5.2.3.2 Growing pharmaceuticals industry
                               FIGURE 22 ANALYSIS OF IMPACT OF OPPORTUNITIES ON EMISSION MONITORING SYSTEM MARKET
           5.2.4 CHALLENGES
                    5.2.4.1 Performance limitations of emission monitoring systems in harsh operating conditions
                               FIGURE 23 ANALYSIS OF IMPACT OF CHALLENGES ON EMISSION MONITORING SYSTEM MARKET
    5.3 VALUE CHAIN ANALYSIS 
           FIGURE 24 EMISSION MONITORING SYSTEM MARKET: VALUE CHAIN ANALYSIS
    5.4 ECOSYSTEM/MARKET MAP 
           FIGURE 25 EMISSION MONITORING SYSTEM MARKET: ECOSYSTEM ANALYSIS
           TABLE 2 EMISSION MONITORING SYSTEM MARKET: ROLE OF COMPANIES IN ECOSYSTEM
    5.5 PRICING ANALYSIS 
           5.5.1 AVERAGE SELLING PRICE TREND OF EMISSION MONITORING SYSTEMS
                    FIGURE 26 AVERAGE SELLING PRICE OF EMISSION MONITORING SYSTEMS, 2018–2022
           5.5.2 AVERAGE SELLING PRICE, BY KEY PLAYER
                    FIGURE 27 AVERAGE SELLING PRICE TREND OF GAS ANALYZERS OFFERED BY KEY PLAYERS
                    TABLE 3 AVERAGE SELLING PRICE OF GAS ANALYZERS OFFERED BY KEY PLAYERS
           5.5.3 AVERAGE SELLING PRICE TREND, BY REGION
                    TABLE 4 AVERAGE SELLING PRICE OF EMISSION MONITORING SYSTEMS, BY REGION
    5.6 TRENDS/DISRUPTIONS IMPACTING CUSTOMER BUSINESS 
           FIGURE 28 TRENDS/DISRUPTIONS IMPACTING CUSTOMER BUSINESS
    5.7 TECHNOLOGY ANALYSIS 
           5.7.1 BIG DATA ANALYTICS
           5.7.2 EDGE AND DIAGNOSTICS ANALYTICS
    5.8 PORTER’S FIVE FORCES ANALYSIS 
           FIGURE 29 EMISSION MONITORING SYSTEM MARKET: PORTER’S FIVE FORCES ANALYSIS
           TABLE 5 EMISSION MONITORING SYSTEM MARKET: IMPACT OF PORTER’S FIVE FORCES
           5.8.1 BARGAINING POWER OF SUPPLIERS
           5.8.2 BARGAINING POWER OF BUYERS
           5.8.3 THREAT OF NEW ENTRANTS
           5.8.4 THREAT OF SUBSTITUTES
           5.8.5 INTENSITY OF COMPETITIVE RIVALRY
    5.9 KEY STAKEHOLDERS AND BUYING CRITERIA 
           5.9.1 KEY STAKEHOLDERS IN BUYING PROCESS
                    FIGURE 30 INFLUENCE OF STAKEHOLDERS ON BUYING PROCESS FOR TOP 3 INDUSTRIES
                    TABLE 6 INFLUENCE OF STAKEHOLDERS ON BUYING PROCESS, BY INDUSTRY
           5.9.2 BUYING CRITERIA
                    FIGURE 31 KEY BUYING CRITERIA FOR TOP 3 INDUSTRIES
                    TABLE 7 KEY BUYING CRITERIA FOR TOP 3 INDUSTRIES
    5.10 CASE STUDY ANALYSIS 
           TABLE 8 TEXTILE MANUFACTURER IN SURAT INSTALLED CEMS TO REDUCE EMISSIONS
           TABLE 9 GENERAL ELECTRIC INSTALLED CEMS TO TRACK EMISSION LEVELS OF POWER PLANTS
           TABLE 10 INSTALLATION OF CEMS IN TAIWAN TO CURB HEALTH ISSUES
    5.11 TRADE ANALYSIS 
           5.11.1 IMPORT SCENARIO
                    FIGURE 32 IMPORT DATA FOR HS CODE 9027-COMPLIANT PRODUCTS, BY COUNTRY, 2018–2022 (USD MILLION)
           5.11.2 EXPORT SCENARIO
                    FIGURE 33 EXPORT DATA FOR HS CODE 9027-COMPLIANT PRODUCTS, BY COUNTRY, 2018–2022 (USD MILLION)
    5.12 PATENT ANALYSIS 
           FIGURE 34 TOP 10 COMPANIES WITH HIGHEST NUMBER OF PATENT APPLICATIONS IN LAST 10 YEARS
           TABLE 11 TOP 20 PATENT OWNERS IN US, 2013–2022
           FIGURE 35 NUMBER OF PATENTS GRANTED PER YEAR, 2013–2022
           TABLE 12 LIST OF MAJOR PATENTS PERTAINING TO EMISSION MONITORING SYSTEM MARKET, 2021–2023
    5.13 KEY CONFERENCES & EVENTS, 2023–2024 
           TABLE 13 DETAILED LIST OF CONFERENCES & EVENTS IN EMISSION MONITORING SYSTEM MARKET
    5.14 REGULATORY LANDSCAPE 
           5.14.1 REGULATORY BODIES, GOVERNMENT AGENCIES, AND OTHER ORGANIZATIONS
                    TABLE 14 NORTH AMERICA: LIST OF REGULATORY BODIES, GOVERNMENT AGENCIES, AND OTHER ORGANIZATIONS
                    TABLE 15 EUROPE: LIST OF REGULATORY BODIES, GOVERNMENT AGENCIES, AND OTHER ORGANIZATIONS
                    TABLE 16 ASIA PACIFIC: LIST OF REGULATORY BODIES, GOVERNMENT AGENCIES, AND OTHER ORGANIZATIONS
                    TABLE 17 ROW: LIST OF REGULATORY BODIES, GOVERNMENT AGENCIES, AND OTHER ORGANIZATIONS
           5.14.2 STANDARDS AND REGULATIONS
                    TABLE 18 EMISSION MONITORING SYSTEM MARKET: STANDARDS AND REGULATIONS
 
6 TYPES OF EMISSIONS (Page No. - 77)
    6.1 INTRODUCTION 
    6.2 OXYGEN 
    6.3 CARBON MONOXIDE 
    6.4 CARBON DIOXIDE 
    6.5 AMMONIA 
    6.6 HYDROGEN SULFIDE 
    6.7 NITROGEN OXIDE 
    6.8 HYDROCARBONS 
 
7 EMISSION MONITORING SYSTEM MARKET, BY OFFERING (Page No. - 79)
    7.1 INTRODUCTION 
           FIGURE 36 EMISSION MONITORING SYSTEM MARKET, BY OFFERING
           FIGURE 37 HARDWARE SEGMENT TO ACCOUNT FOR LARGEST MARKET SHARE MARKET FROM 2023 TO 2028
           TABLE 19 EMISSION MONITORING SYSTEM MARKET, BY OFFERING, 2019–2022 (USD MILLION)
           TABLE 20 EMISSION MONITORING SYSTEM MARKET, BY OFFERING, 2023–2028 (USD MILLION)
    7.2 HARDWARE 
           7.2.1 INCREASING REGULATIONS FOR POLLUTION MONITORING TO BOOST ADOPTION OF RELIABLE EMS HARDWARE COMPONENTS
                    7.2.1.1 Gas analyzers
                    7.2.1.2 Gas sampling systems
                    7.2.1.3 Flow and opacity monitors
                    7.2.1.4 Sample probes
                    7.2.1.5 Sample lines
                    7.2.1.6 Data controllers
                    7.2.1.7 Filters
                               TABLE 21 HARDWARE: EMISSION MONITORING SYSTEM MARKET, BY SYSTEM TYPE, 2019–2022 (USD MILLION)
                               TABLE 22 HARDWARE: EMISSION MONITORING SYSTEM MARKET, BY SYSTEM TYPE, 2023–2028 (USD MILLION)
    7.3 SOFTWARE 
           7.3.1 NEED TO ANALYZE EMISSION TRENDS TO BOOST ADOPTION OF EMS SOFTWARE
                    TABLE 23 SOFTWARE: EMISSION MONITORING SYSTEM MARKET, BY SYSTEM TYPE, 2019–2022 (USD MILLION)
                    TABLE 24 SOFTWARE: EMISSION MONITORING SYSTEM MARKET, BY SYSTEM TYPE, 2023–2028 (USD MILLION)
    7.4 SERVICES 
           7.4.1 NEED ENSURE OPTIMUM OPERATING CONDITION OF SYSTEMS TO DRIVE DEMAND FOR MAINTENANCE SERVICES
                    7.4.1.1 Installation
                    7.4.1.2 Training
                    7.4.1.3 Maintenance
                               TABLE 25 SERVICES: EMISSION MONITORING SYSTEM MARKET, BY SYSTEM TYPE, 2019–2022 (USD MILLION)
                               TABLE 26 SERVICES: EMISSION MONITORING SYSTEM MARKET, BY SYSTEM TYPE, 2023–2028 (USD MILLION)
 
8 EMISSION MONITORING SYSTEM MARKET, BY SYSTEM TYPE (Page No. - 86)
    8.1 INTRODUCTION 
           FIGURE 38 EMISSION MONITORING SYSTEM MARKET, BY SYSTEM TYPE
           FIGURE 39 CEMS SEGMENT TO HOLD LARGER MARKET SHARE IN 2028
           TABLE 27 EMISSION MONITORING SYSTEM MARKET, BY SYSTEM TYPE, 2019–2022 (USD MILLION)
           TABLE 28 EMISSION MONITORING SYSTEM MARKET, BY SYSTEM TYPE, 2023–2028 (USD MILLION)
           TABLE 29 EMISSION MONITORING SYSTEM MARKET, BY SYSTEM TYPE, 2019–2022 (UNITS)
           TABLE 30 EMISSION MONITORING SYSTEM MARKET, BY SYSTEM TYPE, 2023–2028 (UNITS)
    8.2 CONTINUOUS EMISSION MONITORING SYSTEM (CEMS) 
           8.2.1 NEED TO COMPLY WITH AIR QUALITY STANDARDS TO DRIVE ADOPTION OF CEMS
                    TABLE 31 CEMS: EMISSION MONITORING SYSTEM MARKET, BY OFFERING, 2019–2022 (USD MILLION)
                    TABLE 32 CEMS: EMISSION MONITORING SYSTEM MARKET, BY OFFERING, 2023–2028 (USD MILLION)
                    TABLE 33 CEMS: EMISSION MONITORING SYSTEM MARKET, BY INDUSTRY, 2019–2022 (USD MILLION)
                    TABLE 34 CEMS: EMISSION MONITORING SYSTEM MARKET, BY INDUSTRY, 2023–2028 (USD MILLION)
                    TABLE 35 CEMS: EMISSION MONITORING SYSTEM MARKET, BY REGION, 2019–2022 (USD MILLION)
                    TABLE 36 CEMS: EMISSION MONITORING SYSTEM MARKET, BY REGION, 2023–2028 (USD MILLION)
    8.3 PREDICTIVE EMISSION MONITORING SYSTEM (PEMS) 
           8.3.1 GROWING NEED FOR ACCURATE AND RELIABLE EMISSION MONITORING SYSTEMS TO BOOST SEGMENTAL GROWTH
                    TABLE 37 PEMS: EMISSION MONITORING SYSTEM MARKET, BY OFFERING, 2019–2022 (USD MILLION)
                    TABLE 38 PEMS: EMISSION MONITORING SYSTEM MARKET, BY OFFERING, 2023–2028 (USD MILLION)
                    TABLE 39 PEMS: EMISSION MONITORING SYSTEM MARKET, BY INDUSTRY, 2019–2022 (USD MILLION)
                    TABLE 40 PEMS: EMISSION MONITORING SYSTEM MARKET, BY INDUSTRY, 2023–2028 (USD MILLION)
                    TABLE 41 PEMS: EMISSION MONITORING SYSTEM MARKET, BY REGION, 2019–2022 (USD MILLION)
                    TABLE 42 PEMS: EMISSION MONITORING SYSTEM MARKET, BY REGION, 2023–2028 (USD MILLION)
 
9 EMISSION MONITORING SYSTEM MARKET, BY INDUSTRY (Page No. - 95)
    9.1 INTRODUCTION 
           FIGURE 40 EMISSION MONITORING SYSTEM MARKET, BY INDUSTRY
           FIGURE 41 POWER GENERATION INDUSTRY TO LEAD EMS MARKET THROUGHOUT FORECAST PERIOD
           TABLE 43 EMISSION MONITORING SYSTEM MARKET, BY INDUSTRY, 2019–2022 (USD MILLION)
           TABLE 44 EMISSION MONITORING SYSTEM MARKET, BY INDUSTRY, 2023–2028 (USD MILLION)
    9.2 POWER GENERATION 
           9.2.1 LARGE USAGE OF COAL IN POWER GENERATION INDUSTRY TO NECESSITATE ADOPTION OF EMISSION MONITORING SYSTEMS
                    TABLE 45 POWER GENERATION: EMISSION MONITORING SYSTEM MARKET, BY SYSTEM TYPE, 2019–2022 (USD MILLION)
                    TABLE 46 POWER GENERATION: EMISSION MONITORING SYSTEM MARKET, BY SYSTEM TYPE, 2023–2028 (USD MILLION)
                    TABLE 47 POWER GENERATION: EMISSION MONITORING SYSTEM MARKET, BY REGION, 2019–2022 (USD MILLION)
                    TABLE 48 POWER GENERATION: EMISSION MONITORING SYSTEM MARKET, BY REGION, 2023–2028 (USD MILLION)
    9.3 OIL & GAS 
           9.3.1 HIGH METHANE EMISSION FROM OIL & GAS INDUSTRY TO DRIVE DEMAND FOR EMS
                    TABLE 49 OIL & GAS: EMISSION MONITORING SYSTEM MARKET, BY SYSTEM TYPE, 2019–2022 (USD MILLION)
                    TABLE 50 OIL & GAS: EMISSION MONITORING SYSTEM MARKET, BY SYSTEM TYPE, 2023–2028 (USD MILLION)
                    TABLE 51 OIL & GAS: EMISSION MONITORING SYSTEM MARKET, BY REGION, 2019–2022 (USD MILLION)
                    TABLE 52 OIL & GAS: EMISSION MONITORING SYSTEM MARKET, BY REGION, 2023–2028 (USD MILLION)
    9.4 CHEMICALS, PETROCHEMICALS, REFINERIES, AND FERTILIZERS 
           9.4.1 RISING CONCERNS TO LIMIT GREENHOUSE GAS EMISSIONS TO DRIVE MARKET
                    TABLE 53 CHEMICALS, PETROCHEMICALS, REFINERIES, AND FERTILIZERS: EMISSION MONITORING SYSTEM MARKET, BY SYSTEM TYPE, 2019–2022 (USD MILLION)
                    TABLE 54 CHEMICALS, PETROCHEMICALS, REFINERIES, AND FERTILIZERS: EMISSION MONITORING SYSTEM MARKET, BY SYSTEM TYPE, 2023–2028 (USD MILLION)
                    TABLE 55 CHEMICALS, PETROCHEMICALS, REFINERIES, AND FERTILIZERS: EMISSION MONITORING SYSTEM MARKET, BY REGION, 2019–2022 (USD MILLION)
                    TABLE 56 CHEMICALS, PETROCHEMICALS, REFINERIES, AND FERTILIZERS: EMISSION MONITORING SYSTEM MARKET, BY REGION, 2023–2028 (USD MILLION)
    9.5 BUILDING MATERIALS 
           9.5.1 NEED TO OPTIMIZE CEMENT PRODUCTION PROCESSES AND REDUCE EMISSIONS TO BOOST ADOPTION OF CEMS
                    TABLE 57 BUILDING MATERIALS: EMISSION MONITORING SYSTEM MARKET, BY SYSTEM TYPE, 2019–2022 (USD MILLION)
                    TABLE 58 BUILDING MATERIALS: EMISSION MONITORING SYSTEM MARKET, BY SYSTEM TYPE, 2023–2028 (USD MILLION)
                    TABLE 59 BUILDING MATERIALS: EMISSION MONITORING SYSTEM MARKET, BY REGION, 2019–2022 (USD MILLION)
                    TABLE 60 BUILDING MATERIALS: EMISSION MONITORING SYSTEM MARKET, BY REGION, 2023–2028 (USD MILLION)
    9.6 PULP & PAPER 
           9.6.1 NEED TO REDUCE CARBON FOOTPRINT AND HARMFUL EMISSIONS TO BOOST ADOPTION OF EMS
                    TABLE 61 PULP & PAPER: EMISSION MONITORING SYSTEM MARKET, BY SYSTEM TYPE, 2019–2022 (USD MILLION)
                    TABLE 62 PULP & PAPER: EMISSION MONITORING SYSTEM MARKET, BY SYSTEM TYPE, 2023–2028 (USD MILLION)
                    TABLE 63 PULP & PAPER: EMISSION MONITORING SYSTEM MARKET, BY REGION, 2019–2022 (USD MILLION)
                    TABLE 64 PULP & PAPER: EMISSION MONITORING SYSTEM MARKET, BY REGION, 2023–2028 (USD MILLION)
    9.7 PHARMACEUTICALS 
           9.7.1 FOCUS ON REDUCTION OF CARBON FOOTPRINT TO ACCELERATE ADOPTION OF EMS
                    TABLE 65 PHARMACEUTICALS: EMISSION MONITORING SYSTEM MARKET, BY SYSTEM TYPE, 2019–2022 (USD MILLION)
                    TABLE 66 PHARMACEUTICALS: EMISSION MONITORING SYSTEM MARKET, BY SYSTEM TYPE, 2023–2028 (USD MILLION)
                    TABLE 67 PHARMACEUTICALS: EMISSION MONITORING SYSTEM MARKET, BY REGION, 2019–2022 (USD MILLION)
                    TABLE 68 PHARMACEUTICALS: EMISSION MONITORING SYSTEM MARKET, BY REGION, 2023–2028 (USD MILLION)
    9.8 METALS 
           9.8.1 GROWING DOWNSTREAM INDUSTRIES TO FUEL DEMAND FOR EMS
                    TABLE 69 METALS: EMISSION MONITORING SYSTEM MARKET, BY SYSTEM TYPE, 2019–2022 (USD MILLION)
                    TABLE 70 METALS: EMISSION MONITORING SYSTEM MARKET, BY SYSTEM TYPE, 2023–2028 (USD MILLION)
                    TABLE 71 METALS: EMISSION MONITORING SYSTEM MARKET, BY REGION, 2019–2022 (USD MILLION)
                    TABLE 72 METALS: EMISSION MONITORING SYSTEM MARKET, BY REGION, 2023–2028 (USD MILLION)
    9.9 MINING 
           9.9.1 REQUIREMENT FOR DETECTION OF HAZARDOUS GASES IN MINES FOR SAFETY PURPOSES TO DRIVE MARKET
                    TABLE 73 MINING: EMISSION MONITORING SYSTEM MARKET, BY SYSTEM TYPE, 2019–2022 (USD MILLION)
                    TABLE 74 MINING: EMISSION MONITORING SYSTEM MARKET, BY SYSTEM TYPE, 2023–2028 (USD MILLION)
                    TABLE 75 MINING: EMISSION MONITORING SYSTEM MARKET, BY REGION, 2019–2022 (USD MILLION)
                    TABLE 76 MINING: EMISSION MONITORING SYSTEM MARKET, BY REGION, 2023–2028 (USD MILLION)
    9.1 MARINE & SHIPPING 
           9.10.1 RISING ADOPTION OF POLICIES AND REGULATIONS TO REDUCE CO2 EMISSIONS TO CONTRIBUTE TO MARKET GROWTH
                    TABLE 77 MARINE & SHIPPING: EMISSION MONITORING SYSTEM MARKET, BY SYSTEM TYPE, 2019–2022 (USD MILLION)
                    TABLE 78 MARINE & SHIPPING: EMISSION MONITORING SYSTEM MARKET, BY SYSTEM TYPE, 2023–2028 (USD MILLION)
                    TABLE 79 MARINE & SHIPPING: EMISSION MONITORING SYSTEM MARKET, BY REGION, 2019–2022 (USD MILLION)
                    TABLE 80 MARINE & SHIPPING: EMISSION MONITORING SYSTEM MARKET, BY REGION, 2023–2028 (USD MILLION)
    9.11 WASTE INCINERATION 
           9.11.1 INCREASING WASTE GENERATION OWING TO RISING POPULATION TO DRIVE ADOPTION OF EMS
                     TABLE 81 WASTE INCINERATION: EMISSION MONITORING SYSTEM MARKET, BY SYSTEM TYPE, 2019–2022 (USD MILLION)
                    TABLE 82 WASTE INCINERATION: EMISSION MONITORING SYSTEM MARKET, BY SYSTEM TYPE, 2023–2028 (USD MILLION)
                    TABLE 83 WASTE INCINERATION: EMISSION MONITORING SYSTEM MARKET, BY REGION, 2019–2022 (USD MILLION)
                    TABLE 84 WASTE INCINERATION: EMISSION MONITORING SYSTEM MARKET, BY REGION, 2023–2028 (USD MILLION)
 
10 EMISSION MONITORING SYSTEM MARKET, BY REGION (Page No. - 116)
     10.1 INTRODUCTION 
             FIGURE 42 EMISSION MONITORING SYSTEM MARKET, BY REGION
             FIGURE 43 INDIA TO EXHIBIT HIGHEST CAGR DURING FORECAST PERIOD
             TABLE 85 EMISSION MONITORING SYSTEM MARKET, BY REGION, 2019–2022 (USD MILLION)
             TABLE 86 EMISSION MONITORING SYSTEM MARKET, BY REGION, 2023–2028 (USD MILLION)
     10.2 NORTH AMERICA 
             10.2.1 NORTH AMERICA: RECESSION IMPACT
                        FIGURE 44 NORTH AMERICA: EMISSION MONITORING SYSTEM MARKET SNAPSHOT
                        FIGURE 45 US TO ACCOUNT FOR LARGEST SHARE OF NORTH AMERICAN MARKET DURING FORECAST PERIOD
                        TABLE 87 NORTH AMERICA: EMISSION MONITORING SYSTEM MARKET, BY COUNTRY, 2019–2022 (USD MILLION)
                        TABLE 88 NORTH AMERICA: EMISSION MONITORING SYSTEM MARKET, BY COUNTRY, 2023–2028 (USD MILLION)
                        TABLE 89 NORTH AMERICA: EMISSION MONITORING SYSTEM MARKET, BY SYSTEM TYPE, 2019–2022 (USD MILLION)
                        TABLE 90 NORTH AMERICA: EMISSION MONITORING SYSTEM MARKET, BY SYSTEM TYPE, 2023–2028 (USD MILLION)
                        TABLE 91 NORTH AMERICA: EMISSION MONITORING SYSTEM MARKET, BY INDUSTRY, 2019–2022 (USD MILLION)
                        TABLE 92 NORTH AMERICA: EMISSION MONITORING SYSTEM MARKET, BY INDUSTRY, 2023–2028 (USD MILLION)
             10.2.2 US
                        10.2.2.1 Presence of several end-user industries to drive market
             10.2.3 CANADA
                        10.2.3.1 Demand from power generation and petrochemicals industries to support market growth
             10.2.4 MEXICO
                        10.2.4.1 Presence of coal-fired power plants to propel market
     10.3 EUROPE 
             10.3.1 EUROPE: RECESSION IMPACT
                        FIGURE 46 EUROPE: EMISSION MONITORING SYSTEM MARKET SNAPSHOT
                        FIGURE 47 GERMANY TO EXHIBIT HIGHEST CAGR IN EUROPEAN EMISSION MONITORING SYSTEM MARKET DURING FORECAST PERIOD
                        TABLE 93 EUROPE: EMISSION MONITORING SYSTEM MARKET, BY COUNTRY, 2019–2022 (USD MILLION)
                        TABLE 94 EUROPE: EMISSION MONITORING SYSTEM MARKET, BY COUNTRY, 2023–2028 (USD MILLION)
                        TABLE 95 EUROPE: EMISSION MONITORING SYSTEM MARKET, BY SYSTEM TYPE, 2019–2022 (USD MILLION)
                        TABLE 96 EUROPE: EMISSION MONITORING SYSTEM MARKET, BY SYSTEM TYPE, 2023–2028 (USD MILLION)
                        TABLE 97 EUROPE: EMISSION MONITORING SYSTEM MARKET, BY INDUSTRY, 2019–2022 (USD MILLION)
                        TABLE 98 EUROPE: EMISSION MONITORING SYSTEM MARKET, BY INDUSTRY, 2023–2028 (USD MILLION)
             10.3.2 UK
                        10.3.2.1 Thriving cement industry to foster market growth
             10.3.3 GERMANY
                        10.3.3.1 Focus on achieving zero pollution to boost demand for emission monitoring systems
             10.3.4 FRANCE
                        10.3.4.1 Flourishing chemicals industry to spur market growth
             10.3.5 REST OF EUROPE
     10.4 ASIA PACIFIC 
             10.4.1 ASIA PACIFIC: RECESSION IMPACT
                        FIGURE 48 ASIA PACIFIC: EMISSION MONITORING SYSTEM MARKET SNAPSHOT
                        FIGURE 49 CHINA TO COMMAND LARGEST SHARE OF ASIA PACIFIC EMISSION MONITORING SYSTEM MARKET DURING FORECAST PERIOD
                        TABLE 99 ASIA PACIFIC: EMISSION MONITORING SYSTEM MARKET, BY COUNTRY, 2019–2022 (USD MILLION)
                        TABLE 100 ASIA PACIFIC: EMISSION MONITORING SYSTEM MARKET, BY COUNTRY, 2023–2028 (USD MILLION)
                        TABLE 101 ASIA PACIFIC: EMISSION MONITORING SYSTEM MARKET, BY SYSTEM TYPE, 2019–2022 (USD MILLION)
                        TABLE 102 ASIA PACIFIC: EMISSION MONITORING SYSTEM MARKET, BY SYSTEM TYPE, 2023–2028 (USD MILLION)
                        TABLE 103 ASIA PACIFIC: EMISSION MONITORING SYSTEM MARKET, BY INDUSTRY, 2019–2022 (USD MILLION)
                        TABLE 104 ASIA PACIFIC: EMISSION MONITORING SYSTEM MARKET, BY INDUSTRY, 2023–2028 (USD MILLION)
             10.4.2 CHINA
                        10.4.2.1 Focus on low carbon emission policies
             10.4.3 JAPAN
                        10.4.3.1 Prominent presence of cement and chemicals industry players to favor market growth
             10.4.4 SOUTH KOREA
                        10.4.4.1 Rising health concerns to drive demand for EMS
             10.4.5 INDIA
                        10.4.5.1 Surging steel production to create demand for EMS
             10.4.6 REST OF ASIA PACIFIC
     10.5 REST OF THE WORLD 
             10.5.1 ROW: RECESSION IMPACT
                        FIGURE 50 GCC TO DOMINATE ROW MARKET FROM 2023 TO 2028
                        TABLE 105 ROW: EMISSION MONITORING SYSTEM MARKET, BY REGION, 2019–2022 (USD MILLION)
                        TABLE 106 ROW: EMISSION MONITORING SYSTEM MARKET, BY REGION, 2023–2028 (USD MILLION)
                        TABLE 107 ROW: EMISSION MONITORING SYSTEM MARKET, BY SYSTEM TYPE, 2019–2022 (USD MILLION)
                        TABLE 108 ROW: EMISSION MONITORING SYSTEM MARKET, BY SYSTEM TYPE, 2023–2028 (USD MILLION)
                        TABLE 109 ROW: EMISSION MONITORING SYSTEM MARKET, BY INDUSTRY, 2019–2022 (USD MILLION)
                        TABLE 110 ROW: EMISSION MONITORING SYSTEM MARKET, BY INDUSTRY, 2023–2028 (USD MILLION)
             10.5.2 GCC
                        10.5.2.1 Strong presence of oil & gas industry players to propel market
             10.5.3 SOUTH AMERICA
                        10.5.3.1 Growing emphasis on reduction of greenhouse gas emissions to fuel adoption of EMS
             10.5.4 REST OF MIDDLE EAST & AFRICA
 
11 COMPETITIVE LANDSCAPE (Page No. - 140)
     11.1 INTRODUCTION 
     11.2 STRATEGIES ADOPTED BY KEY PLAYERS 
             TABLE 111 OVERVIEW OF STRATEGIES ADOPTED BY KEY PLAYERS
     11.3 TOP FIVE COMPANY REVENUE ANALYSIS 
             FIGURE 51 EMISSION MONITORING SYSTEM MARKET: REVENUE ANALYSIS OF TOP FIVE PLAYERS, 2018–2022
     11.4 MARKET SHARE ANALYSIS 
             TABLE 112 EMISSION MONITORING SYSTEM MARKET: DEGREE OF COMPETITION, 2022
             FIGURE 52 INDUSTRY CONCENTRATION, 2022
     11.5 COMPANY EVALUATION MATRIX 
             11.5.1 STARS
             11.5.2 EMERGING LEADERS
             11.5.3 PERVASIVE PLAYERS
             11.5.4 PARTICIPANTS
                        FIGURE 53 EMISSION MONITORING SYSTEM MARKET: COMPANY EVALUATION MATRIX, 2022
             11.5.5 COMPANY FOOTPRINT
                        TABLE 113 OVERALL COMPANY FOOTPRINT
                        TABLE 114 APPLICATION: COMPANY FOOTPRINT
                        TABLE 115 REGIONAL: COMPANY FOOTPRINT
     11.6 STARTUP/SME EVALUATION MATRIX 
             11.6.1 PROGRESSIVE COMPANIES
             11.6.2 RESPONSIVE COMPANIES
             11.6.3 DYNAMIC COMPANIES
             11.6.4 STARTING BLOCKS
                        FIGURE 54 EMISSION MONITORING SYSTEM MARKET: STARTUP/SME EVALUATION MATRIX, 2022
             11.6.5 COMPETITIVE BENCHMARKING
                        TABLE 116 EMISSION MONITORING SYSTEM MARKET: DETAILED LIST OF KEY STARTUPS/SMES
                        TABLE 117 EMISSION MONITORING SYSTEM MARKET: COMPETITIVE BENCHMARKING OF KEY STARTUPS/SMES
     11.7 COMPETITIVE SCENARIOS AND TRENDS 
             11.7.1 EMISSION MONITORING SYSTEM MARKET: PRODUCT LAUNCHES
             11.7.2 EMISSION MONITORING SYSTEM MARKET: DEALS
 
12 COMPANY PROFILES (Page No. - 157)
(Business Overview, Products Offered, Recent Developments, and MnM View (Key strengths/Right to Win, Strategic Choices Made, and Weaknesses and Competitive Threats))*  
     12.1 KEY PLAYERS 
             12.1.1 ABB
                        TABLE 118 ABB: COMPANY OVERVIEW
                        FIGURE 55 ABB: COMPANY SNAPSHOT
                        TABLE 119 ABB: PRODUCTS OFFERED
                        TABLE 120 ABB: PRODUCT LAUNCHES
             12.1.2 AMETEK. INC.
                        TABLE 121 AMETEK. INC.: COMPANY OVERVIEW
                        FIGURE 56 AMETEK. INC.: COMPANY SNAPSHOT
                        TABLE 122 AMETEK. INC.: PRODUCTS OFFERED
                        TABLE 123 AMETEK. INC.: PRODUCT LAUNCHES
                        TABLE 124 AMETEK. INC.: DEALS
             12.1.3 EMERSON ELECTRIC CO.
                        TABLE 125 EMERSON ELECTRIC CO.: COMPANY OVERVIEW
                        FIGURE 57 EMERSON ELECTRIC CO.: COMPANY SNAPSHOT
                        TABLE 126 EMERSON ELECTRIC CO.: PRODUCTS OFFERED
                        TABLE 127 EMERSON ELECTRIC CO.: PRODUCT LAUNCHES
             12.1.4 SIEMENS
                        TABLE 128 SIEMENS: COMPANY OVERVIEW
                        FIGURE 58 SIEMENS: COMPANY SNAPSHOT
                        TABLE 129 SIEMENS: PRODUCTS OFFERED
                        TABLE 130 SIEMENS: DEALS
             12.1.5 THERMO FISHER SCIENTIFIC INC.
                        TABLE 131 THERMO FISHER SCIENTIFIC INC.: COMPANY OVERVIEW
                        FIGURE 59 THERMO FISHER SCIENTIFIC INC.: COMPANY SNAPSHOT
                        TABLE 132 THERMO FISHER SCIENTIFIC INC.: PRODUCTS OFFERED
             12.1.6 BAKER HUGHES COMPANY
                        TABLE 133 BAKER HUGHES COMPANY: COMPANY OVERVIEW
                        FIGURE 60 BAKER HUGHES COMPANY: COMPANY SNAPSHOT
                        TABLE 134 BAKER HUGHES COMPANY: PRODUCTS OFFERED
             12.1.7 FUJI ELECTRIC CO., LTD.
                        TABLE 135 FUJI ELECTRIC CO., LTD.: COMPANY OVERVIEW
                        FIGURE 61 FUJI ELECTRIC CO., LTD.: COMPANY SNAPSHOT
                        TABLE 136 FUJI ELECTRIC CO., LTD.: PRODUCTS OFFERED
             12.1.8 HONEYWELL INTERNATIONAL INC.
                        TABLE 137 HONEYWELL INTERNATIONAL INC.: COMPANY OVERVIEW
                        FIGURE 62 HONEYWELL INTERNATIONAL INC.: COMPANY SNAPSHOT
                        TABLE 138 HONEYWELL INTERNATIONAL INC.: PRODUCTS OFFERED
             12.1.9 HORIBA, LTD.
                        TABLE 139 HORIBA, LTD.: COMPANY OVERVIEW
                        FIGURE 63 HORIBA, LTD.: COMPANY SNAPSHOT
                        TABLE 140 HORIBA, LTD.: PRODUCTS OFFERED
                        TABLE 141 HORIBA, LTD.: DEALS
             12.1.10 SICK AG
                        TABLE 142 SICK AG: COMPANY OVERVIEW
                        FIGURE 64 SICK AG: COMPANY SNAPSHOT
                        TABLE 143 SICK AG: PRODUCTS OFFERED
             12.1.11 SPECTRIS
                        TABLE 144 SPECTRIS: COMPANY OVERVIEW
                        FIGURE 65 SPECTRIS: COMPANY SNAPSHOT
                        TABLE 145 SPECTRIS: PRODUCTS OFFERED
                        TABLE 146 SPECTRIS: PRODUCT LAUNCHES
             12.1.12 TELEDYNE TECHNOLOGIES INCORPORATED
                        TABLE 147 TELEDYNE TECHNOLOGIES INCORPORATED: COMPANY OVERVIEW
                        FIGURE 66 TELEDYNE TECHNOLOGIES INCORPORATED: COMPANY SNAPSHOT
                        TABLE 148 TELEDYNE TECHNOLOGIES INCORPORATED: PRODUCTS OFFERED
                        TABLE 149 TELEDYNE TECHNOLOGIES INCORPORATED: DEALS
     12.2 OTHER PLAYERS 
             12.2.1 ACOEM
             12.2.2 CHEMTROLS INDUSTRIES PVT. LTD.
             12.2.3 CISCO
             12.2.4 DURAG GROUP
             12.2.5 ENVEA
             12.2.6 GASMET TECHNOLOGIES OY
             12.2.7 HANGZHOU CHUNLAI TECHNOLOGY CO., LTD.
             12.2.8 OPSIS AB
             12.2.9 PROTEA LTD
             12.2.10 TECNOVA HT SRL
             12.2.11 TRACE
             12.2.12 TSI
*Details on Business Overview, Products Offered, Recent Developments, and MnM View (Key strengths/Right to Win, Strategic Choices Made, and Weaknesses and Competitive Threats) might not be captured in case of unlisted companies.  
 
13 ADJACENT AND RELATED MARKETS (Page No. - 206)
     13.1 INTRODUCTION 
     13.2 SMART SENSORS MARKET, BY TECHNOLOGY 
             13.2.1 INTRODUCTION
                        TABLE 150 SMART SENSORS MARKET, BY TECHNOLOGY, 2018–2021 (USD BILLION)
                        TABLE 151 SMART SENSORS MARKET, BY TECHNOLOGY, 2022–2027 (USD BILLION)
             13.2.2 MAJOR PACKAGING TYPES CONSIDERED IN SMART SENSORS MARKET
                        TABLE 152 TECHNICAL FEATURES OF SYSTEM-IN-PACKAGE (SIP) AND SYSTEM-ON-CHIP (SOC)
             13.2.3 MEMS TECHNOLOGY
                        13.2.3.1 Increasing adoption of MEMS technology-based smart sensors in various process industries to boost market growth
                                     TABLE 153 MEMS TECHNOLOGY: SMART SENSORS MARKET, BY TYPE, 2018–2021 (USD MILLION)
                                     TABLE 154 MEMS TECHNOLOGY: SMART SENSORS MARKET, BY TYPE, 2022–2027 (USD MILLION)
             13.2.4 CMOS TECHNOLOGY
                        13.2.4.1 Characteristics such as low static power consumption and high noise immunity to drive demand for CMOS technology
                                     TABLE 155 CMOS TECHNOLOGY: SMART SENSORS MARKET, BY TYPE, 2018–2021 (USD MILLION)
                                     TABLE 156 CMOS TECHNOLOGY: SMART SENSORS MARKET, BY TYPE, 2022–2027 (USD MILLION)
 
14 APPENDIX (Page No. - 213)
     14.1 INSIGHTS FROM INDUSTRY EXPERTS 
     14.2 DISCUSSION GUIDE 
     14.3 KNOWLEDGESTORE: MARKETSANDMARKETS’ SUBSCRIPTION PORTAL 
     14.4 CUSTOMIZATION OPTIONS 
     14.5 RELATED REPORTS 
     14.6 AUTHOR DETAILS 


The study involved four major activities in estimating the current size of the emission monitoring system market. Exhaustive secondary research has been done to collect information on the market, peer, and parent markets. The next step has been to validate these findings, assumptions, and sizing with industry experts across the value chain through primary research. Both top-down and bottom-up approaches have been employed to estimate the total market size. After that, market breakdown and data triangulation methods were used to estimate the market size of segments and subsegments. Two sources of information—secondary and primary—have been used to identify and collect information for an extensive technical and commercial study of the emission monitoring system market.

Secondary Research

Secondary sources include company websites, magazines, industry news, associations, and databases (Factiva and Bloomberg). These secondary sources include annual reports, press releases, investor presentations of companies, white papers, certified publications, articles by recognized authors, regulatory bodies, trade directories, and databases.

Primary Research

Primary sources mainly consist of several experts from the core and related industries, along with preferred emission monitoring system providers, distributors, alliances, standards, and certification organizations related to various segments of this industry’s value chain.

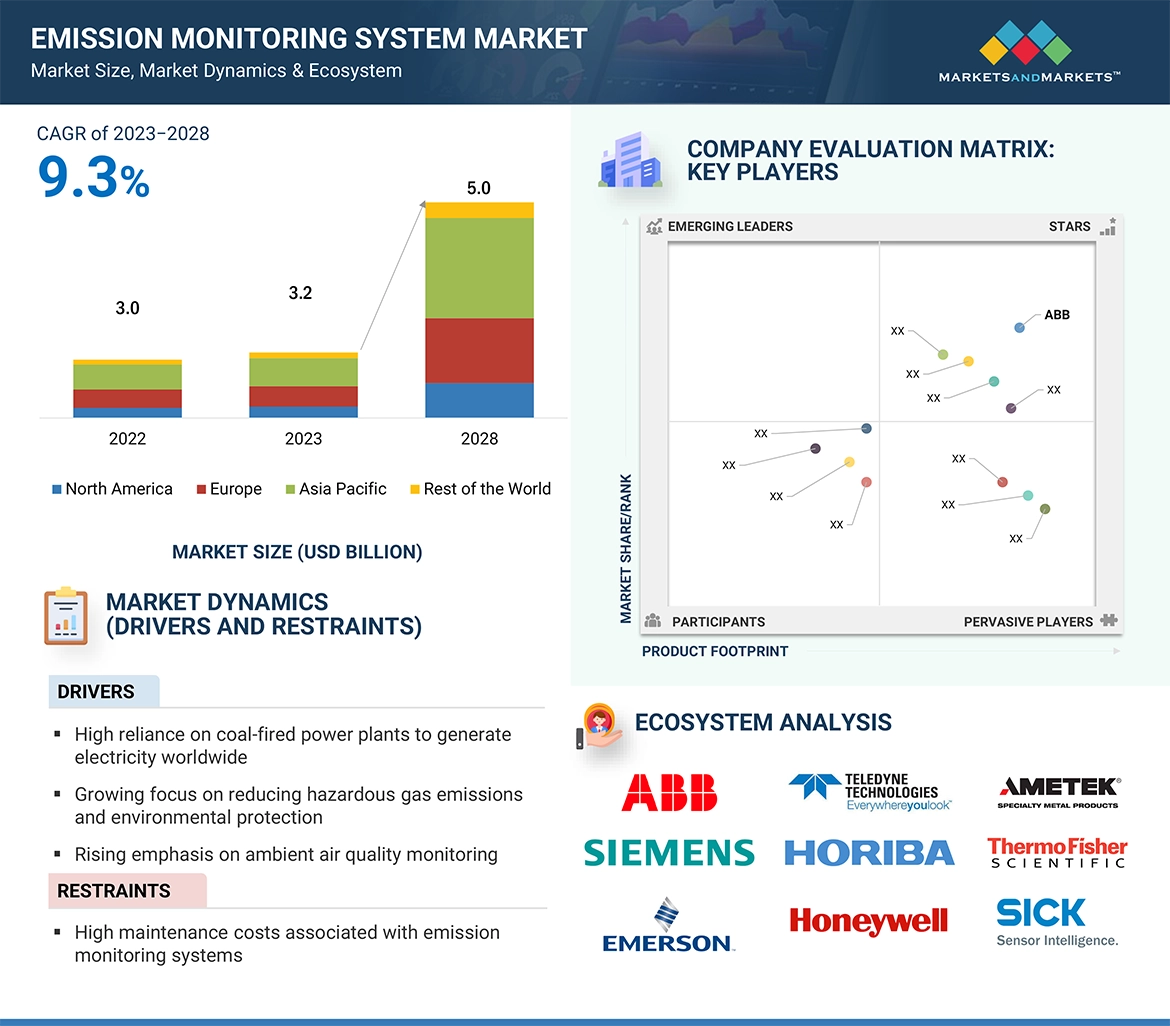
In the primary research process, various primary sources from both the supply and demand sides were interviewed to obtain qualitative and quantitative information on the market. The primary sources from the supply side included various industry experts such as Chief Experience Officers (CXOs), Vice Presidents (VPs), and Directors from business development, marketing, product development/innovation teams, and related key executives from emission monitoring system providers, such as ABB (Switzerland), AMETEK. Inc. (US), Emerson Electric Co. (US), Siemens (Germany), and Thermo Fisher Scientific Inc. (US); research organizations, distributors, industry associations, and key opinion leaders. Following is the breakdown of primary respondents.

Emission Monitoring System Market Size, and Share

To know about the assumptions considered for the study, download the pdf brochure

Market Size Estimation

Both top-down and bottom-up approaches have been used to estimate and validate the total size of the emission monitoring system market. These methods have also been used extensively to estimate the size of various subsegments in the market. The following research methodology has been used to estimate the market size:

  • Major players in the industry and markets have been identified through extensive secondary research.
  • The industry’s value chain and market size (in terms of value) have been determined through primary and secondary research processes.
  • All percentage shares, splits, and breakdowns have been determined using secondary sources and verified through primary sources.

Top-down Approach

In the top-down approach, the overall market size has been used to estimate the size of the individual market segments (mentioned in market segmentation) through percentage splits from secondary and primary research. For specific market segments, the size of the most appropriate immediate parent market has been used to implement the top-down approach. The bottom-up approach has also been implemented for data obtained from secondary research to validate the market size of various segments.

Emission Monitoring System Market: Top-down Approach

Emission Monitoring System Market Size, and Top-down Approach

Bottom-Up Approach

The bottom-up approach has been used to arrive at the overall size of the emission monitoring system market from the revenues of the key players and their market shares. Calculations based on revenues of key companies identified in the market led to the estimation of their overall market size.

Emission Monitoring System Market: Bottom-up Approach

Emission Monitoring System Market Size, and Bottom-Up Approach

Data Triangulation

After arriving at the overall market size from the estimation process explained above, the overall market has been split into several segments and subsegments. The market breakdown and data triangulation procedures have been employed, wherever applicable, to complete the overall market engineering process and arrive at the exact statistics for all segments and subsegments. The data has been triangulated by studying various factors and trends from both the demand and supply sides. The market has also been validated using both top-down and bottom-up approaches.

Market Definition

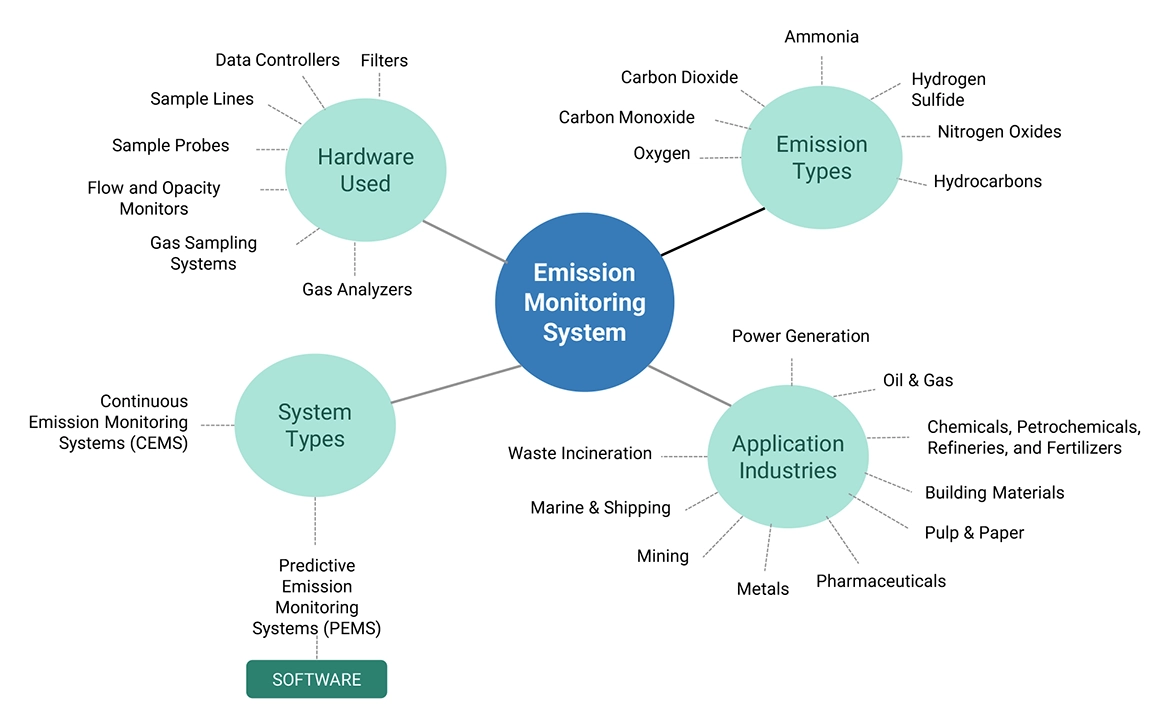
An emission monitoring system (EMS) determines the concentrations of toxic gases or particulate matter emitted during industrial operations. It is used in industries such as power generation, oil & gas, pharmaceuticals, and chemicals. Emission monitoring systems should comply with emission standards imposed by organizations such as the United States Environmental Protection Agency (US EPA).

Key Stakeholders

  • Component manufacturers
  • Distributors and traders
  • End-user industries such as power generation, pharmaceuticals, and oil & gas
  • Government and research organizations
  • Original equipment manufacturers
  • EMS manufacturers and suppliers
  • Research institutions and organizations

Research Objectives

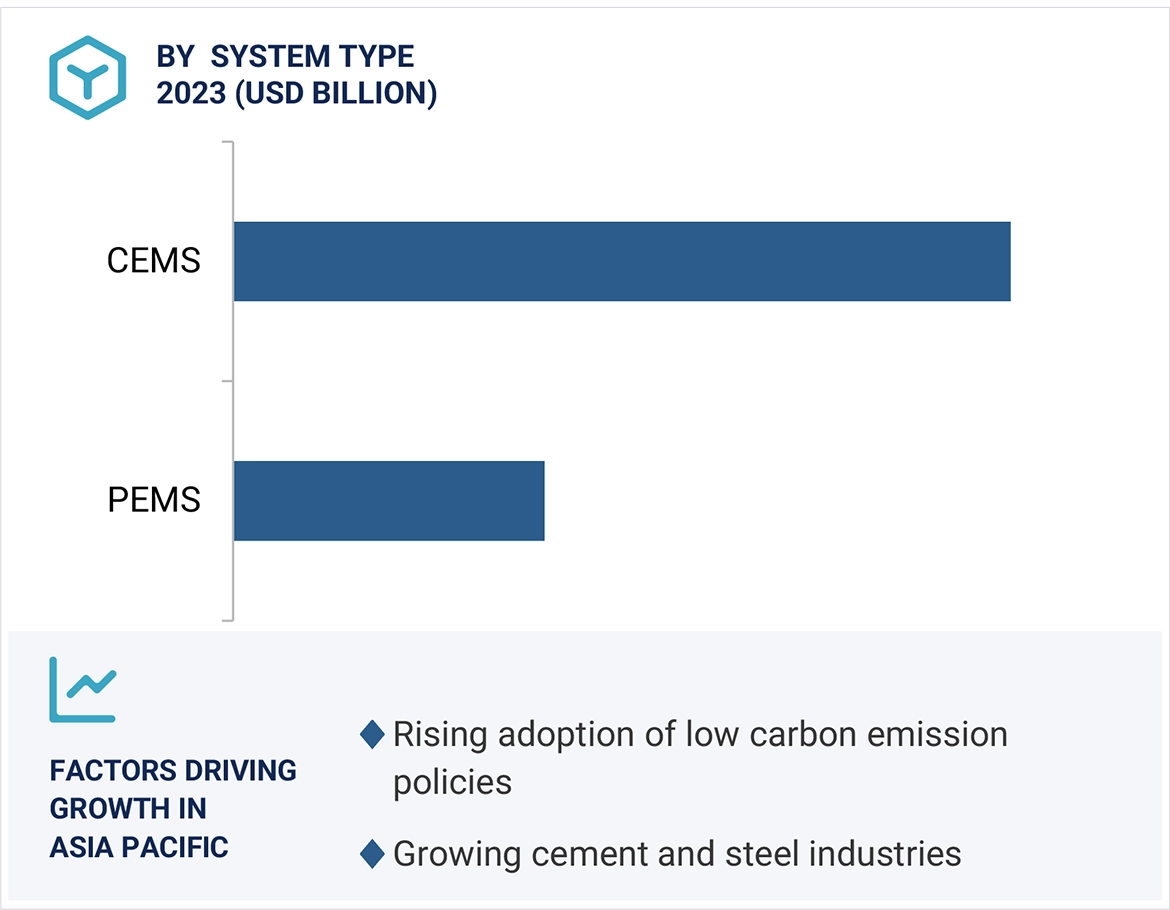
  • To define and forecast the emission monitoring system market regarding offering,  system type, and industry.
  • To describe and forecast the emission monitoring system market and its value segments for four regions—North America, Europe, Asia Pacific, and the Rest of the World (RoW), along with their respective countries.
  • To provide detailed information regarding the drivers, restraints, opportunities, and challenges influencing the growth of the market
  • To strategically analyze micro-markets concerning individual growth trends, prospects, and contributions to the overall market
  • To study the complete value chain of the emission monitoring system market
  • To analyze opportunities in the market for stakeholders by identifying high-growth segments of the market
  • To strategically profile key players and comprehensively analyze their market position regarding ranking and core competencies, along with a detailed market competitive landscape.
  • To analyze strategic approaches such as agreements, collaborations, and partnerships in the emission monitoring system market
  • To provide an analysis of the recession impact on the growth of the market and its segments

Available Customizations:

Based on the given market data, MarketsandMarkets offers customizations in the reports according to the client’s specific requirements. The available customization options are as follows:

Company Information

  • Detailed analysis and profiling of additional market players (up to 5)
Custom Market Research Services

We will customize the research for you, in case the report listed above does not meet with your exact requirements. Our custom research will comprehensively cover the business information you require to help you arrive at strategic and profitable business decisions.

Request Customization

Instant Answers with GPT - Ask Now!

Ask real questions. Get complete answers !
Report Code
SE 3919
Published ON
Nov, 2023
Choose License Type
BUY NOW
  • SHARE
X
Request Customization
Speak to Analyst
Speak to Analyst
OR FACE-TO-FACE MEETING
PERSONALIZE THIS RESEARCH
  • Triangulate with your Own Data
  • Get Data as per your Format and Definition
  • Gain a Deeper Dive on a Specific Application, Geography, Customer or Competitor
  • Any level of Personalization
REQUEST A FREE CUSTOMIZATION
LET US HELP YOU!
  • What are the Known and Unknown Adjacencies Impacting the Emission Monitoring System Market
  • What will your New Revenue Sources be?
  • Who will be your Top Customer; what will make them switch?
  • Defend your Market Share or Win Competitors
  • Get a Scorecard for Target Partners
CUSTOMIZED WORKSHOP REQUEST
+1-888-600-6441
  • Call Us
  • +1-888-600-6441 (Corporate office hours)
  • +1-888-600-6441 (US/Can toll free)
  • +44-800-368-9399 (UK office hours)
CONNECT WITH US
ABOUT TRUST ONLINE
©2024 MarketsandMarkets Research Private Ltd. All rights reserved
DMCA.com Protection Status Website Feedback