Synthetic Monitoring Market by Monitoring Type (API Monitoring, SAAS Application, Mobile Application, and Web Application), Service (Managed and Professional), Deployment, Organization Size, Vertical - Global Forecast to 2021


[172 Pages Report] The synthetic monitoring market size is estimated to grow from USD 919.2 Million in 2016 to USD 2,109.7 Million by 2021, at a CAGR of 18.1% from 2016 to 2021.
Objectives of the Study:
The main objective of this report is to define, describe, and forecast the global synthetic monitoring market on the basis of components which includes monitoring types and associated services which include professional services such as business consulting services, implementation services, and training and support services. It is also segmented on the basis of deployment types, organization sizes, verticals, and regions. The report provides detailed information regarding the major factors influencing the growth of the market (drivers, restraints, opportunities, and industry-specific challenges). The report attempts to forecast the market size with respect to five main regions, namely, North America, Europe, Asia-Pacific (APAC), Middle East and Africa (MEA), and Latin America. The report strategically profiles key players and comprehensively analyzes their core competencies. This report also tracks and analyzes competitive developments such as joint ventures, Mergers and Acquisitions (M&A), new product developments, and Research & Development (R&D) activities in the market.
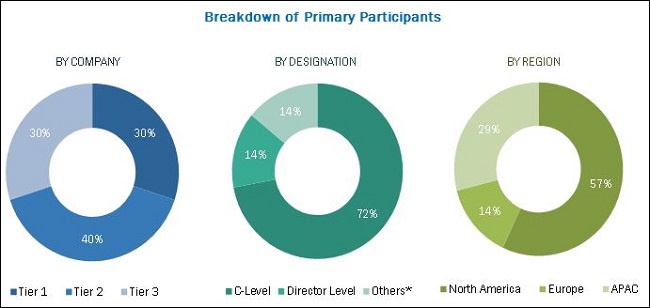
The research methodology used to estimate and forecast the market begins with collection and analysis of data on key vendor revenues through secondary research such as annual reports and press releases, investor presentations of companies, conferences and associations such as Monitorama, an open source monitoring conference, Mobile World Congress, International Conference on Performance Engineering (ICPE), white papers, technology journals, certified publications, and articles from recognized authors, directories, and databases. The vendor offerings have also been taken into consideration to determine the market segmentation. The bottom-up procedure was employed to arrive at the total market size of the global synthetic monitoring market from the revenue of the key synthetic monitoring service providers and monitoring-as-a-service providers in the market. After arriving at the overall market size, the total market was split into several segments and sub-segments, which were then verified through primary research by conducting extensive interviews with key people, such as CEOs, VPs, directors, and executives. The data triangulation and market breakdown procedures were employed to complete the overall market engineering process and to arrive at the exact statistics for all segments and subsegments. The breakdown of profiles of primary is depicted in the below figure:
To know about the assumptions considered for the study, download the pdf brochure
The synthetic monitoring ecosystem comprises vendors providing synthetic monitoring solutions and services to their commercial clients. Companies such as CA Technologies Inc. (U.S.), BMC Software Inc. (U.S.), IBM Corporation (U.S.), Dell Technologies, Inc. (U.S.), Dynatrace (U.S.), Microsoft Corporation (U.S.), Hewlett-Packard Enterprise (U.S.), and many others have adopted new product launches as their key strategy to enhance their market reach. This strategy accounted for the largest share of the total strategies adopted by the market players.
Key Target Audience
- Network Service Providers
- Application Developers
- Cloud Service Providers
- Third-Party System Integrators
- Monitoring-as-a-Service Providers
- Hardware Vendors
- Regulatory Agencies
- Government
�Study answers several questions for the stakeholders, primarily which market segments to focus in next two to five years for prioritizing the efforts and investments�.
Scope of the Report
The research report segments the synthetic monitoring market into the following submarkets:
By Monitoring Type:
- API Monitoring
- SaaS Application Monitoring
- Mobile Application Monitoring
- Web Application Monitoring
By Professional Service Type:
- Business Consulting Services
- Implementation Services
- Training and Support Services
By Deployment Type:
- Hosted
- On premise
By Organization Size:
- SME�s
- Large Enterprises
By Verticals:
- BFSI
- Government & Defense
- IT & Telecom
- Healthcare
- Retail
- Automotive, Transportation and Logistics
- Media and Entertainment
- Others
By Region:
- North America
- Europe
- Asia-Pacific (APAC)
- Middle East and Africa (MEA)
- Latin America
Available Customizations
With the given market data, MarketsandMarkets offers customizations as per the company�s specific needs. The following customization options are available for the report:
Geographic Analysis
- Further breakdown of the North America synthetic monitoring market
- Further breakdown of the Europe market
- Further breakdown of the APAC market
Company Information
- Detailed analysis and profiling of additional market players
MarketsandMarkets forecasts the synthetic monitoring market size to grow from USD 919.2 Million in 2016 to USD 2,109.7 Million by 2021, at a Compound Annual Growth Rate (CAGR) of 18.1%.
Synthetic monitoring process is instrumental in methodically and proactively monitor the network and application performance using external agents, which intimates the actual end users and web traffic, using which simulation test is carried out to automate transactions against web applications, user behavior, and monitor and manage performance accordingly. Synthetic Monitoring sends a constant stream of synthesized traffic to a website or application, ensuring the availability and reliable performance benchmarks of the respective application or web site.
Synthetic monitoring offers enhanced end user experience by proactively detecting application performance issues, helping to quantify the business of commercial clients. It is a more active process than Real User Monitoring (RUM) and focuses majorly on the availability and reliability of applications. Synthetic monitoring service providers offer this enhanced real-time monitoring-as-a-service to their commercial clients for managing web and associated application performance.
The scope of this report covers the synthetic monitoring market by component, service, deployment type, organization size, vertical, and region. The business consulting services segment is expected to dominate the market, at the highest CAGR during the forecast period as it deals with the transformation of ideas into solutions and infrastructure by providing advanced monitoring and management solutions to applications. Most of the synthetic monitoring and management service providers offer business consulting services to identify the risks and vulnerabilities in the current system infrastructure, monitor the entire system performance, and help in effectively troubleshooting them.
The Software as a Service (SaaS) application monitoring type of synthetic monitoring market is estimated to grow at the highest rate during the forecast period as it actively monitors and troubleshoots end user experience for both web and SaaS applications, supporting both on-premises and cloud SaaS deployment. Furthermore, it also measure, monitors, and manages the performance, availability, and usage of all SaaS applications deployed across the enterprise or commercial customer site.
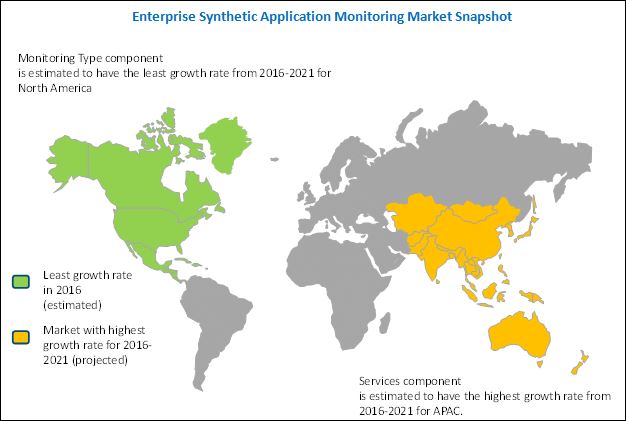
North America is expected to account for the largest market share in the market, followed by Europe in 2016. Due to the critical need for pro-active monitoring of increasing complex applications and rising adoption of cloud-based SaaS application and DevOps application is increasing the adoption of synthetic application monitoring.
The synthetic monitoring market is growing rapidly and is used for monitoring static backend systems into next-generation solutions to check dynamic customer application and to improve the performance and availability of the application. These next-generation monitoring solutions are deriving meaningful intelligence directly from the application that they monitor, which businesses can turn into actionable results that better serve customers, and improve business performance and operations. However, the lack of end user awareness in managing complex applications and using the traditional approach of monitoring and managing applications to gain visibility and performance benchmark is restraining the market.
There are several established players in this market such as CA Technologies Inc. (U.S.), BMC Software Inc. (U.S.), IBM Corporation (U.S.), Dell Technologies, Inc. (U.S.), Dynatrace (U.S.), and others. To further strengthen their position in the market, the major vendors have opted to strengthen their product portfolio by launching new products and services.
To speak to our analyst for a discussion on the above findings, click Speak to Analyst
 Exclusive indicates content/data unique to MarketsandMarkets and not available with any competitors.
Table of Contents
1 Introduction (Page No. - 16)
1.1 Objectives of the Study
1.2 Market Definition
1.3 Market Scope
1.3.1 Markets Covered
1.3.2 Years Considered for the Study
1.4 Currency
1.5 Limitations
1.6 Stakeholders
2 Research Methodology (Page No. - 20)
2.1 Research Data
2.1.1 Secondary Data
2.1.1.1 Key Data From Secondary Sources
2.1.2 Primary Data
2.1.2.1 Key Data From Primary Sources
2.1.2.2 Key Industry Insights
2.1.2.3 Breakdown of Primary Interviews
2.2 Market Size Estimation
2.3 Market Breakdown and Data Triangulation
2.4 MnM Dive Vendor Comparision Methodology
2.5 Matrix Description
2.6 Assumptions
3 Executive Summary (Page No. - 32)
4 Premium Insights (Page No. - 37)
4.1 Attractive Market Opportunities in the Market
4.2 Market Top Three Verticals
4.3 Market By Region and Monitoring Type
4.4 Synthetic Monitoring Market
4.5 Lifecycle Analysis, By Region, 2016
5 Market Overview (Page No. - 41)
5.1 Market Segmentation
5.1.1 By Component
5.1.2 By Monitoring Type
5.1.3 By Service Type
5.1.4 By Professional Service
5.1.5 By Deployment Type
5.1.6 By Organization Size
5.1.7 By Vertical
5.1.8 By Region
5.2 Market Dynamics
5.2.1 Drivers
5.2.1.1 Microservices Driving the Development of Applications
5.2.1.2 Critical Need for Pro-Active Monitoring and Management of Increasing Complex Applications
5.2.1.3 Importance of Devops
5.2.1.4 Sla Parameters Evaluation
5.2.1.5 Ease of Deployment: as A Browser Add-On Or an Easily Downloadable Application
5.2.2 Opportunities
5.2.2.1 Customer Experience Management
5.2.2.2 Data-Driven Decision Making and Predictive Analytics
5.2.2.3 Advancement in Application Delivery and Advent of Software Defined Age
5.2.3 Restraints
5.2.3.1 False Positives and Incorrect Alerts
5.2.4 Challenges
5.2.4.1 Lack of Skill Set and Expertise
5.2.4.2 Lack of Pro-Active and Real-Time Application Visibility
5.2.4.3 Monitoring on Emulators
6 Industry Trends (Page No. - 52)
6.1 Introduction
6.2 Value Chain Analysis
6.3 Strategic Benchmarking
7 Synthetic Monitoring Market Analysis, By Component (Page No. - 54)
7.1 Introduction
7.2 Monitoring Type
7.3 Services
8 Synthetic Monitoring Market Analysis, By Monitoring Type (Page No. - 58)
8.1 Introduction
8.2 API Monitoring
8.3 SaaS Application Monitoring
8.4 Mobile Application Monitoring
8.5 Web Application Monitoring
9 Synthetic Monitoring Analysis, By Service (Page No. - 65)
9.1 Introduction
9.2 Managed Services
9.3 Professional Services
10 Synthetic Monitoring Analysis, By Professional Service Type (Page No. - 70)
10.1 Introduction
10.2 Business Consulting Services
10.3 Implementation Services
10.4 Training and Support Services
11 Synthetic Monitoring Market Analysis, By Organization Size (Page No. - 75)
11.1 Introduction
11.2 Small and Medium Enterprises
11.3 Large Enterprises
12 Synthetic Monitoring Market Analysis, By Deployment Type (Page No. - 80)
12.1 Introduction
12.2 Hosted
12.3 On-Premises
13 Synthetic Monitoring Market Analysis, By Vertical (Page No. - 85)
13.1 Introduction
13.2 Banking, Financial Services, and Insurance
13.3 Government and Defense
13.4 IT and Telecom
13.5 Healthcare
13.6 Retail
13.7 Automotive, Transportation, and Logistics
13.8 Media and Entertainment
13.9 Others
14 Geographic Analysis (Page No. - 97)
14.1 Introduction
14.2 North America
14.3 Europe
14.4 Asia-Pacific
14.5 Middle East and Africa
14.6 Latin America
15 Competitive Landscape (Page No. - 115)
15.1 Overview
15.2 Competitive Situation and Trends
15.2.1 New Product Launches
15.2.2 Partnerships, Agreements, and Collaborations
15.2.3 Mergers and Acquisitions
15.3 MnM Dive: Synthetic Monitoring Vendor Scorecard
15.4 MnM View
16 Company Profiles (Page No. - 125)
(Business Overview, Products & Services, Key Insights, Recent Developments, SWOT Analysis, MnM View)*
16.1 Introduction
16.2 CA Technologies Inc.
16.3 BMC Software Inc.
16.4 International Business Machines (IBM) Corporation
16.5 Dell Technologies, Inc.
16.6 Dynatrace
16.7 Microsoft Corporation
16.8 Hewlett Packard Enterprise
16.9 Appdynamics, Inc.
16.10 New Relic, Inc.
16.11 Riverbed Technology
16.12 Splunk, Inc.
*Details on Business Overview, Products & Services, Key Insights, Recent Developments, SWOT Analysis, MnM View Might Not Be Captured in Case of Unlisted Companies.
17 Key Innovators (Page No. - 155)
17.1 Netscout Systems Inc.
17.1.1 Business Overview
17.2 Solarwinds
17.2.1 Business Overview
17.3 Smartbear Software
17.3.1 Business Overview
17.4 Catchpoint Systems, Inc.
17.4.1 Business Overview
17.5 Rigor
17.5.1 Business Overview
17.6 Appneta
17.6.1 Business Overview
18 Appendix (Page No. - 161)
18.1 Industry Experts
18.2 Recent Developments
18.3 Discussion Guide
18.4 Knowledge Store: Marketsandmarkets� Subscription Portal
18.5 Related Reports
18.6 Author Details
List of Tables (76 Tables)
Table 1 Synthetic Monitoring Market Size and Growth Rate, 2014�2021 (USD Million, Y-O-Y %)
Table 2 Market Size, By Component, 2014�2021 (USD Million)
Table 3 Market Size, By Component, 2014�2021 (USD Million)
Table 4 Monitoring Type: Market Size, By Region, 2014�2021 (USD Million)
Table 5 Services: Market Size, By Region, 2014�2021 (USD Million)
Table 6 Market Size, By Monitoring Type 2014�2021 (USD Million)
Table 7 API Monitoring: Market Size, By Region, 2014�2021 (USD Million)
Table 8 SaaS Application Monitoring: Market Size, By Region, 2014�2021 (USD Million)
Table 9 Mobile Application Monitoring: Market Size, By Region, 2014�2021 (USD Million)
Table 10 Web Application Monitoring: Market Size, By Region, 2014�2021 (USD Million)
Table 11 Market Size, By Service, 2014�2021 (USD Million)
Table 12 Managed Services: Market Size, By Region, 2014�2021 (USD Million)
Table 13 Professional Services: Market Size, By Region, 2014�2021 (USD Million)
Table 14 Synthetic Monitoring Market Size, By Professional Service Type, 2014�2021 (USD Million)
Table 15 Business Consulting Services: Market Size, By Region, 2014�2021 (USD Million)
Table 16 Implementation Services: Market Size, By Region, 2014�2021 (USD Million)
Table 17 Training and Support Services: Market Size, By Region, 2014�2021 (USD Million)
Table 18 Market Size, By Organization Size, 2014�2021 (USD Million)
Table 19 Small and Medium Enterprises: Market Size, By Region, 2014�2021 (USD Million)
Table 20 Large Enterprises: Market Size, By Region, 2014�2021 (USD Million)
Table 21 Market Size, By Deployment Type, 2014�2021 (USD Million)
Table 22 Hosted: Market Size, By Region, 2014�2021 (USD Million)
Table 23 On-Premises: Market Size, By Region, 2014�2021 (USD Million)
Table 24 Synthetic Monitoring Market Size, By Vertical, 2014�2021 (USD Million)
Table 25 Banking, Financial Services, and Insurance: Market Size, By Region, 2014�2021 (USD Million)
Table 26 Banking, Financial Services, and Insurance: Market Size, By Component, 2014�2021 (USD Million)
Table 27 Government and Defense: Market Size, By Region, 2014�2021 (USD Million)
Table 28 Government and Defense: Market Size, By Component, 2014�2021 (USD Million)
Table 29 IT and Telecom: Market Size, By Region, 2014�2021 (USD Million)
Table 30 IT and Telecom: Market Size, By Component, 2014�2021 (USD Million)
Table 31 Healthcare: Market Size, By Region, 2014�2021 (USD Million)
Table 32 Healthcare: Market Size, By Component, 2014�2021 (USD Million)
Table 33 Retail: Market Size, By Region, 2014�2021 (USD Million)
Table 34 Retail: Market Size, By Component, 2014�2021 (USD Million)
Table 35 Automotive, Transportation, and Logistics: Market Size, By Region, 2014�2021 (USD Million)
Table 36 Automotive, Transportation, and Logistics: Market Size, By Component, 2014�2021 (USD Million)
Table 37 Media and Entertainment: Market Size, By Region, 2014�2021 (USD Million)
Table 38 Media and Entertainment: Market Size, By Component, 2014�2021 (USD Million)
Table 39 Others: Market Size, By Region, 2014�2021 (USD Million)
Table 40 Others: Market Size, By Component, 2014�2021 (USD Million)
Table 41 Synthetic Monitoring Market Size, By Region, 2014�2021 (USD Million)
Table 42 North America: Market Size, By Component, 2014�2021 (USD Million)
Table 43 North America: Market Size, By Monitoring Type, 2014�2021 (USD Million)
Table 44 North America: Market Size, By Service, 2014�2021 (USD Million)
Table 45 North America: Market Size, By Professional Service, 2014�2021 (USD Million)
Table 46 North America: Market Size, By Deployment Type, 2014�2021 (USD Million)
Table 47 North America: Market Size, By Organization Size, 2014�2021 (USD Million)
Table 48 Europe: Market Size, By Component, 2014�2021 (USD Million)
Table 49 Europe: Market Size, By Monitoring Type, 2014�2021 (USD Million)
Table 50 Europe: Market Size, By Service, 2014�2021 (USD Million)
Table 51 Europe: Market Size, By Professional Service, 2014�2021 (USD Million)
Table 52 Europe: Market Size, By Deployment Type, 2014�2021 (USD Million)
Table 53 Europe: Market Size, By Organization Size, 2014�2021 (USD Million)
Table 54 Asia-Pacific: Market Size, Y Component, 2014�2021 (USD Million)
Table 55 Asia-Pacific: Market Size, By Monitoring Type, 2014�2021 (USD Million)
Table 56 Asia-Pacific: Market Size, By Service, 2014�2021 (USD Million)
Table 57 Asia-Pacific: Market Size, By Professional Service, 2014�2021 (USD Million)
Table 58 Asia-Pacific: Market Size, By Deployment Type, 2014�2021 (USD Million)
Table 59 Asia-Pacific: Market Size, By Organization Size, 2014�2021 (USD Million)
Table 60 Middle East and Africa: Synthetic Monitoring Market Size, By Component, 2014�2021 (USD Million)
Table 61 Middle East and Africa: Market Size, By Monitoring Type, 2014�2021 (USD Million)
Table 62 Middle East and Africa: Market Size, By Service, 2014�2021 (USD Million)
Table 63 Middle East and Africa: Market Size, By Professional Service, 2014�2021 (USD Million)
Table 64 Middle East and Africa: Market Size, By Deployment Type, 2014�2021 (USD Million)
Table 65 Middle East and Africa: Market Size, By Organization Size, 2014�2021 (USD Million)
Table 66 Latin America: Market Size, By Component, 2014�2021 (USD Million)
Table 67 Latin America: Market Size, By Monitoring Type, 2014�2021 (USD Million)
Table 68 Latin America: Market Size, By Service, 2014�2021 (USD Million)
Table 69 Latin America: Market Size, By Professional Service, 2014�2021 (USD Million)
Table 70 Latin America: Market Size, By Deployment Type, 2014�2021 (USD Million)
Table 71 Latin America: Synthetic Monitoring Market Size, By Organization Size, 2014�2021 (USD Million)
Table 72 New Product Launches, 2016
Table 73 Partnerships, Agreements, and Collaborations, 2016
Table 74 Mergers and Acquisitions, 2015�2016
Table 75 New Product Launches, 2014�2016
Table 76 Partnerships, Agreements, and Contracts, 2014�2016
List of Figures (58 Figures)
Figure 1 Markets Covered
Figure 2 Synthetic Monitoring Market: Research Design
Figure 3 Market Size Estimation Methodology: Bottom-Up Approach
Figure 4 Market Size Estimation Methodology: Top-Down Approach
Figure 5 Data Triangulation
Figure 6 Component Snapshot (2016�2021): Market for Synthetic Monitoring is Expected to Grow Twofold During the Forecast Period
Figure 7 Regional Snapshot (2016�2021): North America is Expected to Dominate the Market
Figure 8 Vertical Market Snapshot (2016�2021): Retail Market is Expected to Dominate the Market
Figure 9 North America is Estimated to Hold the Largest Market Share in 2016
Figure 10 Rising Importance of Dev-Ops and SaaS Application Deployments for Enhanced Application Visibility and Performance is Driving the Synthetic Monitoring Market
Figure 11 IT & Telecom; Automotive, Transportation, & Logistics; and Healthcare Verticals are Expected to Grow at Impressive Rates During the Forecast Period
Figure 12 North America is Expected to Hold the Largest Market Share in the Synthetic Monitoring Market
Figure 13 Asia-Pacific is Expected to Grow at the Highest CAGR During the Forecast Period
Figure 14 Regional Lifecycle: Asia-Pacific Along With Middle East and Africa Offer Multiple Unexplored Investment Arena
Figure 15 Synthetic Monitoring: Market Segmentation
Figure 16 Market Segmentation By Component
Figure 17 Market Segmentation By Monitoring Type
Figure 18 Market Segmentation By Service Type
Figure 19 Market Segmentation By Professional Service
Figure 20 Market Segmentation By Deployment Type
Figure 21 Market Segmentation By Organization Size
Figure 22 Market Segmentation By Vertical
Figure 23 Market Segmentation By Region
Figure 24 Market Drivers, Restraints, Opportunities, and Challenges
Figure 25 Synthetic Monitoring Market: Value Chain Analysis
Figure 26 Strategic Benchmarking: New Product Launch, 2014�2016
Figure 27 Monitoring Type Segment is Expected to Lead the Market
Figure 28 The Market Size of Software as A Service-Based Application Monitoring is Expected to Increase Twofold From 2016 to 2021
Figure 29 Asia-Pacific is Expected to Grow at the Highest CAGR During the Forecast Period
Figure 30 Professional Services Segment is Expected to Exhibit the Largest Market Size in the Synthetic Monitoring Market During the Forecast Period
Figure 31 North America is Expected to Exhibit the Largest Market Size in the Managed Services Segment During the Forecast Period
Figure 32 Business Consulting Services Segment is Expected to Grow at an Impressive Rate During the Forecast Period
Figure 33 Asia-Pacific Region is Expected to Forecast the Highest CAGR During the Forecast Period
Figure 34 Large Enterprises Segment is Expected to Exhibit Higher CAGR in the Market During the Forecast Period
Figure 35 Europe Region is Expected to Forecast the Highest Growth Rate During the Forecast Period
Figure 36 Hosted Deployment Type is Expected to Exhibit Higher CAGR in the Market During the Forecast Period
Figure 37 Hosted Deployment Market Size of North America is Expected to Double By 2021
Figure 38 Retail Vertical is Expected to Gain the Largest Market Size By 2021
Figure 39 Asia-Pacific is Expected to Grow at the Highest CAGR During the Forecast Period
Figure 40 Market Size for North America in the Retail Sector is Expected to Double By 2021
Figure 41 Asia-Pacific is Expected to Exhibit the Highest CAGR in the Market
Figure 42 Geographic Snapshot: Asia-Pacific and Middle East and Africa are Emerging as New Hotspots
Figure 43 Services Component in North America is Expected to Exhibit the Highest Growth Rate in the Synthetic Monitoring Market
Figure 44 North America Market Snapshot
Figure 45 Asia-Pacific Market Snapshot
Figure 46 Monitoring Type Component of the Asia-Pacific Region is Going to Face Significant Traction During the Forecast Period
Figure 47 Companies Adopted New Product Developments as the Key Growth Strategy During the Period 2014�2016
Figure 48 Companies Adopted New Product Launches and Partnerships, Agreements, and Collaborations as the Key Strategies During the Period 2014�2016
Figure 49 Battle for Market Share: New Product Launches is the Key Strategy Adopted By Synthetic Monitoring Vendors During the Period 2014�2016
Figure 50 Evaluation Overview: Product Offering
Figure 51 Evaluation Overview - Business Strategy
Figure 52 Vendor Dive Matrix: Synthetic Monitoring
Figure 53 Geographic Revenue Mix of Major Public Players
Figure 54 CA Technologies Inc.: Company Snapshot
Figure 55 IBM Corporation: Company Snapshot
Figure 56 Microsoft Corporation: Company Snapshot
Figure 57 Hewlett Packard Enterprise: Company Snapshot
Figure 58 Netscout Systems Inc.: Company Snapshot


Growth opportunities and latent adjacency in Synthetic Monitoring Market