Entrance Matting Market by type (Walk-off, Anti-fatigue, Logo and Specialty), by Material (Nylon, Coir, Rubber, Vinyl, and Others), by Utility (Indoor and Outdoor), by Application (Residential and Non-residential) - Global Forecast to 2020


[184 Pages Report] This report estimates the market size of the global entrance matting market in terms of value (USD million) and volume (million square feet). In this report, the market is broadly segmented based on type, material, utility, application, and region. Market drivers, restraints, challenges, material, pricing analysis, and regulations are discussed in detail.
The global entrance matting market is projected to reach USD 6,722.3 Million by 2020, at a CAGR of 4.8% from 2015 to 2020. Entrance matting is becoming popular in the hospitality industry and at workplaces due to advantages such as the growing concern for safety and stringent regulations.
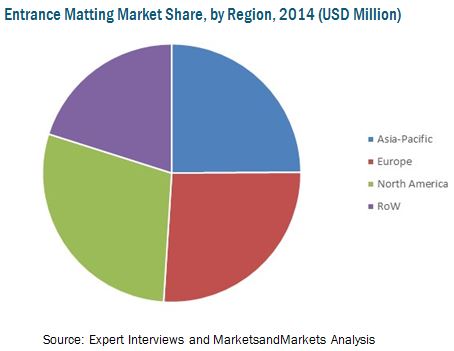
In 2014, the North American region accounted for the highest share of the total market value, followed by Europe and Asia-pacific. The entrance matting market is well established in developed countries. The market in developing economies such as China, Indonesia, and India are estimated to grow at a higher rate from 2015 to 2020.
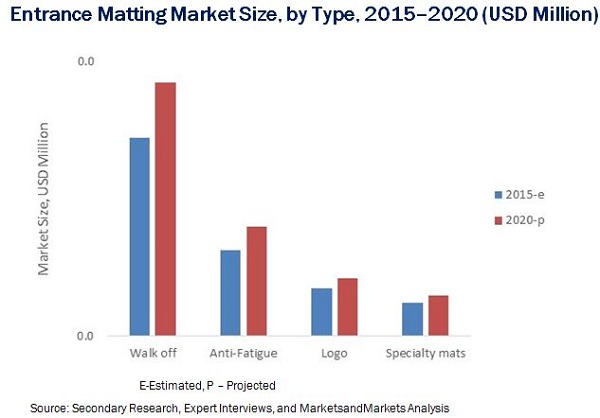
Walk-off entrance mat is projected to be the fastest-growing entrance matting type segment from 2015 to 2020. Coir is projected to be the fastest-growing element segment during the same period. The residential sector accounted for the largest share of entrance matting market in 2014 due to the rising demand for walk-off, logo, and anti-fatigue entrance matting at residential areas.
Some of the Key entrance matting manufacturers are 3M (U.S.), Cintas Corporation (U.S.), Forbo Holdings AG (Switzerland), Unifirst Corporation (U.S.), Bergo Flooring AB (Sweden), Eagle Mat & Floor Products (U.S.), Birrus Matting Systems (Australia), and Superior Manufacturing Group (U.S.) among others.
Scope of the Report
This research study categorizes the global entrance matting market based on type, material, utility, application, and region:
Based on Type:
- Walk-off
- Anti-fatigue
- Logo
- Specialty
Based on Material:
- Nylon
- Coir
- Rubber
- Vinyl
- Others
- Jute
- Cotton
- Velvet
Based on Utility:
- Indoor
- Outdoor
Based on Application:
- Residential
- Non-residential
- Commercial
- Hospitality
- Industrial
- Sports
- Others (Swimming pool, gym, school, hotels)
Based on Region:
- North America
- Europe
- Asia-Pacific
- Rest of the World (RoW)
Value Addition for the Buyer:
- This report provides five year market forecasts with important statistical and analytical information on the entrance matting type, material, utility, and application.
- This report provides a list of regulations relevant to entrance matting at the regional level.
- This report provides pricing analysis relevant to entrance matting at the global level.
- This report illustrates the industry structure, driving parameters, major players, industry dynamics, and international developments relevant to the entrance matting market.
- This report provides detailing of each segment, on the country basis for a holistic view.
- This reports provide competitive landscape profile, which is a presentation of company�s products and services.
The global entrance matting market is projected to reach USD 6,722.3 Million by 2020, at a CAGR of 4.8% from 2015 to 2020. Growth in the flooring, hospitality, and event industry are projected to be the major drivers of the entrance matting market. Increasing importance of safety at workplace is also one of the major drivers of the entrance matting market. Technological advancements as well as emergence of the anti-fatigue, logo, and specialty matting is expected to have a positive impact on the growth of the entrance matting market.
The entrance matting market is dominated by large firms such as 3M (U.S.), Cintas Corporation (U.S.), Forbo Holdings AG (Switzerland), Unifirst Corporation (U.S.), Bergo Flooring AB (Sweden), Eagle Mat & Floor Products (U.S.), Birrus Matting Systems (Australia), and Superior Manufacturing Group (U.S.).
These companies provide advanced entrance matting products, and the considerable expertise and experience gained over the years have optimized their processes and practices to become more efficient. The leading players rely on regional and local distributors to increase their share as well as geographical presence in the market. The key strategies adopted by the players in the entrance matting market are new product developments and investments. The leading entrance matting product manufacturers are focusing on emerging countries that are estimated to show potential for industrial development in the near future.
 Exclusive indicates content/data unique to MarketsandMarkets and not available with any competitors.
Table of Contents
1 Introduction (Page No. - 20)
1.1 Objectives of the Study
1.2 Market Definition
1.3 Study Scope
1.3.1 Geographic Scope
1.3.2 Years Considered for the Study
1.4 Currency
1.5 Unit Considered for the Entrance Matting Market
1.6 Stakeholders
1.7 Limitations
2 Research Methodology (Page No. - 24)
2.1 Research Data
2.1.1 Secondary Data
2.1.1.1 Key Data From Secondary Sources
2.1.2 Primary Data
2.1.2.1 Key Data From Primary Sources
2.1.2.2 Breakdown of Primary Interviews
2.1.2.3 Key Industry Insights
2.2 Market Size Estimation
2.3 Market Breakdown and Data Triangulation
2.4 Research Assumptions & Limitations
2.4.1 Assumptions
2.4.2 Limitations of the Research Study
3 Executive Summary (Page No. - 33)
3.1 Overview
3.2 Evolution
3.3 Entrance Matting Market
3.4 Market for Walk-Off to Grow at the Highest CAGR
3.5 Country Wise CAGR for Entrance Matting Market, 2015�2020
4 Premium Insights (Page No. - 38)
4.1 Attractive Opportunities in the Entrance Matting Market
4.2 Entrance Matting Market, By Application (2015-2020)
4.3 Entrance Matting Mostly Distributed in the Form of Walk-Off
4.4 Entrance Matting Market in the Asia-Pacific Region
4.5 Entrance Matting Market By Region (2014)
4.6 Entrance Matting Market, Developed vs Emerging Countries
4.7 Entrance Matting Market Life Cycle Analysis, By Region, 2014
5 Market Overview (Page No. - 44)
5.1 Introduction
5.2 Evolution
5.3 Entrance Matting Market Segmentation
5.3.1 By Material
5.3.2 By Utility
5.3.3 By Type
5.3.4 By Application
5.4 Market Dynamics
5.4.1 Drivers
5.4.1.1 Increasing Importance of Workplace Safety
5.4.1.2 Growing Flooring Industry
5.4.1.3 Growing Hospitality Industry
5.4.1.4 Growth of the Events Industry
5.4.2 Restraints
5.4.2.1 Maintenance of Matting
5.4.3 Opportunities
5.4.3.1 Recycling of Raw Material
5.4.3.2 Forward Integration in the Value Chain
5.4.3.3 Emergence of New Products
5.4.4 Challenges
5.4.4.1 Dominance of Local Players
5.5 Entrance Matting Market, Price Analysis, 2014
5.5.1 By Region, 2014
5.5.2 By Material, 2014
5.5.3 By Type, 2014
5.5.4 By Utility, 2014
5.5.5 By Application, 2014
6 Industry Trends (Page No. - 56)
6.1 Introduction
6.2 Value Chain Analysis
6.3 Porter�s Five Forces Analysis
6.3.1 Bargaining Power of Suppliers
6.3.2 Bargaining Power of Buyers
6.3.3 Threat of New Entrants
6.3.4 Threat of Substitutes
6.3.5 Intensity of Competitive Rivalry
7 Entrance Matting Market, By Type (Page No. - 62)
7.1 Introduction
7.2 Walk-Off
7.2.1 Walk-Off Mats, By Application
7.2.1.1 Walk-Off Mats are Largest Application for the Residential Purpose
7.3 Anti-Fatigue
7.3.1 Anti-Fatigue Mats, By Application
7.3.1.1 Non-Residential Application Reflects High Potential for Anti-Fatigue Mats
7.4 Logo
7.4.1 Logo Mats, By Application
7.4.1.1 Logo Mats Holds Application in Non-Residential Segment
7.5 Specialty
7.5.1 Specialty Mats, By Application
7.5.1.1 Non-Residential Application is the Largest Segment for Specialty Mats
8 Entrance Matting Market, By Material (Page No. - 70)
8.1 Introduction
8.2 Nylon
8.2.1 Nylon Entrance Matting Market, By Application
8.2.1.1 Rising Demand From Non-Residential Application is Driving the Nylon Segment for Entrance Matting Market
8.3 Coir
8.3.1 Coir Entrance Matting Market, By Application
8.3.1.1 Increasing Demand for Coir to Drive the Residential Segment
8.4 Rubber
8.4.1 Rubber Entrance Matting Market, By Application
8.4.1.1 Rubber With High Durability Hold High Demand in Residential Application
8.5 Vinyl
8.5.1 Vinyl Entrance Matting Market, By Application
8.5.1.1 Rising Demand for Vinyl to Drive the Residential Segment
8.6 Other Materials
8.6.1 Other Entrance Matting Material Market, By Application
8.6.1.1 Rising Demand for Other Materials Such as Cotton and Jute to Drive the Residential Segment
9 Entrance Matting Market, By Utility (Page No. - 79)
9.1 Introduction
9.2 Indoor
9.2.1 Indoor Segment to Experience Higher Growth Rate
9.2.2 Indoor Segment, By Application
9.2.2.1 Non-Residential is Projected to Have the Largest Market Share By 2020
9.3 Outdoor
9.3.1 Residential Segment Projected to Have Largest Market Share By 2020
9.3.2 Outdoor Segment, By Application
9.3.2.1 Non-Residential Segment to Reflect Positive Potential Growth
10 Entrance Matting Market, By Application (Page No. - 84)
10.1 Introduction
10.2 Entrance Matting Market, By Application
10.2.1 Non-Residential Segment to Projected to Grow at Highest CAGR
10.3 Non-Residential Entrance Matting Market, By Subsegment
10.3.1 Commercial Industry Holds the Largest Market Share in Non-Residential Subsegment
11 Entrance Matting Market, By Region (Page No. - 89)
11.1 Introduction
11.2 North America
11.2.1 North America: Entrance Matting By Market, By Country
11.2.1.1 U.S. Led the Entrance Matting Market in North America
11.2.2 North America: Entrance Matting By Market, By Type
11.2.2.1 Entrance Matting is Mostly Distributed as Walk-Off
11.2.3 North America: Entrance Matting By Market, By Utility
11.2.3.1 Indoor Utility Dominated the North America Market
11.2.4 North America: Entrance Matting By Market, By Material
11.2.4.1 Nylon is Most Widely Used Material
11.2.5 North America: Entrance Matting By Market, By Application
11.2.5.1 Entrance Matting is Widely Preferred for Residential Applications in North America
11.2.6 U.S.
11.2.6.1 U.S.: Entrance Matting By Market Size, By Utility
11.2.6.1.1 U.S. Entrance Matting Market is Dominated By Indoor Segment
11.2.6.2.1 The U.S. Entrance Matting Market is Dominated By Residential Segment
11.2.7 Canada
11.2.7.1 Canada: Entrance Matting By Market Size, By Utility
11.2.7.1.1 Non-Residential Segment is to Grow at the Highest CAGR in the Forecast Period
11.2.7.2 Canada.: Entrance Matting By Market Size, By Application
11.2.7.2.1 Non-Residential Segment is to Grow at the Highest CAGR in the Forecast Period
11.2.8 Mexico
11.2.8.1 Mexico: Entrance Matting By Market, By Utility
11.2.8.1.1 Mexican Entrance Matting Market, By Utility, Was Dominated By Indoor in 2014
11.2.8.2 Mexico.: Entrance Matting By Market Size, By Application
11.2.8.2.1 Mexican Entrance Matting Market, By Application, Was Dominated By Indoor Segment in 2014
11.3 Europe
11.3.1 Europe Entrance Matting Import-Export Data
11.3.2 Europe: Entrance Matting Market, By Country
11.3.2.1 U.K. has the Largest Market Share in 2014
11.3.3 Europe: Entrance Matting Market, By Type
11.3.3.1 Walk-Off Mats are Growing at Highest CAGR
11.3.4 Europe: Entrance Matting Market, By Utility
11.3.4.1 Indoor Utility Occupied Largest Share in the European Market
11.3.5 Europe: Entrance Matting Market, By Material
11.3.5.1 Nylon is Most Widely Used Material
11.3.6 Europe: Entrance Matting Market, By Application
11.3.6.1 Non-Residential Application is Projected to Grow at Higher Rate
11.3.7 U.K.
11.3.7.1 U.K.: Entrance Matting Market, By Utility
11.3.7.1.1 U.K.�S Entrance Matting Market Was Dominated By Indoor Utility in 2014
11.3.7.2 U.K.: Entrance Matting Market, By Application
11.3.7.2.1 U.K.�S Entrance Matting Market Was Dominated By Residential Application in 2014
11.3.8 Germany
11.3.8.1 Germany: Entrance Matting Market, By Utility
11.3.8.1.1 German Entrance Matting Market Was Dominated By Indoor Utility in 2014
11.3.8.2 Germany: Entrance Matting Market, By Application
11.3.8.2.1 German Entrance Matting Market Was Dominated By Residential Application in 2014
11.3.9 Spain
11.3.9.1 Spain: Entrance Matting Market, By Utility
11.3.9.1.1 Spanish Entrance Matting Market Was Dominated By Indoor Utility in 2014
11.3.9.2 Spain: Entrance Matting Market, By Application
11.3.9.2.1 Spanish Entrance Matting Market Was Dominated By Residential Application in 2014
11.3.10 Belgium
11.3.10.1 Belgium: Entrance Matting Market, By Utility
11.3.10.1.1 Belgium�s Entrance Matting Market Was Dominated By Indoor in 2014
11.3.10.2 Belgium: Entrance Matting Market, By Application
11.3.10.2.1 Belgium Entrance Matting Market Was Dominated By Residential Application in 2014
11.3.11 Rest of Europe
11.3.11.1 Rest of Europe: Entrance Matting Market, By Utility
11.3.11.1.1 Rest of Europe�s Entrance Matting Market Was Dominated By Indoor Utility in 2014
11.3.11.2 Rest of Europe: Entrance Matting Market, By Application
11.3.11.2.1 Rest of Europe Entrance Matting Market Was Dominated By Residential Application in 2014
11.4 Asia-Pacific
11.4.1 Asia-Pacific: Entrance Matting Regulations & Their Descriptions
11.4.2 Asia-Pacific: Entrance Matting Market, By Country
11.4.2.1 China Dominated the Asia-Pacific Entrance Matting Market in 2014
11.4.3 Asia-Pacific: Entrance Matting Market, By Type
11.4.3.1 Walk-Off Dominated the Asia-Pacific Entrance Matting Market in 2014
11.4.4 Asia-Pacific: Entrance Matting Market, By Utility
11.4.4.1 Indoor is Growing at Highest CAGR From 2015
11.4.5 Asia-Pacific: Entrance Matting Market, By Material
11.4.5.1 Coir is Growing at Highest CAGR From 2015
11.4.6 Asia-Pacific: Entrance Matting Market, By Application
11.4.6.1 Residential Application has Largest Market Share in 2014
11.4.7 China
11.4.7.1 China: Entrance Matting Market, By Utility
11.4.7.1.1 Outdoor Utility Dominated the Entrance Matting Market in China in 2014
11.4.7.2 China: Entrance Matting Market, By Application
11.4.7.2.1 Residential Segment Dominated the Entrance Matting Market in China in 2014
11.4.8 Indonesia
11.4.8.1 Indonesia: Entrance Matting Market, By Utility
11.4.8.1.1 Indoor Entrance Matting is Estimated to Have the Highest Demand in Indonesia
11.4.8.2 Indonesia: Entrance Matting Market, By Application
11.4.8.3 Residential Segment is Estimated to Have the Highest Demand for Entrance Matting in Indonesia
11.4.9 India
11.4.9.1 India: Entrance Matting Market, By Utility
11.4.9.1.1 Indoor Segment is Projected to Be the Fastest-Growing for Entrance Matting in India
11.4.9.2 India: Entrance Matting Market, By Application
11.4.9.2.1 Residential Segment is Projected to Be the Fastest-Growing for Entrance Matting in India
11.4.10 Australia
11.4.10.1 Australia: Entrance Matting Market, By Utility
11.4.10.1.1 Indoor Segment is Estimated to Dominate the Entrance Matting Market in Australia
11.4.10.2 Australia: Entrance Matting Market, By Application
11.4.10.2.1 Residential Segment is Estimated to Dominate the Entrance Matting Market in Australia
11.4.11 Rest of Asia-Pacific
11.4.11.1 Rest of Asia-Pacific: Entrance Matting Market, By Utility
11.4.11.1.1 Indoor Segment is Estimated to Have the Highest Demand in the Rest of Asia-Pacific Region
11.4.11.2 Rest of Asia-Pacific: Entrance Matting Market, By Application
11.4.11.2.1 Residential Segment is Estimated to Have the Highest Demand in the Rest of Asia-Pacific Region
11.5 RoW
11.5.1 RoW: By Market, By Country
11.5.1.1 Brazil Dominated the RoW Entrance Matting Market in 2014
11.5.2 RoW: By Market, By Type
11.5.2.1 Walk-Off Dominated the RoW Entrance Matting Market in 2014
11.5.3 RoW: By Market, By Utility
11.5.3.1 Indoor Utility is Growing at Highest CAGR From 2015
11.5.4 RoW: By Market, By Material
11.5.4.1 Coir is Growing at Highest CAGR From 2015
11.5.5 RoW: By Market, By Application
11.5.5.1 Non-Residential is Growing at Highest CAGR From 2015
11.5.6 Brazil
11.5.6.1 Brazil: By Market, By Utility
11.5.6.1.1 Entrance Matting Market in Brazil Was Dominated By Indoor Utility in 2014
11.5.6.2 Brazil: By Market, By Application
11.5.6.2.1 Entrance Matting Market in Brazil Was Dominated By the Residential Segment in 2014
11.5.7 South Africa
11.5.7.1 South Africa:By Market, By Utility
11.5.7.1.1 Entrance Matting is Estimated to Witness the Highest Demand From the Indoor Segment in South Africa
11.5.7.2 South Africa: By Market, By Application
11.5.7.2.1 Residential Segment are Estimated to Have the Highest Demand for Entrance Matting in South Africa
11.5.8 Argentina
11.5.8.1 Argentina: By Market, By Utility
11.5.8.1.1 Indoor Utility are Estimated to Have the Highest Demand for Entrance Matting in Argentina
11.5.8.2 Argentina:By Market, By Application
11.5.8.2.1 Residential Segment are Estimated to Have the Highest Demand for Entrance Matting in Argentina
11.5.9 Other RoW Countries
11.5.9.1 Other RoW Countries: By Market, By Utility
11.5.9.1.1 Indoor Utility Projected to Be the Fastest-Growing Market for Entrance Matting in Other RoW Countries
11.5.9.2 Other RoW Countries: By Market, By Application
11.5.9.2.1 Residential Segment is Projected to Be the Fastest-Growing Market for Entrance Matting in Other RoW Countries
12 Competitive Landscape (Page No. - 156)
12.1 Introduction
12.2 Strategic Overview
12.3 Leading Players in the Entrance Matting Market
12.4 Competitive Situation and Trends
12.5 New Product Launches
12.6 Investment
12.7 Agreement
13 Company Profiles (Page No. - 161)
(Company at A Glance, Recent Financials, Products & Services, Strategies & Insights, & Recent Developments)*
13.1 Introduction
13.2 3M
13.3 Cintas Corporation
13.4 Forbo Holdings AG
13.5 Unifirst Corporation
13.6 Bergo Flooring AB
13.7 Eagle Mat & Floor Products
13.8 Birrus Matting
13.9 Superior Manufacturing Group
*Details on Company at A Glance, Recent Financials, Products & Services, Strategies & Insights, & Recent Developments Might Not Be Captured in Case of Unlisted Companies.
14 Appendix (Page No. - 178)
14.1 Discussion Guide
14.2 Introducing RT: Real Time Market Intelligence
14.3 Available Customizations
14.4 Related Reports
List of Tables (153 Tables)
Table 1 Material & Description
Table 2 Utility & Description
Table 3 Type & Description
Table 4 Application & Description
Table 5 Frequency and Cleaning Methods for Entrance Matting
Table 6 Entrance Matting By Market Size, By Type, 2013�2020 (USD Million)
Table 7 Entrance Matting By Market Size, By Type, 2013�2020 (Million Square Feet)
Table 8 Walk-Off Mats Market Size, By Application, 2013�2020 (USD Million)
Table 9 Walk-Off Mats Market Size, By Application, 2013�2020 (Million Square Feet)
Table 10 Anti-Fatigue Mats Market Size, By Application, 2013�2020 (USD Million)
Table 11 Anti-Fatigue Mats Market Size, By Application, 2013�2020 (Million Square Feet)
Table 12 Logo Mats Market Size, By Application, 2013�2020 (USD Million)
Table 13 Logo Mats Market Size, By Application, 2013�2020 (Million Square Feet)
Table 14 Specialty Mats Market Size, By Application, 2013�2020 (USD Million)
Table 15 Specialty Mats Market Size, By Application, 2013�2020 (Million Square Feet)
Table 16 Entrance Matting Market Size, By Material, 2013�2020 (USD Million)
Table 17 Entrance Matting Market Size, By Material, 2013�2020 (Million Square Feet)
Table 18 Nylon Entrance Matting By Market Size, By Application, 2013�2020 (USD Million)
Table 19 Nylon Entrance Matting By Market Size, By Application, 2013�2020 (Million Square Feet)
Table 20 Coir Entrance Matting By Market Size, By End Use, 2013�2020 (USD Million)
Table 21 Coir Entrance Matting By Market Size, By Application, 2013�2020 (Million Square Feet)
Table 22 Rubber Entrance Matting By Market Size, By Application, 2013�2020 (USD Million)
Table 23 Rubber Entrance Matting By Market Size, By Application, 2013�2020 (Million Square Feet)
Table 24 Vinyl Entrance Matting By Market Size, By Application, 2013�2020 (USD Million)
Table 25 Vinyl Entrance Matting By Market Size, By Application, 2013�2020 (Million Square Feet)
Table 26 Other Entrance Matting Materials Market Size, By Application 2013�2020 (USD Million)
Table 27 Other Entrance Matting Materials Market Size, By Application, 2013�2020 (Million Square Feet)
Table 28 Entrance Matting Market Size, By Utility, 2013�2020 (USD Million)
Table 29 Entrance Matting Market Size, By Utility, 2013�2020 (Million Square Feet)
Table 30 Indoor Market Size, By Application, 2013�2020 (USD Million)
Table 31 Indoor Market Size, By Application, 2013�2020 (Million Square Feet)
Table 32 Outdoor Market Size, By Application, 2013�2020 (USD Million)
Table 33 Outdoor Market Size, By Application, 2013�2020 (Million Square Feet)
Table 34 Entrance Matting By Market Size, By Application, 2013�2020 (USD Million)
Table 35 Entrance Matting By Market Size, By Application, 2013�2020 (Million Square Feet)
Table 36 Non-Residential Entrance Matting Market Size, By Subsegment, 2013-2020 (USD Million)
Table 37 Non-Residential Entrance Matting Market Size, By Subsegment, 2013-2020 (Million Square Feet)
Table 38 Entrance Matting Market Size, By Region, 2013�2020 (USD Million)
Table 39 Entrance Matting Market Size, By Region, 2013�2020 (Million Square Feet)
Table 40 North America: Entrance Matting Export Data
Table 41 North America: By Market Size, By Country, 2013�2020 (USD Million)
Table 42 North America: By Market Size, By Country, 2013�2020 (Million Square Feet)
Table 43 North America: By Market Size, By Type, 2013�2020 (USD Million)
Table 44 North America: By Market Size, By Type, 2013�2020 (Million Square Feet)
Table 45 North America: By Market Size, By Utility, 2013�2020 (USD Million)
Table 46 North America: By Market Size, By Utility, 2013�2020 (Million Square Feet)
Table 47 North America: By Market Size, By Material, 2013�2020 (USD Million)
Table 48 North America: By Market Size, By Material, 2013�2020 (Million Square Feet)
Table 49 North America: By Market Size, By Application, 2013�2020 (USD Million)
Table 50 North America: By Market Size, By Application , 2013�2020 (Million Square Feet)
Table 51 U.S.: Entrance Matting Market Size, By Utility, 2013�2020 (USD Million)
Table 52 U.S.: By Market Size, By Utility, 2013�2020 (Million Square Feet)
Table 53 U.S.: By Market Size, By Application, 2013�2020 (USD Million)
Table 54 U.S.: By Market Size, By Application, 2013�2020 (Million Square Feet)
Table 55 Canada: Entrance Matting Market Size, By Utility, 2013�2020 (USD Million)
Table 56 Canada: By Market Size, By Utility, 2013�2020 (Million Square Feet)
Table 57 Canada: By Market Size, By Application, 2013�2020 (USD Million)
Table 58 Canada: By Market Size, By Application, 2013�2020 (Million Square Feet)
Table 59 Mexico: Entrance Matting Market Size, By Type, 2013�2020 (USD Million)
Table 60 Mexico: By Market Size, By Type, 2013�2020 (Million Square Feet)
Table 61 Mexico: By Market Size, By Application, 2013�2020 (USD Million)
Table 62 Mexico: By Market Size, By Application, 2013�2020 (Million Square Feet)
Table 63 Europe: Entrance Matting Import-Export Data for 2014
Table 64 Europe: By Market Size, By Country, 2013�2020 (USD Million)
Table 65 Europe: By Market Size, By Country, 2013�2020 (Million Square Feet)
Table 66 Europe: By Market Size, By Type, 2013�2020 (USD Million)
Table 67 Europe: By Market Size, By Type, 2013�2020 (Million Square Feet)
Table 68 Europe: By Market Size, By Utility, 2013�2020 (USD Million)
Table 69 Europe: By Market Size, By Utility, 2013�2020 (Million Square Feet)
Table 70 Europe: By Market Size, By Material, 2013�2020 (USD Million)
Table 71 Europe: By Market Size, By Material, 2013�2020 (Million Square Feet)
Table 72 Europe: By Market Size, By Application, 2013�2020 (USD Million)
Table 73 Europe: By Market Size, By Application, 2013�2020 (Million Square Feet)
Table 74 U.K.: Entrance Matting Market Size, By Utility, 2013�2020 (USD Million)
Table 75 U.K.: By Market Size, By Type, 2013�2020 (Million Square Feet)
Table 76 U.K.: By Market Size, By Application, 2013�2020 (USD Million)
Table 77 U.K.: By Market Size, By Application, 2013�2020 (Million Square Feet)
Table 78 Germany: Entrance Matting Market Size, By Utility, 2013�2020 (USD Million)
Table 79 Germany: By Market Size, By Utility 2013�2020 (Million Square Feet)
Table 80 Germany: By Market Size, By Application, 2013�2020 (USD Million)
Table 81 Germany: By Market Size, By Application, 2013�2020 (Million Square Feet)
Table 82 Spain: Entrance Matting Market Size, By Utility, 2013�2020 (USD Million)
Table 83 Spain: By Market Size, By Utility, 2013�2020 (Million Square Feet)
Table 84 Spain: By Market Size, By Application, 2013�2020 (USD Million)
Table 85 Spain: By Market Size, By Application, 2013�2020 (Million Square Feet)
Table 86 Belgium: Entrance Matting Market Size, By Utility, 2013�2020 (USD Million)
Table 87 Belgium: By Market Size, By Utility, 2013�2020 (Million Square Feet)
Table 88 Belgium: By Market Size, By Application, 2013�2020 (USD Million)
Table 89 Belgium: By Market Size, By Application, 2013�2020 (Million Square Feet)
Table 90 Rest of Europe: Entrance Matting Market Size, By Utility, 2013�2020 (USD Million)
Table 91 Rest of Europe: By Market Size, By Utility, 2013�2020 (Million Square Feet)
Table 92 Rest of Europe: By Market Size, By Application, 2013�2020 (USD Million)
Table 93 Rest of Europe: By Market Size, By Application, 2013�2020 (Million Square Feet)
Table 94 APAC: Entrance Matting Regulations & Their Descriptions
Table 95 Asia-Pacific: Entrance Matting Market Size, By Country, 2013�2020 (USD Million)
Table 96 Asia-Pacific: By Market Size, By Country, 2013�2020 (Million Square Feet)
Table 97 Asia-Pacific: By Market Size, By Type, 2013�2020 (USD Million)
Table 98 Asia-Pacific: By Market Size, By Type, 2013�2020 (Million Square Feet)
Table 99 Asia-Pacific: By Market Size, By Utility, 2013�2020 (USD Million)
Table 100 Asia-Pacific: Entrance Matting Market Size, By Utility, 2013�2020 (Million Square Feet)
Table 101 Asia-Pacific: By Market Size, By Material, 2013�2020 (USD Million)
Table 102 Asia-Pacific: By Market Size, By Material, 2013�2020 (Million Square Feet)
Table 103 Asia-Pacific: By Market Size, By Application, 2013�2020 (USD Million)
Table 104 Asia-Pacific: By Market Size, By Application , 2013�2020 (Million Square Feet)
Table 105 China: Entrance Matting Market Size, By Utility, 2013�2020 (USD Million)
Table 106 China: By Market Size, By Utility, 2013�2020 (Million Square Feet)
Table 107 China: By Market Size, By Application, 2013�2020 (USD Million)
Table 108 China: By Market Size, By Application, 2013�2020 (Million Square Feet)
Table 109 Indonesia: Entrance Matting Market Size, By Utility, 2013�2020 (USD Million)
Table 110 Indonesia: By Market Size, By Utility, 2013�2020 (Million Square Feet)
Table 111 Indonesia: By Market Size, By Application, 2013�2020 (USD Million)
Table 112 Indonesia: By Market Size, By Application, 2013�2020 (Million Square Feet)
Table 113 India: Entrance Matting Market Size, By Utility, 2013�2020 (Million Square Feet)
Table 114 India: By Market Size, By Application, 2013�2020 (USD Million)
Table 115 India: By Market Size, By Application, 2013�2020 (Million Square Feet)
Table 116 Australia: Entrance Matting Market Size, By Utility, 2013�2020 (USD Million)
Table 117 Australia: By Market Size, By Utility, 2013�2020 (Million Square Feet)
Table 118 Australia: By Market Size, By Application, 2013�2020 (USD Million)
Table 119 Australia: By Market Size, By Application, 2013�2020 (Million Square Feet)
Table 120 Rest of Asia-Pacific: Entrance Matting Market Size, By Utility, 2013�2020 (USD Million)
Table 121 Rest of Asia-Pacific: By Market Size, By Utility, 2013�2020 (Million Square Feet)
Table 122 Rest of Asia-Pacific: By Market Size, By Application, 2013�2020 (USD Million)
Table 123 Rest of Asia-Pacific: By Market Size, By Application, 2013�2020 (Million Square Feet)
Table 124 RoW: Entrance Matting Market Size, By Country, 2013�2020 (USD Million)
Table 125 RoW: By Market Size, By Country, 2013�2020 (Million Square Feet)
Table 126 RoW: By Market Size, By Type, 2013�2020 (USD Million)
Table 127 RoW: By Market Size, By Type, 2013�2020 (Million Square Feet)
Table 128 RoW: By Market Size, By Utility, 2013�2020 (USD Million)
Table 129 RoW: By Market Size, By Utility, 2013�2020 (Million Square Feet)
Table 130 RoW: By Market Size, By Material, 2013�2020 (USD Million)
Table 131 RoW: By Market Size, By Material, 2013�2020 (Million Square Feet)
Table 132 RoW: By Market Size, By Application, 2013�2020 (USD Million)
Table 133 RoW: By Market Size, By Application, 2013�2020 (Million Square Feet)
Table 134 Brazil: Entrance Matting Market Size, By Utility, 2013�2020 (USD Million)
Table 135 Brazil: By Market Size, By Utility, 2013�2020 (Million Square Feet)
Table 136 Brazil: By Market Size, By Application, 2013�2020 (USD Million)
Table 137 Brazil: By Market Size, By Application, 2013�2020 (Million Square Feet)
Table 138 South Africa: Entrance Matting Market Size, By Utility, 2013�2020 (USD Million)
Table 139 South Africa: By Market Size, By Utility, 2013�2020 (Million Square Feet)
Table 140 South Africa: By Market Size, By Application, 2013�2020 (USD Million)
Table 141 South Africa: By Market Size, By Application , 2013�2020 (Million Square Feet)
Table 142 Argentina: Entrance Matting Market Size, By Utility, 2013�2020 (USD Million)
Table 143 Argentina: By Market Size, By Utility, 2013�2020 (Million Square Feet)
Table 144 Argentina: By Market Size, By Application, 2013�2020 (USD Million)
Table 145 Argentina: By Market Size, By Application , 2013�2020 (Million Square Feet)
Table 146 Other RoW Countries: Entrance Matting Market Size, By Utility, 2013�2020 (USD Million)
Table 147 Other RoW Countries: By Market Size, By Utility, 2013�2020 (Million Square Feet)
Table 148 Other RoW Countries: By Market Size, By Application, 2013�2020 (USD Million)
Table 149 Other RoW Countries: By Market Size, By Application, 2013�2020 (Million Square Feet)
Table 150 Rank of Companies in the Global Entrance Matting Market, 2015
Table 151 New Product Development: Key Strategy of the Key Players, 2006-2015
Table 152 Investment, 2013-2015
Table 153 Agreement, 2013-2015
List of Figures (45 Figures)
Figure 1 Entrance Matting Market: Research Design
Figure 2 Market Size Estimation Methodology: Bottom-Up Approach
Figure 3 Market Size Estimation Methodology: Top-Down Approach
Figure 4 Data Triangulation Methodology
Figure 5 Limitations of the Research Study
Figure 6 Indoor Utility is Projected to Be the Leader in the Market During the Forecast Period
Figure 7 Entrance Matting Market Snapshot (2014 vs 2020): Market for Walk-Off Mats to Grow at the Highest CAGR
Figure 8 China is Projected to Be the Fastest-Growing Market for Entrance Matting, 2015�2020
Figure 9 Leading Market Players Adopted New Product Development as the Key Strategy During 2006 to 2015
Figure 10 Emerging Economies Offer Attractive Opportunities in the Entrance Matting Market
Figure 11 Residential Segment Projected to Dominate the Entrance Matting Market
Figure 12 Walk-Off Accounted for A Larger Share in 2014
Figure 13 Non-Residential Application Captured the Largest Share in the Emerging Asia-Pacific Market in 2014
Figure 14 Asia-Pacific is Projected to Be the Fastest-Growing Segment During the Forecast Year
Figure 15 Emerging Markets to Grow Faster Than Developed Markets (2015�2020)
Figure 16 Asia-Pacific Region is Experiencing High Growth in the Entrance Matting Market
Figure 17 Evolution of Entrance Matting
Figure 18 Entrance Matting Market Segmentation
Figure 19 Drivers, Restraints, Opportunites, and Challenges
Figure 20 Manufacturing & Distribution are an Integral Part of the Value Chain in the Entrance Matting Market
Figure 21 Major Stakeholders Involved in the Value Chain
Figure 22 Porter�s Five Forces Analysis
Figure 23 Mat Provides an Additional Edge Over Carpet
Figure 24 Entrance Matting Market Size, By Type, 2015 vs 2020 (USD Million & Million Square Feet)
Figure 25 Entrance Matting Market Size, By Utility, 2013�2020 (USD Million)
Figure 26 Increasing Demand in the Non-Residential Application Would Drive the Entrance Matting Market During the Forecast Period
Figure 27 Geographical Snapshot (2015�2020): Market in Asia-Pacific is Projected to Register the Highest Growth Rate
Figure 28 North America is the Largest Segment in the Entrance Matting Market, 2015�2020
Figure 29 North America: Entrance Matting Market
Figure 30 Walk-Off Mats Segment is Estimated to Be the Largest Segment in 2015
Figure 31 Asia-Pacific Market Holds Potential Growth Opportunities for Entrance Matting
Figure 32 New Product Development is the Key Growth Strategy Adopted By Players in the Entrance Matting Market
Figure 33 Battle for Market Share: New Product Development, Agreement and Investment Was the Key Strategies Adopted By Players Between December 2006 and August 2015
Figure 34 Geographic Revenue Mix of Top 5 Market Players
Figure 35 3M: Company Snapshot
Figure 36 3M: SWOT Analysis
Figure 37 Cintas Corporation: Company Snapshot
Figure 38 Cintas Corporation: SWOT Analysis
Figure 39 Forbo Holdings AG: Company Snapshot
Figure 40 Forbo Holdings AG: SWOT Analysis
Figure 41 Unifirst Corporation: Company Snapshot
Figure 42 Unifirst Corporation: SWOT Analysis
Figure 43 Bergo Flooring AB Limited: Company Snapshot
Figure 44 Bergo Flooring AB Limited: SWOT Analysis
Figure 45 Superior Manufacturing Group: Company Snapshot


Growth opportunities and latent adjacency in Entrance Matting Market
Please help me with the Walk-off entrance mat growth in the U.S market for the years 2015-2017.