Ethernet Controller Market by Function (PHY & Integrated), Bandwidth (Ethernet, Fast Ethernet, Gigabit Ethernet), Packaging (Flip-chips, and Grid Arrays, QPF, QFN, and Others), Application and Geography - Global forecast to 2023


[140 Pages Report] The Ethernet controller market was valued at USD 7.69 Billion in 2016 and is expected to be worth USD 11.89 Billion by 2023, at a CAGR of 6.22% between 2017 and 2023. The base year considered for the study is 2016 and the forecast period is between 2017 and 2023.
Objectives of the Study:
- To define, describe, and forecast the global market segmented on the basis of function, packaging, bandwidth, application, and geography
- To forecast the size in terms of value and volume of the market segments with respect to four major regions: North America, Europe, Asia Pacific (APAC), and Rest of the World (RoW)
- To provide detailed information regarding the major factors influencing the growth of the market (drivers, restraints, opportunities, and challenges)
- To strategically analyze the micromarkets with respect to individual growth trends, future prospects, and contribution to the total market
- To analyze opportunities in the market for various stakeholders by identifying high-growth segments of the market
- To benchmark players within the market using proprietary “Competitive Leadership Mapping” framework that analyzes market players on various parameters within the broad categories of business and product strategies.
- To analyze various strategies such as joint ventures, mergers and acquisitions, product launches, and research and development (R&D) in the Ethernet controller market
The global Ethernet controller market is projected to exhibit a lucrative growth potential during the forecast period. The growth of this market is propelled by the growing demand for high-performance applications, integration of advanced features, and small form factor and easy interface with 16 and 32-bit embedded CPUs. The market was valued at USD 8.28 Billion in 2017 and is expected to reach USD 11.89 Billion by 2023, at a CAGR of 6.22% during the forecast period.
The report covers the Ethernet controller market on the basis of function, packaging, bandwidth, applications, and geography. Among applications, consumer application accounted for the largest market size in 2016. Consumer applications comprise set-top box, video-over IP solutions, IP PBX & video phones, high-performance printers, gaming consoles, and IoT applications (such as digital signage and eHealth).
Among packaging, flip-chips and grid arrays are expected to lead the overall Ethernet controller market due to the highest CAGR during the forecast period. The flip-chip packaging methodology offers a smaller assembly in comparison with the traditional carrier-based system. This is because the chip sits on the circuit board directly and is smaller in height and area. Additionally, the wires are short and further helps in reducing inductance, thereby offering higher speed signals and better heat conductivity. Similarly, the grid arrays offer high density as it resolves the issue of volume manufacturing of a miniaturized package for an IC that consists of hundreds of pins. Also, grid arrays have a lower thermal resistance between the package and the PCB that helps for ease of heat dissipation from ICs to PCBs. Additionally, a grid array has a shorter distance between the package and the PCB that helps it achieve superior electrical performance in comparison to devices with a large number of pins.
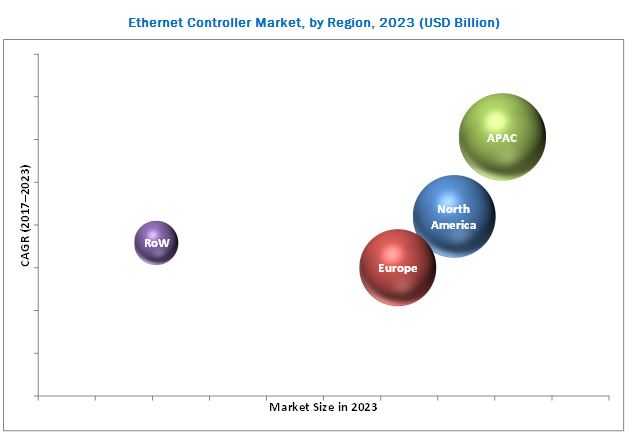
APAC is expected to account for the largest share of the Ethernet controller market in 2017, followed by North America and Europe. The market in APAC is expected to have huge potential for growth because of the presence of countries such as China, Japan, South Korea, Japan, and India. The market in APAC is expected to grow at the highest CAGR during the forecast period. The growth of the IoT industry and rapid modernization in APAC countries are some of the major factors that have led to the growth of the market in this region. This region has become a fulcrum for huge investments and business expansion opportunities.
The key restraining factors in Ethernet controller market is the continuous upgrade of drivers for optimum performance. Different operating systems require different software drivers to enable Ethernet controllers. The required software is updated regularly, and connected systems demand upgradation of the software to ensure seamless Internet connectivity.
In 2016, the Ethernet controller market was led by Intel (US), Broadcom (Singapore), Microchip (US), Cirrus Logic (US), Texas Instruments (US), Silicon Laboratories (US), DAVICOM (Taiwan), Marvell (US), Microsemi (US), and Realtek (Taiwan).
To speak to our analyst for a discussion on the above findings, click Speak to Analyst
 Exclusive indicates content/data unique to MarketsandMarkets and not available with any competitors.
Table of Contents
1 Introduction (Page No. - 14)
1.1 Objectives of the Study
1.2 Definition
1.3 Study Scope
1.3.1 Markets Covered
1.3.2 Years Considered for This Study
1.4 Currency
1.5 Limitations
1.6 Stakeholders
2 Research Methodology (Page No. - 17)
2.1 Research Data
2.1.1 Secondary Data
2.1.1.1 Key Data From Secondary Sources
2.1.2 Primary Data
2.1.2.1 Key Data From Primary Sources
2.1.2.2 Breakdown of Primaries
2.1.2.3 Key Industry Insights
2.2 Market Size Estimation
2.3 Market Breakdown and Data Triangulation
2.4 Assumptions
3 Executive Summary (Page No. - 26)
4 Premium Insights (Page No. - 30)
4.1 Attractive Growth Opportunities in the Market
4.2 Market, By Bandwidth
4.3 Market for PHY, By Application
4.4 Market, By Application and Region
4.5 Market for Flip-Chip and Grid Array, By Application
4.6 Market, By Region
5 Market Overview (Page No. - 34)
5.1 Introduction
5.2 Market Dynamics
5.2.1 Drivers
5.2.1.1 Growing Demand for High-Performance Applications
5.2.1.2 Small Form Factor and Easy Interface With 16 and 32-Bit Embedded Cpu’s
5.2.1.3 Integration of Advanced Features
5.2.2 Restraints
5.2.2.1 Continuous Upgrade of Drivers for Optimum Performance
5.2.3 Opportunities
5.2.3.1 Ethernet Controllers in Automotive to Revolutionize Driving Experience
5.2.4 Challenges
5.2.4.1 Competitive Prices Have LED to Stiff Profit Margins
6 Ethernet Controller Market, By Function (Page No. - 39)
6.1 Introduction
6.2 PHY
6.3 Integrated
7 Ethernet Controller Market, By Packaging (Page No. - 43)
7.1 Introduction
7.2 Flip-Chip and BGA
7.2.1 Flip-Chip
7.2.2 Ball Grid Array (Grid Array)
7.3 Quad Flat No-Lead (QFN)
7.4 Quad Flat Package (QFP)
7.5 Others
8 Ethernet Controller Market, By Bandwidth (Page No. - 50)
8.1 Introduction
8.2 Ethernet Or 10base-T
8.3 Fast Ethernet Or 100base-T
8.4 Gigabit Ethernet
8.4.1 1000base-T
8.4.2 10gbase-X
8.4.3 100gbase-X
9 Ethernet Controller Market, By Application (Page No. - 55)
9.1 Introduction
9.2 Servers
9.3 Embedded Systems
9.4 Consumer Applications
9.5 Router & Switches
9.6 Desktop Systems
9.7 Others
10 Geographic Analysis (Page No. - 74)
10.1 Introduction
10.2 North America
10.2.1 US
10.2.2 Canada
10.2.3 Mexico
10.3 Europe
10.3.1 UK
10.3.2 Germany
10.3.3 France
10.3.4 Italy
10.3.5 Rest of Europe
10.4 Asia Pacific
10.4.1 China
10.4.2 Japan
10.4.3 India
10.4.4 South Korea
10.4.5 Rest of APAC
10.5 Rest of the World
10.5.1 Middle East and Africa
10.5.2 South America
11 Competitive Landscape (Page No. - 96)
11.1 Overview
11.2 Ranking Analysis of Key Players in the Market
11.3 Competitive Situations and Trends
11.3.1 Battle for Market Share: Product Launches Were the Key Growth Strategies in 2016
11.3.2 Product Launch
11.3.3 Acquisitions
11.3.4 Collaborations
12 Company Profile (Page No. - 102)
(Business Overview, Products Offered & Services Strategies, Key Insights, Recent Developments, MnM View)*
12.1 Intel
12.2 Broadcom
12.3 Microchip
12.4 Cavium
12.5 Cirrus Logic
12.6 Texas Instruments
12.7 Silicon Laboratories
12.8 Davicom
12.9 Marvell
12.10 Microsemi
12.11 Realtek
12.12 Synopsys
*Details on Business Overview, Products Offered & Services Strategies, Key Insights, Recent Developments, MnM View Might Not Be Captured in Case of Unlisted Companies.
13 Appendix (Page No. - 132)
13.1 Insights of Industry Experts
13.2 Discussion Guide
13.3 Knowledge Store: Marketsandmarkets’ Subscription Portal
13.4 Introducing RT: Real-Time Market Intelligence
13.5 Available Customizations
13.6 Related Report
13.7 Author Details
List of Tables (78 Tables)
Table 1 Market, By Function, 2015–2023 (USD Billion)
Table 2 Market for PHY, By Applications, 2015–2023 (USD Million)
Table 3 Market for Integrated, By Application, 2015–2023 (USD Million)
Table 4 Market, By Packaging, 2015–2023 (USD Billion)
Table 5 Market for Flip-Chip and BGA, By Application, 2015–2023 (USD Million)
Table 6 Market for QFN, By Application, 2015–2023 (USD Million)
Table 7 Market for QFP, By Application, 2015–2023 (USD Million)
Table 8 Market for Other Packaging Types, By Application, 2015–2023 (USD Million)
Table 9 Market, By Bandwidth, 2015–2023 (USD Billion)
Table 10 Difference Between the 100base-T Networking Standards
Table 11 Difference Between the 10gbase-X Networking Standards
Table 12 Difference Between 1000base-T and 10gbase-T
Table 13 Difference Between the 100gbase-X Networking Standards
Table 14 Market, By Application, 2015–2023 (USD Billion)
Table 15 Market for Server, By Function, 2015–2023 (USD Million)
Table 16 Market for Server, By Packaging, 2015–2023 (USD Million)
Table 17 Market for Server in North America, By Country, 2015–2023 (USD Million)
Table 18 Market for Server in Europe, By Country/ Region, 2015–2023 (USD Million)
Table 19 Market for Server in APAC, By Country/ Region, 2015–2023 (USD Million)
Table 20 Market for Server in RoW, By Region, 2015–2023 (USD Million)
Table 21 Market for Embedded Systems, By Function, 2015–2023 (USD Million)
Table 22 Market for Embedded Systems, By Packaging, 2015–2023 (USD Million)
Table 23 Market for Embedded Systems in North America, By Country, 2015–2023 (USD Million)
Table 24 Market for Embedded Systems in Europe, By Country/ Region, 2015–2023 (USD Million)
Table 25 Market for Embedded Systems in APAC, By Country/ Region, 2015–2023 (USD Million)
Table 26 Market for Embedded Systems in RoW, By Region, 2015–2023 (USD Million)
Table 27 Market for Consumer Applications, By Function, 2015–2023 (USD Million)
Table 28 Market for Consumer Applications, By Packaging, 2015–2023 (USD Million)
Table 29 Market for Consumer Applications in North America, By Country, 2015–2023 (USD Million)
Table 30 Market for Consumer Applications in Europe, By Country/ Region, 2015–2023 (USD Million)
Table 31 Market for Consumer Applications in APAC, By Country/ Region, 2015–2023 (USD Million)
Table 32 Market for Consumer Applications in RoW, By Region, 2015–2023 (USD Million)
Table 33 Market for Routers & Switches, By Function, 2015–2023 (USD Million)
Table 34 Market for Routers & Switches, By Packaging, 2015–2023 (USD Million)
Table 35 Market for Routers & Switches in North America, By Country, 2015–2023 (USD Million)
Table 36 Market for Routers & Switches in Europe, By Country/ Region, 2015–2023 (USD Million)
Table 37 Market for Routers & Switches in APAC, By Country/ Region, 2015–2023 (USD Million)
Table 38 Market for Routers & Switches in RoW, By Region, 2015–2023 (USD Million)
Table 39 Market for Desktop Systems, By Function, 2015–2023 (USD Million)
Table 40 Market for Desktop Systems, By Packaging, 2015–2023 (USD Million)
Table 41 Market for Desktop Systems in North America, By Country, 2015–2023 (USD Million)
Table 42 Market for Desktop Systems in Europe, By Country/ Region, 2015–2023 (USD Million)
Table 43 Market for Desktop Systems in APAC, By Country/ Region, 2015–2023 (USD Million)
Table 44 Market for Desktop Systems in RoW, By Region, 2015–2023 (USD Million)
Table 45 Market for Others, By Function, 2015–2023 (USD Million)
Table 46 Market for Others, By Packaging , 2015–2023 (USD Million)
Table 47 Market for Others in North America, By Country, 2015–2023 (USD Million)
Table 48 Market for Others in Europe, By Country/ Region, 2015–2023 (USD Million)
Table 49 Market for Others in APAC, By Country/ Region, 2015–2023 (USD Million)
Table 50 Market for Others in RoW, By Region, 2015–2023 (USD Million)
Table 51 Market, By Region, 2015–2023 (USD Billion)
Table 52 Market in North America, By Country, 2015–2023 (USD Million)
Table 53 Market in North America, By Application, 2015–2023 (USD Million)
Table 54 Market in the US, By Application, 2015–2023 (USD Million)
Table 55 Market in Canada, By Application, 2015–2023 (USD Million)
Table 56 Market in Mexico, By Application, 2015–2023 (USD Million)
Table 57 Market in Europe, By Country/Region, 2015–2023 (USD Million)
Table 58 Market in Europe, By Application, 2015–2023 (USD Million)
Table 59 Market in the UK, By Application, 2015–2023 (USD Million)
Table 60 Market in Germany, By Application, 2015–2023 (USD Million)
Table 61 Market in France, By Application, 2015–2023 (USD Million)
Table 62 Market in Italy, By Application, 2015–2023 (USD Million)
Table 63 Market in RoE, By Application, 2015–2023 (USD Million)
Table 64 Ethernet Controller Market in APAC, By Country/Region, 2015–2023 (USD Million)
Table 65 Market in APAC, By Application, 2015–2023 (USD Million)
Table 66 Market in China, By Application, 2015–2023 (USD Million)
Table 67 Market in Japan, By Application, 2015–2023 (USD Million)
Table 68 Market in India, By Application, 2015–2023 (USD Million)
Table 69 Market in South Korea, By Application, 2015–2023 (USD Million)
Table 70 Market in RoAPAC, By Application, 2015–2023 (USD Million)
Table 71 Market in RoW, By Region, 2015–2023 (USD Million)
Table 72 Market in RoW, By Application, 2015–2023 (USD Million)
Table 73 Market in MEA, By Application, 2015–2023 (USD Million)
Table 74 Market in South America, By Application, 2015–2023 (USD Million)
Table 75 Market: Ranking Analysis of Key Companies
Table 76 Product Launches (2015–2017)
Table 77 Acquisitions (2015 & 2016)
Table 78 Collaborations (2015–2017)
List of Figures (40 Figures)
Figure 1 Market
Figure 2 Market: Process Flow of Market Size Estimation
Figure 3 Market: Research Design
Figure 4 Bottom-Up Approach
Figure 5 Top-Down Approach
Figure 6 Data Triangulation
Figure 7 Flip-Chip and BGA Expected to Lead the Market During the Forecast Period
Figure 8 Consumer Applications Expected to Hold the Largest Share of the Market in 2017
Figure 9 PHY Controllers Expected to Hold A Larger Size of the Market By 2023
Figure 10 North America Expected to Hold the Largest Share of the Market in 2017
Figure 11 Market in APAC to Grow at the Highest Rate During the Forecast Period
Figure 12 Gigabit Ethernet to Lead the Market During the Forecast Period
Figure 13 Consumer Applications to Hold the Largest Market for Ethernet Controllers for PHY By 2023
Figure 14 China to Hold the Largest Share of the Market in 2017
Figure 15 Servers to Hold the Largest Size of the Flip-Chip and BGA Market By 2023
Figure 16 US Expected to Hold the Largest Share of the Ethernet Controller in 2017
Figure 17 Growing Demand for High-Performance Applications and Integration of Advanced Features Fuel the Growth of the Market
Figure 18 Market, By Function
Figure 19 Market Segmentation, By Function
Figure 20 Market Segmentation, By Packaging
Figure 21 Flip-Chip and BGA to Hold Largest Size of Market By 2023
Figure 22 Market Segmentation, By Bandwidth
Figure 23 Geographic Snapshot of the Market (2017–2023)
Figure 24 Snapshot of the Market in North America
Figure 25 Snapshot of the Market in Europe
Figure 26 Snapshot of the Market in Asia Pacific
Figure 27 Market for Servers in APAC Expected to Dominate During the Forecast Period
Figure 28 Market Evolution Framework—Product Launches Emerged as the Major Strategy Adopted By the Market Players
Figure 29 Intel: Company Snapshot
Figure 30 Broadcom: Company Snapshot
Figure 31 Microchip: Company Snapshot
Figure 32 Cavium: Company Snapshot
Figure 33 Cirrus Logic: Company Snapshot
Figure 34 Texas Instruments: Company Snapshot
Figure 35 Silicon Laboratories: Company Snapshot
Figure 36 Davicom: Company Snapshot
Figure 37 Marvell: Company Snapshot
Figure 38 Microsemi: Company Snapshot
Figure 39 Realtek: Company Snapshot
Figure 40 Synopsys: Company Snapshot
Research Methodology:
This research study incorporates the usage of secondary sources, directories, and databases such as Hoovers, Bloomberg BusinessWeek, Factiva, and OneSource to identify and collect information useful for the extensive technical, market-oriented, and commercial study of the Ethernet controller market. Primary sources mainly comprise several experts from core and related industries, along with preferred suppliers, manufacturers, distributors, service providers, technology developers, alliances, standards, and certification organizations related to various parts of this industry’s value chain. In-depth interviews of various primary respondents, including key industry participants, subject matter experts (SMEs), C-level executives of key companies, and consultants, have been conducted to obtain and verify critical qualitative and quantitative information as well as assess future prospects. The breakdown of the profiles of primaries has been depicted in the figure below:
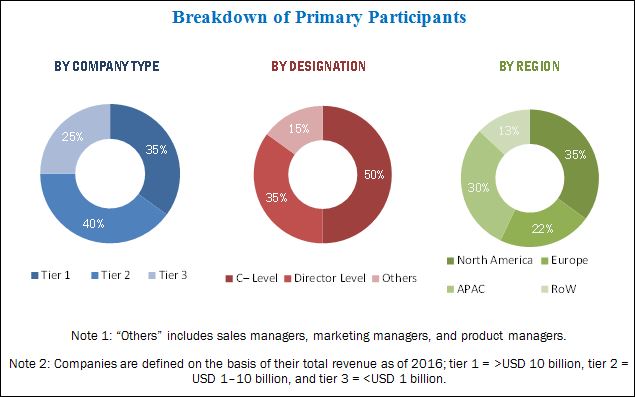
To know about the assumptions considered for the study, download the pdf brochure
This report provides valuable insights into the ecosystem of the Ethernet controller market. The major players profiled in this report Intel (US), Broadcom (Singapore), Microchip (US), Cirrus Logic (US), Texas Instruments (US), Silicon Laboratories (US), Davicom (Taiwan), Marvell (US), Microsemi (US), and Realtek (Taiwan).
Key Target Audience:
- Semiconductor foundries
- Original equipment manufacturers (OEMs) (application or electronic product manufacturers)
- ODM and OEM technology solution providers
- Small and large technology centers
- Ethernet controller manufacturing companies
- Network interface controller (NIC) manufacturers
- Research institutes or organizations
- Market research and consulting firms
- Technology investors
- Government bodies, venture capitalists, and private equity firms
Scope of the Report:
The research report segments the market into the following submarkets:
Ethernet Controller Market, by Function
- PHY
- Integrated
Market, by Packaging
- Flip-chips and grid array
- QFN
- QFP
- Others
Ethernet Controller Market, by Bandwidth
- Ethernet
- Fast Ethernet
- Gigabit Ethernet
Market, by Application
- Servers
- Embedded systems
- Consumer applications
- Routers and Switches
- Desktop systems
- Others
Ethernet Controller Market, by Region
- North America
- Europe
- Asia Pacific
- Rest of the World
Available Customizations:
With the given market data, MarketsandMarkets offers customizations according to companies specific needs. The following customization options are available for the report.
-
Company Information
- Detailed analysis and profiling of additional market players (up to five)


Growth opportunities and latent adjacency in Ethernet Controller Market