Expression Vectors Market by Host Type (Bacterial/E.Coli, Mammalian/CHO, Insect/Baculovirus, and Yeast), Application (Therapeutic, Research, and Industrial), End User (Pharmaceutical, Biotechnology, CROs & CMOs, and Academic Research) - Forecast to 2020


The expression vectors market is expected to reach $317.1 Million by 2020 from $242.7 Million in 2015, growing at a CAGR of 5.5% from 2015 to 2020. Major factors driving the growth of this market include the increasing demand of protein-based drugs (biologics); high prevalence of lifestyle diseases, infectious diseases, and genetic disorders; and increasing funding for protein research. On the other hand, high market consolidation, which increases entry barriers, and high cost of protein therapy are the major factors restraining the growth of this market.
North America dominates this market, with the U.S. accounting for a major market share. However, the Asian market is poised to grow at the highest CAGR during the forecast period. Growth in the Asian market will be driven by factors such as high growth in the pharmaceutical and biotechnology sector, presence of key market players in this region, and changing regulatory framework to support innovation and commercialization.
Prominent players in this market include Thermo Fisher Scientific, Inc. (U.S.), Promega Corporation (U.S.), Sigma-Aldrich Corporation (U.S.), Agilent Technologies (U.S.), Bio-Rad Laboratories (U.S.), New England Biolabs (U.S.), Merck Millipore (U.S.), QIAGEN (Netherlands), Clontech Laboratories, Inc. (U.S.), DNA2.0 (U.S.), and GenScript USA Inc. (U.S.).
Scope of the Report
This research report covers the market by host type, application, end user, and region.
By Host Type
- Bacterial Expression Vectors
- E. Coli Expression Vectors
- Other Bacterial Expression Vectors
- Mammalian Expression Vectors
- CHO Expression Vectors
- Other Mammalian Expression Vectors
- Insect Expression Vectors
- Baculovirus Expression Vectors
- Other Insect Expression Vectors
- Yeast Expression Vectors
- K. Lactis Expression Vectors
- Pichia Pastoris Expression Vectors
- Saccharomyces Cerevisiae Expression Vectors
- Other Yeast Expression Vectors
- Other Expression Vectors
By Application
- Therapeutic Applications
- Research Applications
- Industrial Applications
By End User
- Pharmaceutical and Biotechnology Companies
- Contract Research Organizations (CROs) and Contract Manufacturing Organizations (CMOs)
- Academic Research Institutes
- Other End Users
By Region
- North America
- U.S.
- Canada
- Europe
- Asia
- Rest of the World (RoW)
An expression vector/expression construct is a plasmid or virus used for protein expression in different types of host cells. An expression vector helps to introduce a gene of interest into a target cell and triggers the cell�s mechanism to produce a protein encoded by the gene. This is a slow-growing market whose growth is mainly driven by the increasing demand of protein-based drugs (biologics); high prevalence of lifestyle diseases, infectious diseases, and genetic disorders; and increasing funding for protein research and protein therapy. On the other hand, high market consolidation, which increases entry barriers, and high cost of protein therapy are the major factors restraining the growth of this market. However, high growth potential in emerging economies provides new growth opportunities to players in this market.
The expression vectors market is expected to reach $317.1 Million by 2020 from $242.7 Million in 2015, growing at a CAGR of 5.5% from 2015 to 2020. This market is segmented on the basis of host type, application, end user, and region.
On the basis of host type, this market is segmented into bacterial, mammalian, insect, yeast, and other expression vectors. Bacterial expression vectors are further segmented into expression vectors for E. Coli and other bacterial expression vectors. The mammalian expression vectors market is further segmented into expression vectors for CHO systems and other mammalian expression vectors. The insect expression vectors market is segmented into expression vectors for Baculovirus systems and other insect expression vectors. The yeast expression vectors market is segmented into expression vectors for K. lactis systems, Pichia pastoris systems, Saccharomyces cerevisiae systems, and other yeast systems.
On the basis of application, this global market is segmented into therapeutic, research, and industrial applications. On the basis of end users, the market is segmented into pharmaceutical and biotechnology companies, contract research organizations (CROs) and contract manufacturing organization (CMOs), academic research institutes, and other end users.
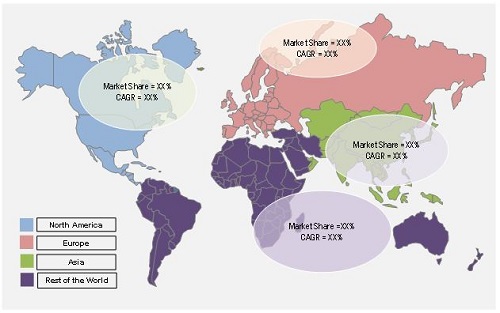
Expression Vectors Market, by Region, 2015
Source: Annual Reports, SEC Filings, Investor Presentations, World Bank, World Intellectual Property Organization, Industry Canada, International Federation of Pharmaceutical Manufacturers & Associations, Centre for Drug Research (CDR), President�s Council of Advisors on Science and Technology, Nature Biotechnology Journal on Next-Generation Protein Drugs, Human Proteome Organization, Expert Interviews, and MarketsandMarkets Analysis
The global market is dominated by North America, followed by Europe, Asia, and the Rest of the World (RoW). North America will continue to dominate the market in the forecast period. However, Asia is poised to grow at the highest CAGR in the forecast period. Over the next five years, growth in the Asian region is likely to be centered on China and India.
Key players in the Expression Vectors Market include Thermo Fisher Scientific, Inc. (U.S.), Promega Corporation (U.S.), Sigma-Aldrich Corporation (U.S.), Agilent Technologies (U.S.), Bio-Rad Laboratories (U.S.), New England Biolabs (U.S.), Merck Millipore (U.S.), QIAGEN (Netherlands), Clontech Laboratories, Inc. (U.S.), DNA2.0 (U.S.), and GenScript USA Inc. (U.S.).
 Exclusive indicates content/data unique to MarketsandMarkets and not available with any competitors.
Table of Contents
1 Introduction
1.1 Objectives of the Study
1.2 Market Definition
1.3 Market Scope
1.3.1 Market Segmentation
1.3.2 Years Considered for the Study
1.4 Limitations
1.5 Market Stakeholders
2 Research Methodology
2.1 Market Size Estimation
2.2 Market Breakdown and Data Triangulation
2.3 Key Data From Secondary Sources
2.4 Key Data From Primary Sources
2.5 Key Industry Insights
2.6 Assumptions for the Study
3 Executive Summary
4 Premium Insights
5 Market Overview
5.1 Introduction
5.2 Market Segmentation
5.2.1 By Host Type
5.2.2 By Application
5.2.3 By End User
5.2.4 By Region
5.3 Market Dynamics
5.3.1 Drivers
5.3.1.1 Increase in Demand of Protein-Based Drugs (Biologics)
5.3.1.2 High Prevalence Rate of Lifestyle Diseases, Infectious Diseases, and Genetic Disorders
5.3.1.3 Funding for Protein Research
5.3.2 Restraints
5.3.2.1 High Market Consolidation Increases Entry Barriers and Restrains Market Growth
5.3.2.2 High Cost of Protein Therapy
5.3.3 Opportunities
5.3.3.1 Developing Countries Present Significant Opportunities for Market
5.3.4 Challenges
5.3.4.1 Sequestration Cuts in the U.S.: Challenge to the North American Market
6 By Host Type
6.1 Introduction
6.2 Bacterial Expression Vectors
6.2.1 E.Coli Expression Vectors
6.2.2 Other Bacterial Expression Vectors
6.3 Mammalian Expression Vectors
6.3.1 CHO Expression Vectors
6.3.2 Other Mammalian Expression Vectors
6.4 Insect Expression Vectors
6.4.1 Baculovirus Expression Vectors
6.4.2 Other Insect Expression Vectors
6.5 Yeast Expression Vectors
6.5.1 K. Lactis Expression Vectors
6.5.2 Pichia Pastoris Expression Vectors
6.5.3 Saccharomyces Cerevisiae Expression Vectors
6.5.4 Other Yeast Expression Vectors
6.6 Other Expression Vectors
7 By Application
7.1 Introduction
7.2 Therapeutic Applications
7.3 Industrial Applications
7.4 Research Applications
8 By End User
8.1 Introduction
8.2 Pharmaceutical and Biotechnology Companies
8.3 CROS and CMOS
8.4 Academic Research Institutes
8.5 Other End Users
9 Geographic Analysis
9.1 Introduction
9.2 North America
9.2.1 U.S.
9.2.2 Canada
9.3 Europe
9.4 Asia
9.5 Rest of the World (RoW)
10 Competitive Landscape
10.1 Overview
10.2 Market Share Analysis, By Key Players, 2014
10.3 Competitive Situation and Trends
10.3.1 Partnerships, Agreements, and Collaborations
10.3.2 Expansions
10.3.3 Acquisitions
10.3.4 New Product Launches
11 Company Profiles (Overview, Financials, Products, & Developments)*
11.1 Merck Millipore
11.2 Thermo Fisher Scientific, Inc.
11.3 Sigma-Aldrich Corporation
11.4 Promega Corporation
11.5 Clontech Laboratories, Inc.
11.6 Agilent Technologies
11.7 Bio-Rad Laboratories
11.8 DNA20., Inc.
11.9 New England Biolabs (NEB)
11.10 Qiagen
12 Appendix
12.1 Insights From Industry Experts
12.2 Discussion Guide
12.3 Introducing RT: Real-Time Market Intelligence
12.4 Available Customizations
12.5 Related Reports
List of Tables (99 Tables)
Table 1 The Global Market Size, By Host Type, 2013-2020 ($Million)
Table 2 Bacterial Expression Vectors Market Size, By Type, 2013-2020 ($Million)
Table 3 Bacterial Expression Vectors Market Size, By Region, 2013-2020 ($Million)
Table 4 North America: Bacterial Expression Vectors Market Size, By Country, 2013-2020 ($Million)
Table 5 E.Coli Expression Vectors Market Size, By Region, 2013-2020 ($Million)
Table 6 North America: E.Coli Expression Vectors Market Size, By Country, 2013-2020 ($Million)
Table 7 Other Bacterial Expression Vectors Market Size, By Region, 2013-2020 ($Million)
Table 8 North America: Other Bacterial Expression Vectors Market Size, By Country, 2013-2020 ($Million)
Table 9 Mammalian Expression Vectors Market Size, By Type, 2013-2020 ($Million)
Table 10 Mammalian Expression Vectors Market Size, By Region, 2013-2020 ($Million)
Table 11 North America: Mammalian Expression Vectors Market Size, By Country, 2013-2020 ($Million)
Table 12 CHO Expression Vectors Market Size, By Region, 2013-2020 ($Million)
Table 13 North America: CHO Expression Vectors Market Size, By Country, 2013-2020 ($Million)
Table 14 Other Mammalian Vectors Market Size, By Region, 2013-2020 ($Million)
Table 15 North America: Other Mammalian Expression Vectors Market Size, By Country, 2013-2020 ($Million)
Table 16 Insect Expression Vectors Market Size, By Type, 2013-2020 ($Million)
Table 17 Insect Expression Vectors Market Size, By Region, 2013-2020 ($Million)
Table 18 North America: Insect Expression Vectors Market Size, By Country, 2013-2020 ($Million)
Table 19 Baculovirus Expression Vectors Market Size, By Region, 2013-2020 ($Million)
Table 20 North America: Baculovirus Expression Vectors Market Size, By Country, 2013-2020 ($Million)
Table 21 Other Insect Expression Vectors Market Size, By Region, 2013-2020 ($Thousand)
Table 22 North America: Other Insect Expression Vectors Market Size, By Country, 2013-2020 ($Thousand)
Table 23 Yeast Expression Vectors Market Size, By Type, 2013-2020 ($Million)
Table 24 Yeast Expression Vectors Market Size, By Region, 2013-2020 ($Million)
Table 25 North America: Yeast Expression Vectors Market Size, By Country, 2013-2020 ($Million)
Table 26 K. Lactis Expression Vectors Market Size, By Region, 2013-2020 ($Million)
Table 27 North America: K. Lactis Expression Vectors Market Size, By Country, 2013-2020 ($Million)
Table 28 P. Pastoris Expression Vectors Market Size, By Region, 2013-2020 ($Million)
Table 29 North America: P. Pastoris Expression Vectors Market Size, By Country, 2013-2020 ($Million)
Table 30 S. Cerevisiae Expression Vectors Market Size, By Region, 2013-2020 ($Million)
Table 31 North America: S. Cerevisiae Expression Vectors Market Size, By Country, 2013-2020 ($Million)
Table 32 Other Yeast Expression Vectors, By Region, 2013-2020 ($Thousand)
Table 33 North America: Market Size for Other Yeast Systems, By Country, 2013-2020 ($Thousand)
Table 34 Other Market Size, By Region, 2013-2020 ($Million)
Table 35 North America: Other Expression Vectors Market Size, By Country, 2013-2020 ($Million)
Table 36 Market Size, By Application, 2013-2020 ($Million)
Table 37 Market Size for Therapeutic Applications, By Region, 2013-2020 ($Million)
Table 38 North America: Market Size for Therapeutic Applications, By Country, 2013-2020 ($Million)
Table 39 Market Size for Research Applications, By Region, 2013-2020 ($Million)
Table 40 North America: Market Size for Research Applications, By Country, 2013-2020 ($Million)
Table 41 Market Size for Industrial Applications, By Region, 2013-2020 ($Million)
Table 42 North America: Market Size for Industrial Applications, By Country, 2013-2020 ($Million)
Table 43 Market Size, By End User, 2013-2020 ($Million)
Table 44 Market Size for Pharmaceutical and Biotechnology Companies, By Region, 2013-2020 ($Million)
Table 45 North America: Market Size for Pharmaceutical and Biotechnology Companies, By Region, 2013-2020 ($Million)
Table 46 Market Size for CROS and CMOS, By Region, 2013-2020 ($Million)
Table 47 North America: Market Size for CROS and CMOS, By Country, 2013-2020 ($Million)
Table 48 Market Size for Academic Research Institutes, By Region, 2013-2020 ($Million)
Table 49 North America: Market Size for Academic Research Institutes, By Country, 2013-2020 ($Million)
Table 50 Market Size for Other End Users, By Region, 2013-2020 ($Million)
Table 51 North America: Market Size for Other End Users, By Country, 2013-2020 ($Million)
Table 52 Market Size, By Region, 2013�2020 ($Million)
Table 53 North America: Market Size, By Country, 2013�2020 ($Million)
Table 54 North America: Market Size, By Host Type, 2013�2020 ($Million)
Table 55 North America: Bacterial Expression Vectors Market Size, By Type, 2013�2020 ($Million)
Table 56 North America: Mammalian Expression Vectors Market Size, By Type, 2013�2020 ($Million)
Table 57 North America: Yeast Expression Vectors Market Size, By Type, 2013�2020 ($Million)
Table 58 North America: Insect Expression Vectors Market Size, By Type, 2013�2020 ($Million)
Table 59 North America: Market Size, By Application, 2013�2020 ($Million)
Table 60 North America: Market Size, End User, 2013�2020 ($Million)
Table 61 U.S.: Market Size, By Host Type, 2013�2020 ($Million)
Table 62 U.S.: Bacterial Expression Vectors Market Size, By Type, 2013�2020 ($Million)
Table 63 U.S.: Mammalian Expression Vectors Market Size, By Type, 2013�2020 ($Million)
Table 64 U.S.: Yeast Expression Vectors Market Size, By Type, 2013�2020 ($Million)
Table 65 U.S.: Insect Expression Vectors Market Size, By Type, 2013�2020 ($Million)
Table 66 U.S.: Market Size, By Application, 2013�2020 ($Million)
Table 67 U.S.: Market Size, By End User, 2013�2020 ($Million)
Table 68 Canada: Market Size, By Host Type, 2013�2020 ($Million)
Table 69 Canada: Bacterial Expression Vectors Market Size, By Type, 2013�2020 ($Million)
Table 70 Canada: Mammalian Expression Vectors Market Size, By Type, 2013�2020 ($Million)
Table 71 Canada: Yeast Expression Vectors Market Size, By Type, 2013�2020 ($Million)
Table 72 Canada: Insect Expression Vectors Market Size, By Type, 2013�2020 ($Million)
Table 73 Canada: Market Size, By Application, 2013�2020 ($Million)
Table 74 Canada: Market Size, By End User, 2013�2020 ($Million)
Table 75 Europe: Market Size, By Host Type, 2013�2020 ($Million)
Table 76 Europe: Bacterial Expression Vectors Market Size, By Type, 2013�2020 ($Million)
Table 77 Europe: Mammalian Expression Vectors Market Size, By Type, 2013�2020 ($Million)
Table 78 Europe: Yeast Expression Vectors Market Size, By Type, 2013�2020 ($Million)
Table 79 Europe: Insect Expression Vectors Market Size, By Type, 2013�2020 ($Million)
Table 80 Europe: Market Size, By Application, 2013�2020 ($Million)
Table 81 Europe: Market Size, By End User, 2013-2020 ($Million)
Table 82 Asia: Market Size, By Host Type, 2013-2020 ($Million)
Table 83 Asia: Bacterial Expression Vectors Market Size, By Type, 2013-2020 ($Million)
Table 84 Asia: Mammalian Expression Vectors Market Size, By Type, 2013-2020 ($Million)
Table 85 Asia: Yeast Expression Vectors Market Size, By Type, 2013-2020 ($Million)
Table 86 Asia: Insect Expression Vectors Market Size, By Type, 2013-2020 ($Million)
Table 87 Asia: Market Size, By Application, 2013-2020 ($Million)
Table 88 Asia: Market Size, By End User, 2013-2020 ($Million)
Table 89 RoW: Market Size, By Host Type, 2013-2020 ($Million)
Table 90 RoW: Bacterial Expression Vectors Market Size, By Type, 2013-2020 ($Million)
Table 91 RoW: Mammalian Expression Vectors Market Size, By Type, 2013-2020 ($Million)
Table 92 RoW: Yeast Expression Vectors Market Size, By Type, 2013-2020 ($Million)
Table 93 RoW: Insect Expression Vectors Market Size, By Type, 2013-2020 ($Million)
Table 94 RoW: Market Size, By Application, 2013-2020 ($Million)
Table 95 RoW: Market Size, By End User, 2013-2020 ($Million)
Table 96 Parterships, Agreements and Collaborations, 2012-2015
Table 97 Expansions, 2012-2015
Table 98 Acquisitions, 2012-2015
Table 99 New Product Launches, 2012-2015
List of Figures (45 Figures)
Figure 1 Research Design
Figure 2 Market Size Estimation: Bottom-Up Approach
Figure 3 Market Size Estimation: Top-Down Approach
Figure 4 Breakdown of Primary Interviews: By Company Type, Designation, and Region
Figure 5 Data Triangulation Methodology
Figure 6 Market Snapshot, By Host Type (2015 vs. 2020)
Figure 7 CROS and CMOS Form the Fastest-Growing End-User Segment
Figure 8 Market, By Application (2015-2020): Therapeutic Applications to Witness Highest Growth
Figure 9 Global Market, By Region: North America Expected to Hold the Largest Share in 2015
Figure 10 Mammalian Expression Vectors Market to Grow at the Highest CAGR From 2015 to 2020
Figure 11 Therapeutic Applications Segment to Witness Highest Growth Rate in the Forecast Period
Figure 12 Pharmaceutical and Biotechnology Companies Command the Largest Share in 2015
Figure 13 Asia to Witness Highest Growth in the Forecast Period
Figure 14 Bacterial, Mammalian, and Insect Expression Vectors : Major Market Segments in 2015
Figure 15 Market Segmentation: By Host Type
Figure 16 Market Segmentation: By Application
Figure 17 Market Segmentation: By End User
Figure 18 Market Segmentation: By Region
Figure 19 Increase in Demand of Protein-Based Drugs to Propel the Market Growth
Figure 20 Mammalian Expression Vectors to Witness Significant Growth in the Forecast Period
Figure 21 Bacterial Expression Vectors to Dominate Expression Vectors Market in 2015
Figure 22 K. Lactis Expression Vectors to Witness Highest Growth
Figure 23 Therapeutic Applications: Fastest-Growing Application Segment
Figure 24 Therapeutic Applications: Asia to Show Highest Growth
Figure 25 End-User Base: Market
Figure 26 CROS and CMOS, A High-Growth End-User Segment in the Market
Figure 27 Asia- an Attractive Destination for All Applications
Figure 28 North America Holds the Largest Share of Global Market (2015)
Figure 29 European Market Snapshot
Figure 30 Asian Market to Grow at Highest CAGR
Figure 31 RoW Market Snapshot
Figure 32 Major Players Adopted Inorganic Growth Strategies for Development
Figure 33 Global Market Share Analysis, By Key Player, 2014.
Figure 34 Market Evolution Framework: Partnerships, Agreements and Collaborations and Expansions Fuelled the Market Growth
Figure 35 Battle for Market Share: Partnerships, Agreements and Collaborations Were the Key Strategies
Figure 36 Merck Millipore: Company Snapshot
Figure 37 Thermo Fisher Scientific, Inc.: Company Snapshot
Figure 38 Sigma-Aldrich Corporation: Company Snapshot
Figure 39 Promega Corporation: Company Snapshot
Figure 40 Takara Bio, Inc.: Company Snapshot
Figure 41 Agilent Technologies: Company Snapshot
Figure 42 Bio-Rad Laboratories: Company Snapshot
Figure 43 DNA2.0, Inc.: Company Snapshot
Figure 44 New England Biolabs: Company Snapshot
Figure 45 Qiagen: Company Snapshot

 Generating Response ...


Growth opportunities and latent adjacency in Expression Vectors Market