
Industrial Automation Market Size, Share and Trends

Industrial Control & Factory Automation Market Size, Share & Trends by Component (Industrial Control System, Software, CNC Controller, Industrial Robotics, Industrial 3D Printing, Process Analyzer, Industrial Communication, Field Instrumentation) - Global Forecast to 2030


INDUSTRIAL CONTROL & FACTORY AUTOMATION MARKET OVERVIEW

Source: Secondary Research, Interviews with Experts, MarketsandMarkets Analysis
The industrial automation market is estimated to be USD 274.99 billion in 2025 and is projected to reach USD 435.24 billion by 2030, at a CAGR of 9.6%. The industrial control & factory automation market is expanding as manufacturers modernize production lines to improve throughput, quality, and cost efficiency. Strong demand for industrial robotics, advanced control systems, and integrated industrial software is reshaping factory operations across the automotive, electronics, and process industries.Explore the industrial automation market including market size, regional share, key technologies, and leading companies such as Siemens, ABB, and Rockwell Automation.
KEY TAKEAWAYS
-
BY REGIONAsia Pacific is expected to dominate the industrial control & factory automation market with a 34.9% share in 2025.
-
BY COMPONENTBy component, the industrial 3D printing segment is expected to grow at a high CAGR of 15.3% in the industrial control & factory automation market from 2025 to 2030.
-
BY INDUSTRYThe automotive industry held the largest share of the industrial control & factory automation market in 2024.
-
Competitive Landscape - KEY PLAYERSFANUC Corporation, ABB, and Yaskawa Electric Corporation were identified as some of the star players in the industrial control & factory automation market, given their strong market share and product footprint.
-
Competitive Landscape - STARTUPS/SMESStäubli International AG, COMAU, and Estun Automation, Co., Ltd., among others, have distinguished themselves among startups and SMEs by securing strong footholds in specialized niche areas, underscoring their potential as emerging market leaders.
The industrial control and factory automation market is expanding steadily as manufacturers focus on improving productivity, operational visibility, and cost efficiency. Growing adoption of industrial robots, advanced control systems, and automation software is helping companies manage complex production processes and reduce reliance on manual labor. Integration of digital technologies such as industrial IoT, AI-driven analytics, and predictive maintenance is further enhancing system performance and uptime. In addition, increasing investments in smart manufacturing, safety compliance, and energy-efficient operations are sustaining long-term demand across industries.
TRENDS & DISRUPTIONS IMPACTING CUSTOMERS' CUSTOMERS
The industrial control & factory automation market is shifting from traditional control hardware–driven revenue toward new growth areas such as industrial sensors, robotics, machine vision, and industrial 3D printing. As automation suppliers expand into aerospace, automotive, electronics, food & beverages, pharmaceuticals, and semiconductor manufacturing, customer demand is increasingly shaped by digital imperatives. Technologies such as IoT-enabled systems, smart sensors, artificial intelligence, cloud computing, and machine learning are driving this transition, forcing vendors to realign revenue models toward data-driven, connected, and intelligent automation solutions.

Source: Secondary Research, Interviews with Experts, MarketsandMarkets Analysis
INDUSTRIAL CONTROL & FACTORY AUTOMATION MARKET DYNAMICS
Level
-
Increased adoption of IoT and AI in industrial environments

-
Government initiatives to promote industrial automation

Level
-
Lack of quick adaptability to changing scenario and intuitive decision-making

-
Security risks associated with cyber-physical systems

Level
-
Rising adoption of automation in industrial sector

-
Increased demand for safety compliance automation solutions

Level
-
Absence of standardization in industrial communication protocols and interfaces

-
Lack of precision due to differences between simulations and real life

Source: Secondary Research, Interviews with Experts, MarketsandMarkets Analysis
Driver: Increased adoption of IoT and AI in industrial environments
The growing adoption of IoT and AI technologies is transforming industrial control systems by enabling real-time monitoring, predictive maintenance, and data-driven decision-making. Connected sensors, controllers, and machines allow manufacturers to improve operational efficiency, reduce downtime, and enhance production quality. As factories move toward smart manufacturing, demand for intelligent automation platforms and advanced control solutions continues to rise.
Restraint: Lack of quick adaptability to changing scenario and intuitive decision-making
Many legacy industrial control systems are rigid and struggle to adapt quickly to changing production requirements or dynamic operating conditions. This limits manufacturers’ ability to respond in real time to disruptions, demand fluctuations, or process variability. The complexity of integrating advanced analytics and intuitive decision-support tools into existing systems further constrains automation adoption.
Opportunity: Rising adoption of automation in industrial sector
Industries are increasingly investing in automation solutions to address labor shortages, improve productivity, and maintain consistent product quality. Factory automation systems enable faster production cycles, higher throughput, and reduced operational costs across discrete and process industries. This trend creates strong growth opportunities for control hardware, industrial software, and automation services.
Challenge: Absence of standardization in industrial communication protocols and interfaces
The lack of standardized communication protocols across industrial devices leads to interoperability challenges and complex system integration. Manufacturers often rely on proprietary interfaces, increasing deployment time and integration costs. This fragmentation limits scalability and slows the adoption of fully connected and flexible factory automation environments.
INDUSTRIAL CONTROL & FACTORY AUTOMATION MARKET SIZE, SHARE AND TRENDS: COMMERCIAL USE CASES ACROSS INDUSTRIES
| COMPANY | USE CASE DESCRIPTION | BENEFITS |
|---|---|---|
 |
Implemented an industrial robotics and HMI-based automation solution to improve material handling and production efficiency at a domestic manufacturing facility impacted by supply chain disruptions | Increased capacity utilization from 70% to 95%, improved productivity, supported domestic manufacturing expansion, and enabled cost-effective automation |
 |
Deployed a MicroSCADA system to monitor and control the power network for Bangkok’s Pink and Yellow monorail lines under the Mass Rapid Transit (MRT) project | Enabled real-time power monitoring, faster fault detection and recovery, improved reliability, and ensured uninterrupted operation of critical urban rail infrastructure |
 |
Implemented a Manufacturing Execution System (MES) to connect shop-floor operations with enterprise systems in tire manufacturing facilities | Reduced information silos, improved process standardization, enhanced decision-making, and increased overall production efficiency |
 |
Implemented ABB Ability Asset Performance Management (APM) to enable predictive, condition-based maintenance across hydropower plants | Reduced unplanned downtime, optimized maintenance costs, extended asset life, and improved operational reliability and energy efficiency |
 |
Deployed the EcoStruxure platform to optimize energy management and process control in large-scale cement manufacturing operations | Reduced labor intensity by 60%, improved energy efficiency by ~10%, lowered energy use per unit by 3–5%, achieved rapid ROI, and enhanced sustainability compliance |
Logos and trademarks shown above are the property of their respective owners. Their use here is for informational and illustrative purposes only.
MARKET ECOSYSTEM
The industrial control & factory automation ecosystem is built on strong collaboration between technology providers, software and solution vendors, and end-use industries. Hardware-focused players supply core control systems, robotics, sensors, and communication infrastructure, while software providers enable connectivity, analytics, and enterprise integration. End-use industries, such as energy, chemicals, food and beverages, aerospace, and automotive, drive demand by adopting automation to improve productivity, safety, and operational efficiency across manufacturing and process environments.

Logos and trademarks shown above are the property of their respective owners. Their use here is for informational and illustrative purposes only.
INDUSTRIAL CONTROL & FACTORY AUTOMATION MARKET SEGMENTS

Source: Secondary Research, Interviews with Experts, MarketsandMarkets Analysis
Industrial Control & Factory Automation Market, By Component
Industrial 3D printing is expected to grow at a high CAGR as manufacturers increasingly adopt additive manufacturing for tooling, prototyping, and low-volume production. The technology enables faster design iterations, reduced material waste, and greater flexibility in producing complex components. Its integration with automation systems and digital manufacturing workflows is further supporting adoption across industrial environments. As costs decline and material capabilities expand, industrial 3D printing is becoming an important component of advanced factory automation.
Industrial Control & Factory Automation Market, By Industry
The automotive segment is expected to capture the largest share of the industrial control & factory automation market due to its high level of automation across production and assembly lines. Automakers rely heavily on robotics, PLCs, vision systems, and industrial software to improve efficiency, quality, and throughput. The shift toward electric vehicles and smart manufacturing is accelerating investments in advanced control and automation technologies. Continuous focus on cost reduction and production scalability further strengthens the automotive industry’s dominance in the market.
REGION
Asia Pacific to grow at a high rate in industrial control & factory automation market during forecast period
The Asia Pacific is projected to grow at a high rate in the industrial control & factory automation market, supported by the rising adoption of automation across manufacturing and process industries. Increasing deployment of advanced control systems, industrial robotics, and connected technologies is helping manufacturers improve efficiency and production quality. Growing investments in new production facilities and the modernization of existing plants are further driving demand. The region’s large manufacturing base and focus on cost-effective automation continue to support strong market expansion.

INDUSTRIAL CONTROL & FACTORY AUTOMATION MARKET SIZE, SHARE AND TRENDS: COMPANY EVALUATION MATRIX
ABB and FANUC Corporation emerge as the star players in the industrial control & factory automation market based on their strong positioning in industrial robotics. This is supported by broad robot portfolios, advanced motion control capabilities, and deep integration with automation systems. Their extensive deployment across automotive, electronics, metals, and general manufacturing has enabled them to achieve a high market share and a strong product footprint. Continuous innovation in collaborative robots, high-speed assembly robots, and digitally integrated robotics platforms further reinforces their leadership in driving large-scale robot adoption across global industrial environments.

Source: Secondary Research, Interviews with Experts, MarketsandMarkets Analysis
KEY MARKET PLAYERS
- ABB (Switzerland)
- Emerson Electric Co. (US)
- Siemens (Germany)
- Schneider Electric (France)
- Mitsubishi Electric Corporation (Japan)
- GE Vernova (US)
- Rockwell Automation (US)
- Honeywell International Inc. (US)
- Yokogawa Electric Corporation (Japan)
- OMRON Corporation (Japan)
- FANUC CORPORATION (Japan)
- ONLY THE FIRST FIVE NEED TO BE HYPERLINKED!
MARKET SCOPE
| REPORT METRIC | DETAILS |
|---|---|
| Market Size in 2024 (Value) | USD 254.62 Billion |
| Market Forecast in 2030 (Value) | USD 435.24 Billion |
| Growth Rate | CAGR of 9.6% from 2025 to 2030 |
| Years Considered | 2021–2030 |
| Base Year | 2024 |
| Forecast Period | 2025–2030 |
| Units Considered | Value (USD Million/Billion), Volume (Thousand Units) |
| Report Coverage | Revenue Forecast, Company Ranking, Competitive Landscape, Growth Factors, and Trends |
| Segments Covered |
|
| Regional Scope | North America, Europe, Asia Pacific, RoW |
WHAT IS IN IT FOR YOU: INDUSTRIAL CONTROL & FACTORY AUTOMATION MARKET SIZE, SHARE AND TRENDS REPORT CONTENT GUIDE

DELIVERED CUSTOMIZATIONS
We have successfully delivered the following deep-dive customizations:
| CLIENT REQUEST | CUSTOMIZATION DELIVERED | VALUE ADDS |
|---|---|---|
| Comprehensive Ecosystem Mapping of Industrial Control & Automation | Conducted detailed mapping of the automation ecosystem covering control systems, industrial software, robotics, instrumentation, safety systems, and industrial communication technologies across key manufacturing sectors | Delivers holistic clarity on ecosystem structure, interdependencies, and emerging growth pockets, supporting informed market-entry and expansion strategies |
| Competitive Benchmarking of Global Automation Vendors | Evaluated leading automation providers based on product breadth, control architecture, robotics integration, software capabilities, regional presence, and end-user adoption | Enhances competitive intelligence, enables objective vendor comparison, and supports strategic partnership and acquisition decision-making |
| Industry-Specific and Application-Level Opportunity Assessment | Analyzed automation demand and high-value use cases across automotive, oil & gas, chemicals, pharmaceuticals, food & beverages, and semiconductor manufacturing | Identifies revenue-generating opportunities, prioritizes target industries, and sharpens go-to-market focus |
| Technology Roadmap and Adoption Maturity Analysis | Assessed adoption maturity of IIoT, AI-enabled automation, digital twins, robotics, and edge-cloud architectures across industrial environments | Supports technology investment planning and helps clients align automation strategies with long-term digital transformation goals |
| Cost Structure, Pricing, and Deployment Barrier Analysis | Examined system pricing, integration costs, legacy system compatibility, cybersecurity risks, and workforce skill constraints impacting automation adoption | Enables optimized pricing strategies, smoother deployment planning, and proactive risk mitigation |
RECENT DEVELOPMENTS
- December 2025 : ABB announced the acquisition of UK-based IPEC to strengthen its data center and industrial monitoring capabilities. IPEC’s AI-driven electrical diagnostics technology enhances ABB’s predictive maintenance portfolio by enabling early fault detection, reducing downtime, lowering maintenance costs, and improving asset reliability across critical infrastructure sectors.
- November 2025 : Dangote Petroleum Refinery selected Honeywell to supply advanced refining technologies, automation solutions, catalysts, and services to expand production capacity at its Lekki facility in Nigeria. Honeywell’s solutions will help double refinery throughput, improve efficiency, reduce operational costs, and support large-scale, reliable process automation at one of the world’s largest refining complexes.
- June 2025 : Yokogawa Electric Corporation entered a long-term collaboration with Shell Global Solutions to integrate robotics, drones, machine vision, and AI into plant monitoring and maintenance. The partnership incorporates Shell’s Operator Round by Exception (ORE) technology into Yokogawa’s OpreX Robot Management Core, enabling autonomous inspection, improved asset integrity management, and safer operations across energy and chemical facilities.
- February 2025 : Mitsubishi Electric launched the MELFA RH-10CRH and RH-20CRH SCARA robot series to support digital manufacturing and address skilled labor shortages. The new robots offer high-speed operation, compact design, battery-less motors, and simplified installation, improving productivity, reducing maintenance costs, and enabling flexible automation in space-constrained manufacturing environments.
FAQ
1. What is the current size and growth forecast of the industrial automation market?
The global industrial automation market has grown significantly over the last decade as industries invest in robotics, control systems, sensors, and smart manufacturing solutions. In 2024, the market size was estimated at around USD 200–220 billion, and it is projected to grow at a CAGR of approximately 8–10 % through 2030, driven by increasing adoption of Industry 4.0 technologies, digital transformation initiatives, and demand for operational efficiency across manufacturing sectors.
2. Which regions hold the largest share of the industrial automation market?
Asia Pacific currently holds the largest regional share of the industrial automation market due to strong manufacturing bases in China, Japan, South Korea, and India, along with growing investments in smart factories and robotics. North America and Europe also command significant shares, supported by advanced automation adoption in automotive, electronics, pharmaceuticals, and food & beverage industries.
3. What are the key segments within the industrial automation market?
The industrial automation market is broadly segmented by component, technology, end-use industry, and geography. Major technology segments include:
-
Robotics & Intelligent Systems
-
Distributed Control Systems (DCS)
-
Programmable Logic Controllers (PLC)
-
Human Machine Interface (HMI)
-
Sensors & Actuators
-
Industrial IT & Software Solutions
Software and analytics, including MES (Manufacturing Execution Systems) and SCADA (Supervisory Control and Data Acquisition), are increasingly significant as manufacturers adopt digital automation to optimize operations and quality control.
4. Which industries are the primary adopters of industrial automation?
Key industry adopters include:
-
Automotive (robotic assembly, welding, painting)
-
Electronics & Semiconductors (precision automation, component handling)
-
Oil & Gas, Chemicals & Petrochemicals (process automation, safety systems)
-
Food & Beverage (packaging, inspection systems, traceability)
-
Pharmaceuticals (cleanroom automation, compliant systems)
These sectors invest heavily in automation to reduce costs, enhance precision, improve safety, and meet stringent quality standards.
5. Who are the major companies leading the industrial automation market?
The industrial automation market is highly competitive and features several large multinational corporations known for hardware, software, and integrative solutions:
-
Siemens AG – Offers comprehensive automation portfolios including PLCs, DCS, drives, and industrial software
-
ABB Ltd. – Provides robotics, motion control, electrification, and industrial digital solutions
-
Rockwell Automation – Focuses on industrial control systems, PLCs, and automation software
-
Schneider Electric – Delivers automation systems, PLCs, and energy management solutions
-
Mitsubishi Electric – Known for factory automation products and robotics
Other notable players include Bosch Rexroth, Honeywell, Emerson Electric, Fanuc, and Yokogawa Electric, which compete through innovation, digital offerings, and services to support industrial customers worldwide.
Table of Contents
 Exclusive indicates content/data unique to MarketsandMarkets and not available with any competitors.
Methodology
The study involved major activities in estimating the current market size for the industrial control & factory automation market. Exhaustive secondary research was done to collect information on the industrial control & factory automation industry. The next step was to validate these findings, assumptions, and sizing with industry experts across the value chain using primary research. Different approaches, such as top-down and bottom-up, were employed to estimate the total market size. After that, the market breakup and data triangulation procedures were used to estimate the market size of the segments and subsegments of the industrial control & factory automation market.
Secondary Research
The market for the companies offering industrial control & factory automation solutions is arrived at by secondary data available through paid and unpaid sources, analyzing the product portfolios of the major companies in the ecosystem, and rating the companies by their performance and quality. Various sources were referred to in the secondary research process to identify and collect information for this study. The secondary sources include annual reports, press releases, investor presentations of companies, white papers, journals, certified publications, and articles from recognized authors, directories, and databases. In the secondary research process, various secondary sources were referred to for identifying and collecting information related to the study. Secondary sources included annual reports, press releases, and investor presentations of blockchain vendors, forums, certified publications, and whitepapers. The secondary research was used to obtain critical information on the industry's value chain, the total pool of key players, market classification, and segmentation from the market and technology-oriented perspectives.
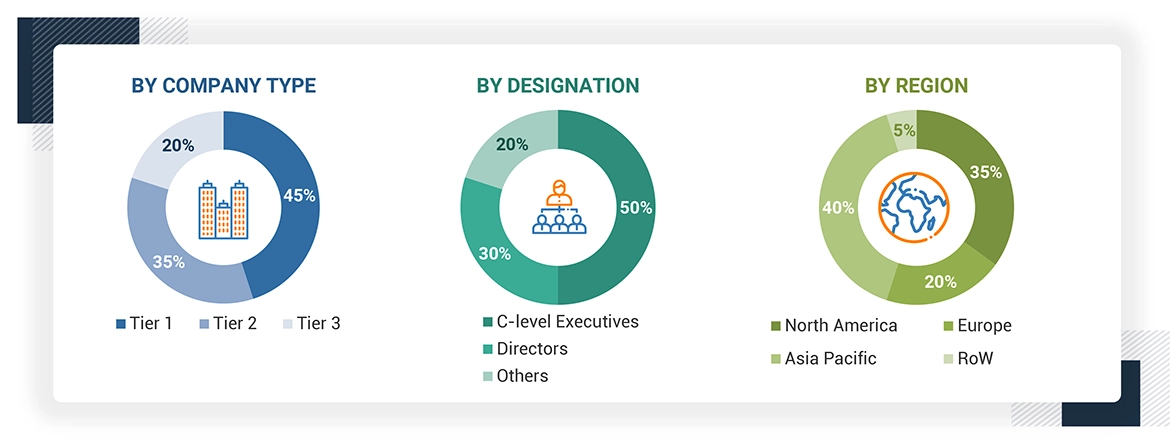
Primary Research
Extensive primary research has been conducted after understanding and analyzing the current scenario of the industrial control & factory automation market through secondary research. Several primary interviews have been conducted with the key opinion leaders from the demand and supply sides across four main regions—North America, Europe, Asia Pacific, and the Rest of Europe. Approximately 25% of the primary interviews were conducted with the demand-side respondents, while approximately 75% were conducted with the supply-side respondents. The primary data has been collected through questionnaires, emails, and telephone interviews.
After interacting with industry experts, brief sessions were conducted with highly experienced independent consultants to reinforce the findings from our primary. This, along with the in-house subject matter experts’ opinions, has led us to the findings as described in the remainder of this report. The breakdown of primary respondents is as follows:
About the assumptions considered for the study, To know download the pdf brochure
Market Size Estimation
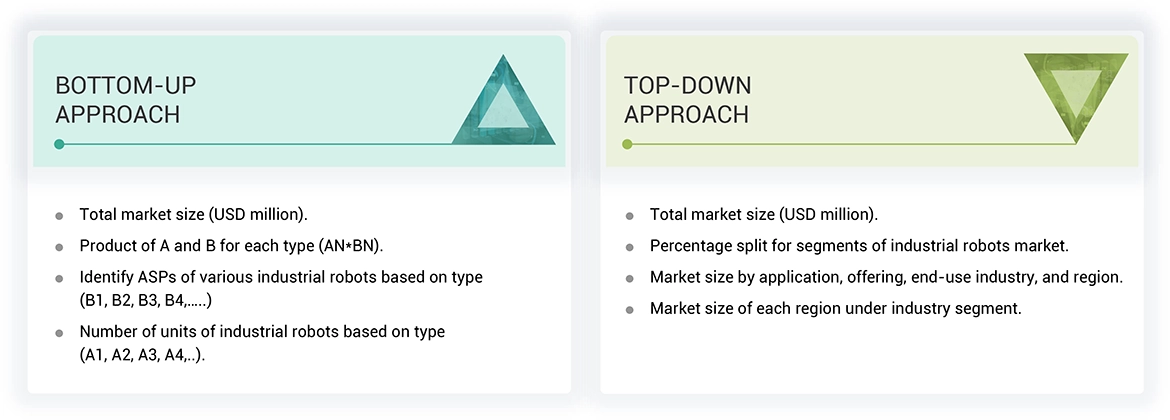
Both top-down and bottom-up approaches wete used to estimate and validate the total size of the industrial control & factory automation market. These methods were also used extensively to estimate the size of various subsegments in the market. The research methodology used to estimate the market size includes the following:
Industrial Control & Factory Automation Market : Top-Down and Bottom-Up Approach
Data Triangulation
After arriving at the overall market size using the market size estimation processes as explained above, the market was split into several segments and subsegments. The data triangulation and market breakdown procedures were employed, wherever applicable, to complete the overall market engineering process and arrive at the exact statistics of each market segment and subsegment. The data was triangulated by studying various factors and trends from the demand and supply sides.
Market Definition
Industrial control & factory automation is a highly digitalized and connected production system that can self-optimize performance across a broad network, self-adapt in various conditions in real time, and autonomously run an entire production process. The major advantage of industrial control & factory automation is its ability to evolve with the changing needs of organizations. Industrial control & factory automation uses a network to connect the virtual and physical elements of production processes to actual manufacturing operations. It helps to create an autonomous manufacturing environment that can handle any technical issues during real-time production, using fragmented information and communication structures to optimize production processes.
Key Stakeholders
- End users
- Government bodies, venture capitalists, and private equity firms
- Manufacturers of industrial control & factory automation components
- Distributors of industrial control & factory automation components and solutions
- Industrial control & factory automation industry associations
- Professional service/solution providers
- Research institutions and organizations
- Standards organizations and regulatory authorities related to the industrial control & factory automation market
- System integrators
- Technology consultants
Report Objectives
- To describe and forecast the industrial control and factory automation market, in terms of value, based on component , and industry
- To forecast the industrial control and factory automation market, in terms of volume, by component
- To forecast the market size, in terms of value, for four main regions—North America, Europe, Asia Pacific, and the RoW.
- To provide detailed information regarding drivers, restraints, opportunities, and challenges influencing the market growth
- To provide a detailed overview of the value chain of the industrial control and factory automation ecosystem
- To strategically analyze micromarkets1 with respect to individual growth trends, prospects, and contributions to the total market
- To provide a detailed overview of the industrial control and factory automation market value chain
- To provide an ecosystem analysis, case study analysis, key conferences, patent analysis, trade analysis, technology analysis, average selling price (ASP) analysis, Porter’s five forces analysis, buying criteria, and regulations pertaining to the market
- To track and analyze competitive developments undertaken by key players in the industrial control and factory automation market
- To profile key players and analyze their market share, core competencies2, and detailed competitive landscape for market leaders
- To benchmark market players using the company evaluation matrix, analyzing players based on various parameters within broad business categories and product strategies.
- To analyze strategies, such as product launches, acquisitions, partnerships, and expansions, adopted by the players in the industrial control and factory automation market
- To study the impact of AI on the market under study, along with the macroeconomic outlook for each region
Available Customizations
With the given market data, MarketsandMarkets offers customizations according to the specific requirements of companies. The following customization options are available for the report:
- Detailed analysis and profiling of additional market players based on various blocks of the supply chain
Need a Tailored Report?
Customize this report to your needs
Get 10% FREE Customization
Customize This ReportPersonalize This Research
- Triangulate with your Own Data
- Get Data as per your Format and Definition
- Gain a Deeper Dive on a Specific Application, Geography, Customer or Competitor
- Any level of Personalization
Let Us Help You
- What are the Known and Unknown Adjacencies Impacting the Industrial Control & Factory Automation Market
- What will your New Revenue Sources be?
- Who will be your Top Customer; what will make them switch?
- Defend your Market Share or Win Competitors
- Get a Scorecard for Target Partners

Custom Market Research Services
We Will Customise The Research For You, In Case The Report Listed Above Does Not Meet With Your Requirements
Get 10% Free Customisation


Growth opportunities and latent adjacency in Industrial Control & Factory Automation Market