Floating Production Systems Market by Types (FPSO, TLP, Spar, Barge, Others), Water Depth (Shallow, Deep, and Ultra Deep), Build (New and Converted) & Geography - Global Trends and Forecasts to 2018


[275 Pages Report] Floating production systems are essential tools for offshore oil and gas developments which are solely dependent on these systems. They are used for drilling and exploration activities in offshore oil and gas production at all depths. They are of various shapes, ranging from ship shape, cylindrical spar shape, or semi submersible multi-hull shaped. They are used extensively across the globe wherever offshore drilling activities are taking place. These systems are of different types such as Floating Production Storage and Offloading (FPSO), Tension Leg Platform (TLP), spar, barge, and others. The build of floating production system depend on factors such as economic viability, drilling condition, and the need for custom-builds and generic production systems. The floating production systems market is directly dependant on offshore drilling activities carried out across the globe. The increase in demand for crude oil and the potential in oil and gas sources in offshore areas are compelling companies to drill at high depths and enter deep and ultra-deep waters. These are some of the key driving factors for the industry.
The industry is segmented on the basis of their types which include Floating Production Storage and Offloading (FPSO), Tension Leg Platform (TLP), spar, barge, and others. Secondly, the global floating production systems market is also segmented on the basis of the water depth that they operate at, which includes shallow, deep, and Ultra-deep waters. The third segment is by build which is either new or converted. Lastly, the market is segmented on the basis of regions such as North America, Asia-Pacific, Europe, Latin America, Africa, and the Middle East. Each segment has been analyzed with respect to its market trends, growth trends, and future prospects. The data has been analyzed from 2011 to 2018, and all quantitative data regarding segmentation is mentioned in terms of value ($million).
Huge market with estimated value of $35.4 billion by 2018
The global floating production systems market value is expected to reach $35.4 billion by 2018, growing at a CAGR of 18.9% from 2013 to 2018. The critical factors responsible for the growth of the industry include growth in offshore drilling activities globally, rise in offshore deep-drilling activities, and growing investments in offshore technologies. The key concerns in the industry pertain to environmental impacts and damages..
Floating Production Systems Market: by Revenue, 2011-2018
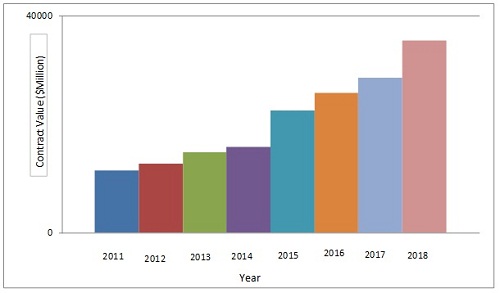
Source: MarketsandMarkets Analysis
The floating production systems market is also analyzed with respect to Porter's Five Force model. Different market forces such as threat from suppliers, threat from buyers, degree of competition, threat from substitutes, and threat from new entrants, are analyzed with respect to the industry. The report also provides a competitive landscape of major market players that includes developments, mergers & acquisition, expansion & investments, agreements & contracts, new technologies developments, and others. A number of these developments are spotted by key industry players that suggest the growth strategy of these companies as well as of the overall industry.
The report classifies and defines the contract value for the industry. It covers qualitative data of different types floating production systems. The report also provides a comprehensive review of major market drivers, restraints, opportunities, winning imperatives, and key burning issues in the floating production systems market. Key players in the industry are profiled in detail with their recent developments. Some of these include companies such as Samsung Heavy Industries (South Korea), Hyundai Heavy Industries Corporation Ltd. (South Korea), Keppel Offshore & Marine (Singapore), Malaysia Marine and Heavy Engineering Sdn Bhd (Malaysia), Daewoo Shipbuilding & Marine Engineering Co. Ltd. (South Korea), and Technip S.A. (France).
Additional Offer/Customization Option:
Customize to get comprehensive industry standard and deep dive analysis of the following parameters:
Vessel outlook
- Fleet of key operators in different geographies and their production and storage capacities
- New-build order book by major shipyards
Current Offshore Projects development
- Offshore field development projects currently being carried out globally by:
- Shallow water
- Deepwater
- Ultra-deepwater
Geographical comparison outlook
- Current fleet of FPS systems that are used by oil & gas operators in different geographies:
- North America
- Latin America
- Europe
- Asia-Pacific
Exploration & Production Activity
- Current and historical exploration and production spending of major oil & gas operators
- Current and historical offshore drilling activities of major countries of below mentioned regions:
- North America
- South America
- Africa
- Europe
- Asia-Pacific
The global floating production systems market is estimated to reach $35.4 billion by 2018, with a projected CAGR of 18.9%, signifying a high demand for these products and growth in offshore drilling activities.
Floating production systems are used for offshore drilling and exploration activities along with some storage and offloading applications. They are used globally for offshore oil and gas developments. The high demand for crude oil, along with the rise in offshore production is driving the floating production systems market. The increase in the number of investments from operators, especially for deep and ultra-deep waters fuels the growth of the industry. FPSO dominates the global market with its versatility. The major geographic regions of the market are Latin America, the Gulf of Mexico, and Western Africa, where most of the offshore drilling activities take place.
Growing Offshore CAPEX: Driver of floating production systems market
The global floating production systems market has witnessed a decent growth, based on the increasing demand for global energy, and the rise in the number of investments from operators and deep-water drilling activities. The biggest markets, based on geography for these systems are Latin America, Asia-Pacific, Africa, and Europe.
Floating Production Systems: Market Share, By Geography, 2013
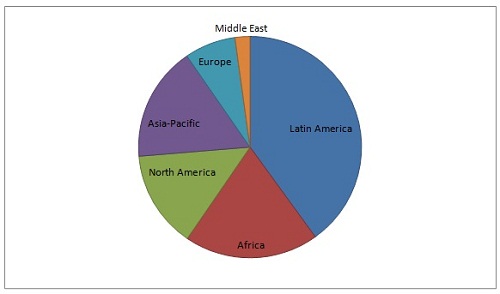
Source: MarketsandMarkets Analysis
Samsung Heavy Industries (South Korea), Hyundai Heavy Industries Corporation Ltd. (South Korea), Keppel Offshore & Marine (Singapore), Malaysia Marine and Heavy Engineering Sdn Bhd (Malaysia), Daewoo Shipbuilding & Marine Engineering Co. Ltd. (South Korea), and Technip S.A. (France), are the major players that constitute a major share of the global floating production systems market.
Agreements and collaborations: Key strategy
Most of these companies mainly rely on growth strategies such as new-product launch, joint ventures & contracts, mergers & acquisitions, and investments & expansions in diversified geographic areas. The capital expenditure and operating expenditure of the exploration & production industry are huge in terms of value. To increase their geographical presence and market penetration, the companies have opted for agreements & collaborations.
The major floating production systems types include FPSO, TLP, spar, barge, and others. FPSOs are the largest type in terms of orders booked.
 Exclusive indicates content/data unique to MarketsandMarkets and not available with any competitors.
Table Of Contents
1 Introduction (Page No.-21)
1.1 Key Objectives
1.2 Analyst Insights
1.3 Market Investment Analysis
1.4 Report Description
1.5 Market Definitions
1.6 Market Segmentation and Market Aspects Covered
1.7 Stakeholders
1.8 Research Methodology
1.8.1 Approach
1.8.2 Market Size Estimation
1.8.3 Market Crackdown and Data Triangulation
1.8.4 Key Data Points Taken From Secondary Sources
1.8.5 Key Secondary Sources Used
1.8.6 Key Data Points Taken From Primary Sources
1.8.7 Assumption Made For This Report
2 Executive Summary (Page No.-36)
3 Market Overview (Page No.-38)
3.1 Introduction
3.2 History & Evolution
3.3 Market Statistics
3.3.1 Global Floating Production Systems Market
3.3.2 Submarkets
3.3.2.1 Growth Trends For Types of Floating Production System
3.3.2.2 Growth Trend For Floating Production Systems
3.3.2.3 Growth Trend For Different Regions
3.3.2.4 Country-Wise Analysis of Different Regions
3.3.2.5 Build-Wise Analysis
3.3.3 Related Markets
3.3.3.1 offshore Support Vessels Market
4 Market Analysis (Page No.-51)
4.1 Introduction
4.2 Market Dynamics
4.2.1 Drivers
4.2.1.1 Increasing Demand of Crude Oil
4.2.1.2 Increased Focus on offshore Exploration & Production
4.2.2 Restraints
4.2.2.1 Increasing Mishaps Leading to Oil Spills
4.2.3 Opportunities
4.2.3.1 Discoveries Supporting Deepwater Drilling
4.2.3.2 Growing Offshore Investments With Emerging Technologies
4.3 Winning Imperatives
4.3.1 Focus on Specialized Offshore Vessels
4.3.2 Shared Risk and Growth
4.4 Burning Issues
4.4.1 Lack of Skilled Professionals
4.4.2 Geopolitical Risks
4.5 Value Chain Analysis
4.5.1 Raw-Material Manufacturers
4.5.2 Shipyard
4.5.3 Suppliers and Operators
4.5.4 Field Operators
4.6 SWOT Analysis
4.6.1 SWOT Analysis of Major Companies
4.6.1.1 BUMI Armada Berhad (Malaysia)
4.6.1.2 Daewoo Shipbuilding & Marine Engineering Co. Ltd.
4.6.1.3 Hyundai Heavy Industries
4.6.1.4 Keppel Offshore and Marine Ltd.
4.6.1.5 Malaysian Marine and Heavy Engineering Holdings Berhad
4.6.1.6 Mitsubishi Heavy Industries Corporation Ltd.
4.6.1.7 Pipavav Defense and Offshore Engineering Company Ltd.
4.6.1.8 Samsung Heavy Industries Ltd.
4.6.1.9 SBM Offshore
4.6.1.10 Technip S.A
4.6.1.11 Teekay Corporation
4.7 Porter�s Five-Forces Model
4.7.1 Threat of New Entrants
4.7.2 Threat of Substitute Products
4.7.3 Bargaining Power of Buyers
4.7.4 Bargaining Power of Suppliers
4.7.5 Degree of Competition
5 Floating Production Systems Market, By Type (Page No.-82)
5.1 Industry Overview
5.1.1 Classification of Floating Production Systems
5.1.1.1 Floating Production Storage offloading (FPSO)
5.1.1.2 Tension Leg Platform (TLP)
5.1.1.3 SPAR
5.1.1.4 Barge
5.1.1.5 Others (MOPU)
5.2 Market Analysis of Floating Production Systems in the Planning Stage, By Type
5.2.1 Introduction
5.3 Market Analysis of Floating Production System Installations, By Type
5.3.1 Introduction
5.4 Market Analysis, By Type
5.5 Floating Production Storage and Offloading
5.5.1 Overview
5.5.2 FPSO Market With Respect to Water Depth
5.5.2.1 Introduction
5.5.2.2 Shallow Waters Leads FPSO Market
5.5.2.2.1 Forecast & Value
5.5.3 FPSO Market With Respect to Build
5.5.3.1 Introduction
5.5.3.2 New Builds Have High Orders Booked
5.5.3.2.1 Forecast & Value
5.6 Tension Leg Platform
5.6.1 Overview
5.6.2 TLP Market With Respect to Water Depth
5.6.2.1 Introduction
5.6.2.2 Deep Water Leads TLP Market
5.6.2.2.1 Forecast & Value
5.6.3 TLP Market With Respect to Build
5.6.3.1 Introduction
5.6.3.2 New Build Projected to Have High Orders Booked
5.6.3.2.1 Forecast & Value
5.7 SPAR
5.7.1 Overview
5.7.2 SPAR Market With Respect to Water Depth
5.7.2.1 Introduction
5.7.2.2 Deep-Water Leads SPAR Market
5.7.2.2.1 Forecast & Value
5.7.3 SPAR Market With Respect to Build
5.7.3.1 Introduction
5.7.3.2 Largest Market By Build
5.7.3.2.1 Forecast & Value
5.8 Barge
5.8.1 Overview
5.8.2 Barge Market With Respect to Water Depth
5.8.2.1 Introduction
5.8.2.2 Deep-Water Leads Barge Market
5.8.2.2.1 Forecast & Value
5.8.3 Barge Market With Respect to Build
5.8.3.1 Introduction
5.8.3.2 Largest Market By Build
5.8.3.2.1 Forecast & Value
5.9 Others
5.9.1 Overview
5.9.2 Others Market With Respect to Water Depth
5.9.2.1 Introduction
5.9.2.2 Largest Market By Water Depth
5.9.2.2.1 Forecast & Value
5.9.3 Others Market With Respect to Build
5.9.3.1 Introduction
5.9.3.2 Largest Market By Build
5.9.3.2.1 Forecast & Value
6 Floating Production Systems Market, By Geography (Page No.-124)
6.1 Introduction
6.2 Market Analysis of Floating Production System in the Planning Stage, By Geography 128
6.2.1 Introduction
6.3 Market Analysis of FPS Installations, By Geography
6.3.1 Introduction
6.4 Market Analysis By Geographical Areas
6.5 Country-Wise Analysis of FPS
6.5.1 Latin America
6.5.1.1 Introduction
6.5.2 Africa
6.5.2.1 Introduction
6.5.3 Asia-Pacific
6.5.3.1 Introduction
6.5.4 North America
6.5.4.1 Introduction
6.5.5 Europe
6.5.5.1 Introduction
6.5.6 Middle East
6.5.6.1 Introduction
7 Floating Production Systems Market By Water Depth (Page No.-148)
7.1 Industry Overview
7.2 Market Analysis of Floating Production System in the Planning Stage, By Water Depth
7.2.1 Introduction
7.3 Market Analysis of Floating Production System Installations, By Water Depth
7.3.1 Introduction
7.4 Market Analysis By Water Depth
7.4.1 Shallow-Water Floating Production Systems
7.4.1.1 Introduction
7.4.1.2 Analysis
7.4.2 Deep-Water Floating Production System
7.4.2.1 Introduction
7.4.2.2 Analysis
7.4.3 Ultra-Deep-Water Floating Production Systems
7.4.3.1 Introduction
7.4.3.2 Analysis
8 Floating Production Systems Market By Build (Page No.-167)
8.1 Industry Overview
8.2 Market Analysis Floating Production System Market in the Planning Stage, By Build
8.2.1 Introduction
8.3 Market Analysis of FPS Installations, By Build
8.3.1 Introduction
8.4 Market Analysis By Build
8.4.1 New Build FPS
8.4.1.1 Introduction
8.4.1.2 Analysis
8.4.2 Converted FPS
8.4.2.1 Introduction
8.4.2.2 Analysis
9 Competitive Landscape (Page No.-183)
9.1 Introduction
9.2 Key Players of the Floating Production Systems Market
9.2.1 List of Key Players
9.3 Growth Strategies in the FPS Market
9.4 Most Active Companies in the FPS Market
9.5 Market Share Analysis and Rankings
9.5.1 Market Share Scenario
9.5.2 Market Rankings of the Industry Players
9.6 Contract Awardings
9.7 Agreements & Collaborations
9.8 New-Product/Technology Development
9.9 Joint Ventures
9.10 Other Developments
10 Company Profile (Company At A Glance, Recent Financials, Products & Services, Strategies & Insights, & Recent Developments)* (Page No.-213)
10.1 BUMI Armada Berhad
10.2 Daewoo Shipbuilding & Marine Engineering Co. Ltd.
10.3 Hyundai Heavy Industries Co. Ltd.
10.4 Keppel Offshore and Marine Ltd.
10.5 Malaysia Marine and Heavy Engineering Sdn Bhd
10.6 Mitsubishi Heavy Industries Corporation
10.7 Pipavav Defence and Offshore Engineering Company Ltd.
10.8 Samsung Heavy Industries Co. Ltd.
10.9 SBM Offshore
10.10 Technip S.A.
10.11 Teekay Corporation
*Details on Company At A Glance, Recent Financials, Products & Services, Strategies & Insights, & Recent Developments Might Not Be Captured in Case of Unlisted Companies.
List of Tables (86 Tables)
Table 1 Recent Investments, 2013-2014
Table 2 OSV: Market Size, By Type, 2011�2018 ($Million)
Table 3 Floating Production Systems (FPS): Advantages Overview
Table 4 World Demand of Crude Oil By Geography
Table 5 Global Offshore Wells Drilled By Regions, 2011-2013
Table 6 Oil Spills Around the World (2010-2013)
Table 7 Floating Production Systems Market, By Type
Table 8 Global Floating Production Systems in the Planning Stage, By Type, 2013-2018 (Units)
Table 9 Global FPS Installations, By Type, 2011-2018 (Units)
Table 10 Global FPS Installations, By Type, 2011-2018 ($Million)
Table 11 Global Floating Production Systems Orders Booked, By Type, 2011-2018 (Units)
Table 12 Global FPS contract Value, By Type, 2011-2018 ($Million)
Table 13 FPSO: Orders Booked, By Water Depth, 2011-2018 (Units)
Table 14 FPSO:Contract Value, By Water Depth, 2011-2018 ($Million)
Table 15 FPSO: Orders Booked, By Build, 2011-2018 (Units)
Table 16 FPSO: Contract Value, By Build, 2011-2018 ($Million)
Table 17 TLP: Orders Booked, By Water Depth, 2011-2018 (Units)
Table 18 TLP: Contract Value, By Water Depth, 2011-2018 ($Million)
Table 19 TLP: Orders Booked, By Build, 2011-2018 (Units)
Table 20 TLP: Contract Value, By Build, 2011-2018 ($Million)
Table 21 SPAR: Orders Booked, By Water Depth, 2011-2018 (Units)
Table 22 SPAR: Contract Value, By Water Depth, 2011-2018 ($Million)
Table 23 SPAR: Orders Booked, By Build, 2011-2018 (Units)
Table 24 Barge: Orders Booked, By Water Depth, 2011-2018 (Units)
Table 25 Barge: Contract Value, By Water Depth, 2011-2018 ($Million)
Table 26 Barge: Orders Booked, By Build, 2011-2018 (Units)
Table 27 Barge: Contract Value, By Build, 2011-2018 ($Million)
Table 28 Others: Orders Booked, By Water Depth, 2011-2018 (Units)
Table 29 Others: Contract Value, By Water Depth, 2011-2018 ($Million)
Table 30 Others: Orders Booked, By Build, 2011-2018 (Units)
Table 31 Others: Contract Value, By Build, 2011-2018 ($Million)
Table 32 Floating Production System Operators� Share, 2012
Table 33 Offshore Drilling Activity, By Geography (in �000 Feet)
Table 34 Global Floating Production Systems In the Planning Stage, By Geography, 2013-2018 (Units)
Table 35 Global Floating Production System Installations, By Geography, 2011-2018 (Units)
Table 36 Global FPS Installations, By Geography, 2011-2018 ($Million)
Table 37 Global FPS Orders Booked, By Geography, 2011-2018 (Units)
Table 38 Floating Production System Contract Value, By Geography, 2011-2018 ($Million)
Table 39 Latin America: FPS Orders Booked, By Country, 2011-2018 (Units)
Table 40 Latin America: Floating Production System Contract Value, By Country, 2011-2018 ($Million)
Table 41 Africa: FPS Orders Booked, By Country, 2011-2018 (Units)
Table 42 Africa: FPS Contract Value, By Country, 2011-2018 ($Million)
Table 43 Asia-Pacific: Floating Production System Orders Booked, By Country, 2011-2018 (Units)
Table 44 Asia-Pacific: FPS Contract Value, By Country, 2011-2018 ($Million)
Table 45 North America: Floating Production System Orders Booked, By Country, 2011-2018 (Units)
Table 46 North America: FPS Contract Value, By Country, 2011-2018 ($Million)
Table 47 Europe: FPS Orders Booked, By Country, 2011-2018 (Units)
Table 48 Europe: FPS Contract Value, By Country, 2011-2018 ($Million)
Table 49 Middle East: Floating Production System Orders Booked, By Country, 2011-2018 (Units)
Table 50 Middle East: FPS Contract Value, By Country, 2011-2018 ($Million)
Table 51 Offshore Fields, By Country & Water Depth (Feet)
Table 52 Global Floating Production System in the Planning Stage, By Water Depth, 2013-2018 (Units)
Table 53 Global Floating Production System Installation, By Water Depth, 2011-2018 (Units)
Table 54 Global FPS Installation, By Type, 2011-2018 ($Million)
Table 55 Global Floating Production System Orders Booked, By Water Depth, 2011-2018 (Units)
Table 56 Global FPS Contract Value, By Water Depth, 2011-2018 ($Million)
Table 57 Shallow Water Floating Production Systems Market Orders Booked, By Type, 2011-2018 (Units)
Table 58 Shallow-Water FPS Market Contract Value, By Type, 2011-2018 ($Million)
Table 59 Deep Water Floating Production System Market Orders Booked, By Type, 2011-2018 (Units)
Table 60 Deep-Water FPS Market Contract Value, By Type, 2011-2018 ($Million)
Table 61 Ultra-Deep Water Floating Production Systems Market Orders Booked, By Type, 2011-2018 (Units)
Table 62 Ultra-Deep Water FPS Market Contract Value, By Type, 2011-2018 ($Million)
Table 63 Global Floating Production System in the Planning Stage, By Build, 2013-2018 (Units)
Table 64 Global Floating Production System Installations, By Build, 2011-2018 (Units)
Table 65 Global Floating Production System Installations, By Build, 2011-2018 ($Million)
Table 66 Global FPS Orders Booked, By Build, 2011-2018 (Units)
Table 67 Global FPS Contract Value, By Build, 2011-2018 ($Million)
Table 68 New-Build Floating Production Systems Market Orders Booked, By Type, 2011-2018 (Units)
Table 69 New-Build Floating Production System Market Contract Value, By Type, 2011-2018 ($Million)
Table 70 Converted FPS Market Orders Booked, By Type, 2011-2018 (Units)
Table 71 Converted Floating Production System Market Contract Value, By Type, 2011-2018 ($Million)
Table 72 Annual Contract Awards
Table 73 Agreements & Collaboration, 2011-2014
Table 74 New-Product/Technology Launches, 2011-2014
Table 75 Joint Venture, 2011-2014
Table 76 Other Developments, 2011-2014
Table 77 BUMI Armada Berhad: Production Systems Conversion/New Build
Table 78 Daewoo Shipbuilding & Marine Engineering Co. Ltd.: Manufacturing and Repair Services
Table 79 Keppel Shipyards: Production Systems Manufactured/Repaired
Table 80 Mhb Shipyards: Offsore Manufacturing and Conversion Services
Table 81 Mhi: Products & Services
Table 82 Pipavav DOC: Production Systems Manufactured/Repaired
Table 83 Samsung Heavy Industries: Manufacturing & Repair Services
Table 84 SBM Offshore: Manufacturing & Repair Services
Table 85 Technip: Products & Its Description/Use
Table 86 Teekay Corporation: Products & Services
List of Figures (56 Figures)
Figure 1 Floating Production Systems Market: Research Methodology
Figure 2 Data Triangulation Methodology
Figure 3 Global Floating Production Systems Market, By Geography, 2011-2018 ($Million)
Figure 4 Floating Production Systems Market Overview: Tree Structure
Figure 5 Floating Production Systems Industry: History & Evolution
Figure 6 Floating Production System Market Size (Value), 2011�2018 ($Million)
Figure 7 Floating Production Systems Market Size (Value), 2011�2018 ($Million)
Figure 8 Growth of Floating Production System Types Market, By Water Depth, 2013-2018
Figure 9 Global Market: Scenario of Different Regions
Figure 10 Global Market Size (Value), By Major Countries of Each Geography, 2013 ($Million)
Figure 11 Floating Production Systems, By Built: Market Size (Value), 2011�2018 ($Million)
Figure 12 OSV: Market Share, By Geography, 2011�2018 ($Million)
Figure 13 Increase in Demand For Crude Oil, By Geography, 2008-2012 (�000 Bbl/Day)
Figure 14 Offshore Drilling Activities, By Water Depth, 2012
Figure 15 Global Offshore E&P Capex, 2005-2014 ($Billion)
Figure 16 Floating Production Systems Market: Value Chain Analysis
Figure 17 SWOT Analysis: BUMI Armada Berhad
Figure 18 SWOT Analysis: Daewoo Shipbuilding & Marine Engineering Co. Ltd.
Figure 19 SWOT Analysis: Hyundai Heavy Industries
Figure 20 SWOT Analysis: Keppel Offshore and Marine
Figure 21 SWOT Analysis: Malaysia Marine and Heavy Engineering
Figure 22 SWOT Analysis: Mitsubishi Heavy Industries Corporation
Figure 23 SWOT Analysis: Pipavav Defence and Offshore Engineering Company Ltd.
Figure 24 SWOT Analysis: Samsung Heavy Industries
Figure 25 SWOT Analysis: SBM Offshore
Figure 26 SWOT Analysis: Technip
Figure 27 SWOT Analysis: Teekay Corporation
Figure 28 Porter�s Five-Forces Analysis
Figure 29 Growth of FPS in the Planning Stage, By Type, 2013-2018
Figure 30 Floating Production System Installations, Market Growth, By Type, 2013-2018 ($Million)
Figure 31 Global Floating Production Systems Market Share (Value), By Type, 2012 ($Million)
Figure 32 Floating Production Systems Market Share, By Water Depth, 2013
Figure 33 Floating Production Systems Market Share (Value), By Water Depth, 2013-2018 ($Million)
Figure 34 Floating Production Systems Market Share, By Build, 2013
Figure 35 Floating Production Systems Market Share (Value), By Build, 2013-2018 ($Million)
Figure 36 TLP: Market Share, By Water Depth, 2013
Figure 37 TLP: Market Share (Value), By Water Depth, 2013-2018 ($Million)
Figure 38 Growth of FPS in the Planning Stage, By Geography, 2013-2018
Figure 39 FPS Installations, Market Size, By Geography, 2013-2018 ($Million)
Figure 40 Global FPS Market Share, By Geography, 2012
Figure 41 Growth of FPS in the Planning Stage, By Water Depth, 2013-2018
Figure 42 FPS Installations, Market Growth, By Water Depth, 2013-2018 ($Million)
Figure 43 Global Floating Production Systems Market Share, By Water Depth, 2012
Figure 44 Growth of FPS in the Planning Stage, By Build, 2013-2018
Figure 45 Floating Production System Installations, Market Growth, By Build, 2013-2018 ($Million)
Figure 46 Global FPS Market Share, By Build, 2012 ($Million)
Figure 47 Floating Production Systems Market: Number of Developments, 2011-2014
Figure 48 Floating Production Systems Market Development Share, By Growth Strategy, 2011-2014
Figure 49 Floating Production Systems Market Activities, By Key Player, 2011-2014
Figure 50 Floating Production Systems Market Share (Value): top 4 Companies Vs. Others, 2012
Figure 51 Floating Production Systems Market Share Analysis: By Company, 2012
Figure 52 Annual Contract Award Analysis, 2011-2014
Figure 53 Annual Agreements & Collaborations Analysis, 2011-2014
Figure 54 Annual New-Product/Technology Development Analysis, 2011-2014
Figure 55 Annual Joint Ventures Analysis, 2011-2014
Figure 56 Annual Other Development Analysis, 2011-2013


Growth opportunities and latent adjacency in Floating Production Systems Market