Friction Modifiers Market by Type (Organic and Inorganic), Application (Transportation Lubricants (Commercial Vehicle, Passenger Vehicle, Aviation, Marine), and Industrial Lubricants), and Region - Global Forecast to 2022


The friction modifiers market was valued at USD 815.3 million in 2016 and is projected to reach USD 1,004.3 million by 2022, at a CAGR of 3.6% during the forecast period. The base year considered for the study is 2016 while the forecast period is from 2017 to 2022. Antifriction additives are lubricant additives that are added to base oil to control the frictional properties of lubricants by reducing the coefficient of friction. It results in less consumption of fuel, contributing to fuel economy. Antifriction additives are composed of carboxylic acids, fatty acid esters, alcohols, sulfurized fatty acids, esters & amides, molybdenum compounds, and functional polymers. They provide better lubricity and longer life to the equipment, which in turn is expected to drive the market between 2017 and 2022.
Market Dynamics
Drivers
- Growing automobile industry and vehicle parc
- Increasing demand for fuel efficient lubricants
Restraints
- Rise in demand for alternate fuels
Opportunities
- Stringent environment regulations
- Advancement in friction modifier technolgies
Growing automobile industry and vehicle parc
Over the years, the automotive industry has witnessed significant growth in vehicle production and sales. Currently, the automotive industry is witnessing a period of substantial growth in APAC and North America, among other regions, and the annual sales of vehicles have increased, significantly. Technological advancements have fueled the growth of the automotive industry in APAC and North America. Therefore, the increasing vehicle production in major markets is directly influencing the demand for vehicles, globally. This is considered to be a positive factor responsible for the growth of the friction modifier market.
Objectives of the report are as follows:
- To estimate and forecast the size of the friction modifiers market, in terms of value and volume
- To define, describe, and forecast the size of the friction modifiers market based on type, application, and region
- To forecast the size of the friction modifiers market with respect to 5 main regions, namely, North America, Europe, Asia Pacific (APAC), South America, and the Middle East & Africa, along with their respective key countries
- To provide detailed information regarding major factors such as drivers, opportunities, and challenges influencing the growth of the friction modifiers market
- To strategically analyze micromarkets with respect to individual growth trends, prospects, and their contribution to the overall friction modifiers market
- To analyze opportunities in the friction modifiers market for stakeholders and provide a competitive landscape of market leaders
- To track and analyze recent developments such as new product launches, expansions, partnerships, and acquisitions undertaken in the friction modifiers market
- To strategically profile key players in the friction modifiers market and comprehensively analyze their core competencies
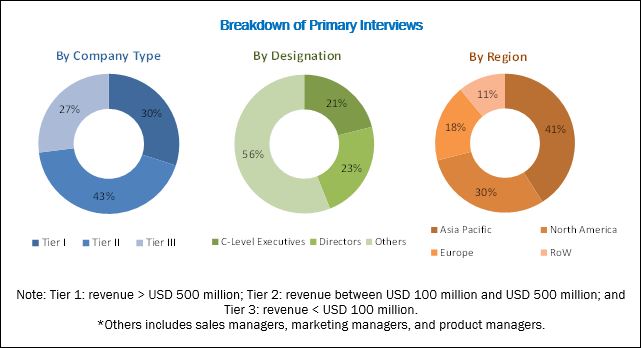
Both, top-down and bottom-up approaches have been implemented to estimate and project the size of the friction modifiers market during the forecast period. Friction modifiers are also termed as antifriction additives. The size of the friction modifiers market has been calculated, and weightages have been assigned to various market segments. This has been performed based on extensive primary interviews and secondary research of the information available on websites of various associations such as The Additive Technical Committee (ATC), American Chemistry Council (ACC) Association, and Union of the European Lubricants Industry. Primary research that has been carried out includes extensive interviews with key personnel such as chief executive officers, vice presidents, directors, and executives of the leading players operating in the friction modifiers, lubricant additives, and lubricant market. After arriving at the overall market size, the total market has been split into several segments and subsegments. The data triangulation and market breakdown procedures have been employed to complete the overall market engineering process and arrive at the exact statistics for all segments and subsegments. The breakdown of profiles of primary respondents has been depicted in the figure below.
To know about the assumptions considered for the study, download the pdf brochure
The ecosystem of the friction modifiers market comprises manufacturers of friction modifiers such as Lubrizol (US), Afton (US), Infineum (UK), Chevron Oronite (US), Croda (UK), Chemtura (Germany), BASF (Germany), Kings Industries (US), BRB International (Netherlands), and Vanderbilt Chemicals (US). These companies are engaged in the production of firction modifiers using various organic and inorgainc compounds that are provided by raw material suppliers. After the completion of the production process, friction modifiers are distributed in the market to lubricant manufacturers through different channels. Lubricant manufacturing industries such as Royal Dutch Shell (Netherlands), Lukoil (Russia), Exxon Mobil (US), BP (UK), and Total (France) are the blending plants who supply their products to distributors, which are further distributed among, retailers, independent workshops, and garages.
Target Audience:
- Manufacturers of Friction modifiers
- Lubricant Suppliers
- Chemical Suppliers
- Raw Material Suppliers
- Manufacturers of Lubricant Additives
- Government and Research Organizations
- Traders, Distributors, and Suppliers of Friction modifiers
- Industry Associations
- Research and Consulting Firms
�The study answers several questions for stakeholders, primarily, which market segments they need to focus upon during the next two to five years to prioritize their efforts and investments.�
Scope of the Report
The research report categorizes the friction modifiers market into the following segments:
Friction modifiers Market, by Type
- Organic
- Fatty acids
- Esters & Amides
- Functional polymers
- Inorganic
- Molybdenum Compounds
- Nanoparticles (Graphite, Metal Oxides)
Friction modifiers Market, by Application
- Transportation Lubricants
- Commercial Vehicle
- Passenger Vehicle
- Aviation
- Marine
- Industrial Lubricants
Friction modifiers Market, by Region:
- North America
- Europe
- Asia Pacific
- South America
- Middle East & Africa
Critical questions which the report answers
- What new product developments companies are engaged in?
- Who are the key players in the market and how intense is the competition?
Available Customizations
Along with the market data, MarketsandMarkets offers customizations according to the company�s specific needs. The following customization options are available for the report:
Regional Analysis
- Further breakdown of a region with respect to a particular country, additional application, and/or type
Country Information
- Additional country information (up to three)
Company Information
- Detailed analysis and profiles of additional market players (up to five)
The friction modifiers market is projected to grow from USD 843.0 million in 2017 to USD 1,004.3 million by 2022, at a CAGR of 3.6% during the forecast period. Friction modifiers help in reducing fuel consumption and CO2 emissions, thereby increasing the energy efficiency of various machinery & equipment. These additives are added to the lubricants in a small amount and are blended together to achieve the highest degree of antifriction properties.
The increase in the overall transportation industry has resulted in the rise in the use of lubricants across the globe, thereby widening the scope of the friction modifiers market. The increasing demand for friction modifiers from emerging economies such as India and South Korea is expected to fuel the growth of the friction modifiers market across the globe. Furthermore, the growth of the automotive industry is expected to affect the demand for friction modifiers in developed markets of North America and Europe, as regulations are mandating the use of fuel-efficient lubricants in automobile lubricants and automotive manufacturing. Moreover, friction modifiers facilitate efficient functioning of lubricants, and their use has become essential to meet emission standards in the automobile industry. Friction modifiers are also termed as antifriction additives.
On the basis of type, the inorganic segment is expected to lead the friction modifiers market during the forecast period, in terms of value. The growth of this segment can be attributed to the outstanding performance and friction reduction provided by inorganic friction modifiers. Moreover, these additives are cheaper as compared to organic friction modifiers.
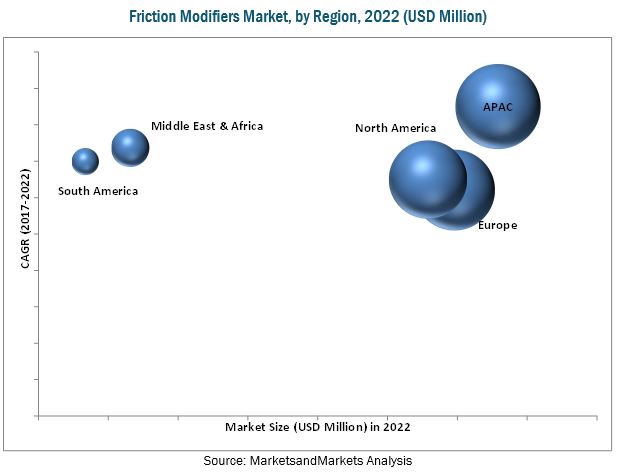
The friction modifiers market has been studied for North America, Europe, Asia Pacific, South America, and the Middle East & Africa. The Asia Pacific region is the largest market for friction modifiers and is expected to continue leading the market till 2022. The growth of the Asia Pacific friction modifiers market can be attributed to the recognition of countries such as China, Japan, South Korea, and India as automotive hubs.
Transportation and industrial lubricants applications to drive the growth of Friction Modifier market
Transportation Lubricants
The transportation lubricants segment is the largest application of friction modifier, and the market in this application is expected to register the highest growth during the forecast period. Increasing sales of passenger and commercial vehicles will lead to increased consumption of lubricants. Also, the continuous increase in seaborne trade due to lower freight rate than airborne trade has led to a rise in the demand for marine lubricants. Such factors provide huge potential to the friction modifier market. In addition, agencies such as the U.S. EPA have laid down certain regulations regarding the emission standards for diesel engines. Friction modifier facilitate the efficient functioning of heat exhaust systems, and their use has become essential to meet emission standards in the automobile industry.
Industrial Lubricants
The industrial lubricants segment includes the use of friction modifiers for hydraulic fluids, metalworking fluids, machine and compressor oils, and industrial gear oils used in the manufacturing, oil & gas, agriculture, forestry, and food processing sectors. These additives can be used in turbines, compressors, gears, hydraulics, and metal cutting machines.
Critical questions the report answers:
- Where will all these developments take the industry in the mid to long term?
- What are the upcoming products in the friction modifier market?
To speak to our analyst for a discussion on the above findings, click Speak to Analyst
Significant investments in R&D activities for developing new friction modifiers due to ongoing developments and modifications in technologies employed for manufacturing friction modifiers make the entry of new players in the market difficult. Fluctuating prices of raw materials adversely impact the overall cost of production incurred by the manufacturers of friction modifiers. A preference towards electric vehicle also poses a challenge for the growth of the friction modifiers market.
Expansions has been the major developmental strategy adopted between 2013 and 2017 by the key players operating in the friction modifiers market. Companies such as Lubrizol (US), Afton (US), Infineum (UK), Chevron Oronite (US), Croda (UK), BASF (Germany) have adopted these strategies to strengthen their market presence and customer base as well as gain a competitive edge in the market. These companies are also focusing on investing in R&D activities to introduce new and cost-effective materials to meet the changing consumer needs.
 Exclusive indicates content/data unique to MarketsandMarkets and not available with any competitors.
Table of Contents
1 Introduction (Page No. - 15)
1.1 Objectives of the Study
1.2 Market Definition
1.3 Market Scope
1.3.1 Years Considered for the Study
1.4 Currency
1.5 Unit Considered
1.6 Stakeholders
2 Research Methodology (Page No. - 18)
2.1 Research Data
2.2 Secondary Data
2.2.1.1 Key Data From Secondary Sources
2.3 Primary Data
2.3.1.1 Key Data From Primary Sources
2.3.1.2 Key Industry Insights
2.3.1.3 Breakdown of Primary Interviews
2.4 Market Size Estimation
2.4.1 Bottom-Up Approach
2.4.2 Top-Down Approach
2.5 Data Triangulation
2.6 Assumptions
2.7 Limitations
3 Executive Summary (Page No. - 26)
4 Premium Insights (Page No. - 30)
4.1 Significant Opportunities in Friction Modifiers Market
4.2 APAC Friction Modifiers Market, By Application and Country
4.3 Friction Modifiers Market, By Type
4.4 Friction Modifiers Market Attractiveness
5 Market Overview (Page No. - 33)
5.1 Introduction
5.2 Market Dynamics
5.2.1 Drivers
5.2.1.1 Growing Automotive Industry and Vehicle Parc
5.2.1.2 Increasing Demand for Fuel-Efficient Lubricants
5.2.2 Restraints
5.2.2.1 Rise in Demand for Alternative Fuels
5.2.3 Opportunities
5.2.3.1 Stringent Environmental Regulations
5.2.3.2 Advancements in Friction Modifier Additive Technologies
5.2.4 Challenges
5.2.4.1 Shift Toward Fully Electric Vehicles
5.3 Porter�s Five Forces Analysis
5.3.1 Threat of Substitutes
5.3.2 Threat of New Entrants
5.3.3 Bargaining Power of Suppliers
5.3.4 Bargaining Power of Buyers
5.3.5 Intensity of Competitive Rivalry
5.4 Macroeconomic Indicators
5.4.1 GDP Growth Rate Forecast of Major Economies
5.4.2 Trends and Forecast of Oil & Gas Industry
5.4.3 Trends and Forecast of Infrastructure Industry
5.4.4 Trends and Forecast of Automotive Industry
6 Friction Modifiers Market, By Type (Page No. - 45)
6.1 Introduction
6.2 Organic Friction Modifiers
6.2.1 Fatty Acids
6.2.2 Esters & Amides
6.2.3 Functional Polymers
6.3 Inorganic Friction Modifiers
6.3.1 Molybdenum Compounds
6.3.2 Nanoparticles
7 Friction Modifiers Market, By Application (Page No. - 56)
7.1 Introduction
7.2 Transportation Lubricants
7.2.1 Commercial Vehicle Lubricants
7.2.2 Passenger Vehicle Lubricants
7.2.3 Aviation Lubricants
7.2.4 Marine Lubricants
7.3 Industrial Lubricants
8 Friction Modifiers Market, By Region (Page No. - 65)
8.1 Introduction
8.2 North America
8.2.1 US
8.2.2 Canada
8.2.3 Mexico
8.3 Europe
8.3.1 Germany
8.3.2 Netherlands
8.3.3 Italy
8.3.4 Spain
8.3.5 Poland
8.3.6 UK
8.3.7 Russia
8.3.8 France
8.4 APAC
8.4.1 China
8.4.2 South Korea
8.4.3 Japan
8.4.4 Singapore
8.4.5 Malaysia
8.4.6 India
8.5 Middle East & Africa
8.5.1 Iran
8.5.2 South Africa
8.6 South America
8.6.1 Brazil
9 Competitive Landscape (Page No. - 105)
9.1 Overview
9.2 Market Ranking Analysis
9.2.1 Lubrizol
9.2.2 Afton
9.2.3 Infineum
9.2.4 Chevron Oronite
9.2.5 Croda
9.3 Competitive Scenario
9.3.1 Expansion
9.3.2 New Product Launch
9.3.3 Acquisition
10 Company Profiles (Page No. - 109)
(Business Overview, Products Offered, Recent Developments, SWOT Analysis & MnM View)*
10.1 Lubrizol Corporation
10.2 Afton Chemical Corporation
10.3 Infineum International Limited
10.4 Chevron Oronite Company LLC
10.5 Croda International PLC
10.6 BASF SE
10.7 Chemtura Corporation
10.8 Kings Industries, Inc.
10.9 BRB International BV
10.10 Vanderbilt Chemicals, LLC
*Details on Business Overview, Products Offered, Recent Developments, SWOT Analysis & MnM View Might Not Be Captured in Case of Unlisted Companies.
10.11 Other Market Players
10.11.1 CSW Industrials Inc.
10.11.2 Abitec Corporation
10.11.3 Wynn�s
10.11.4 Adeka Corporation
10.11.5 Archoil
10.11.6 Multisol Ltd.
10.11.7 PMC Biogenix, Inc.
10.11.8 Nyco SA
10.11.9 Dog Deutsche Oelfabrik Gesellschaft F�r Chemische Erzeugnisse Mbh & Co. Kg
10.11.10 Akzonobel N.V.
11 Appendix (Page No. - 127)
11.1 Discussion Guide
11.2 Knowledge Store: Marketsandmarkets� Subscription Portal
11.3 Introducing RT: Real-Time Market Intelligence
11.4 Available Customizations
11.5 Related Reports
11.6 Author Details
List of Tables (107 Tables)
Table 1 Trends and Forecast of GDP, 2017�2022 (USD Billion)
Table 2 Friction Modifiers Market Size, By Type, 2015�2022 (USD Million)
Table 3 Friction Modifiers Market Size, By Type, 2015�2022 (Kiloton)
Table 4 Organic Friction Modifiers Market Size, By Region, 2015�2022 (USD Million)
Table 5 Organic Friction Modifiers Market Size, By Region, 2015�2022 (Kiloton)
Table 6 Fatty Acids Friction Modifiers Market Size, By Region, 2015�2022 (USD Million)
Table 7 Fatty Acids Friction Modifiers Market Size, By Region, 2015�2022 (Kiloton)
Table 8 Esters & Amides Friction Modifiers Market Size, By Region, 2015�2022 (USD Million)
Table 9 Esters & Amides Friction Modifiers Market Size, By Region, 2015�2022 (Kiloton)
Table 10 Functional Polymers Friction Modifiers Market Size, By Region, 2015�2022 (USD Million)
Table 11 Functional Polymers Friction Modifiers Market Size, By Region, 2015�2022 (Kiloton)
Table 12 Inorganic Friction Modifiers Market Size, By Region, 2015�2022 (USD Million)
Table 13 Inorganic Friction Modifiers Market Size, By Region, 2015�2022 (Kiloton)
Table 14 Molybdenum Compounds Friction Modifiers Market Size, By Region, 2015�2022 (USD Million)
Table 15 Molybdenum Compounds Friction Modifiers Market Size, By Region, 2015�2022 (Kiloton)
Table 16 Nanoparticles Friction Modifiers Market Size, By Region, 2015�2022 (USD Million)
Table 17 Nanoparticles Friction Modifiers Market Size, By Region, 2015�2022 (Kiloton)
Table 18 Friction Modifiers Market Size, By Application, 2015�2022 (USD Million)
Table 19 Friction Modifiers Market Size, By Application, 2015�2022 (Kiloton)
Table 20 Friction Modifiers Market Size in Transportation Lubricants, By Region, 2015�2022 (USD Million)
Table 21 Friction Modifiers Market Size in Transportation Lubricants, By Region, 2015�2022 (Kiloton)
Table 22 Friction Modifiers Market Size in Commercial Vehicle Lubricants, By Region, 2015�2022 (USD Million)
Table 23 Friction Modifiers Market Size in Commercial Vehicle Lubricants, By Region, 2015�2022 (Kiloton)
Table 24 Friction Modifiers Market Size in Passenger Vehicle Lubricants, By Region, 2015�2022 (USD Million)
Table 25 Friction Modifiers Market Size in Passenger Vehicle Lubricants, By Region, 2015�2022 (Kiloton)
Table 26 Friction Modifiers Market Size in Aviation Lubricants, By Region, 2015�2022 (USD Million)
Table 27 Friction Modifiers Market Size in Aviation Lubricants, By Region, 2015�2022 (Kiloton)
Table 28 Friction Modifiers Market Size in Marine Lubricants, By Region, 2015�2022 (USD Million)
Table 29 Friction Modifiers Market Size in Marine Lubricants, By Region, 2015�2022 (Kiloton)
Table 30 Friction Modifiers Market Size in Industrial Lubricants, By Region, 2015�2022 (USD Million)
Table 31 Friction Modifiers Market Size in Industrial Lubricants, By Region, 2015�2022 (Kiloton)
Table 32 Friction Modifiers Market Size, By Region, 2015�2022 (USD Million)
Table 33 Friction Modifiers Market Size, By Region, 2015�2022 (Kiloton)
Table 34 North America: Market Size, By Country, 2015�2022 (USD Million)
Table 35 North America: Market Size, By Country, 2015�2022 (Kiloton)
Table 36 North America: Market Size, By Type, 2015�2022 (USD Million)
Table 37 North America: Market Size, By Type, 2015�2022 (Kiloton)
Table 38 North America: Market Size, By Application, 2015�2022 (USD Million)
Table 39 North America: Market Size, By Application, 2015�2022 (Kiloton)
Table 40 US: Market Size, By Application, 2015�2022 (USD Million)
Table 41 US: Market Size, By Application, 2015�2022 (Kiloton)
Table 42 Canada: Market Size, By Application, 2015�2022 (USD Million)
Table 43 Canada: Market Size, By Application, 2015�2022 (Kiloton)
Table 44 Mexico: Market Size, By Application, 2015�2022 (USD Million)
Table 45 Mexico: Market Size, By Application, 2015�2022 (Kiloton)
Table 46 Europe: Market Size, By Country, 2015�2022 (USD Million)
Table 47 Europe: Market Size, By Country, 2015�2022 (Kiloton)
Table 48 Europe: Market Size, By Type, 2015�2022 (USD Million)
Table 49 Europe: Market Size, By Type, 2015�2022 (Kiloton)
Table 50 Europe: Market Size, By Application, 2015�2022 (USD Million)
Table 51 Europe: Market Size, By Application, 2015�2022 (Kiloton)
Table 52 Germany: Friction Modifiers Market Size, By Application, 2015�2022 (USD Million)
Table 53 Germany: Friction Modifiers Market Size, By Application, 2015�2022 (Kiloton)
Table 54 Netherlands: Market Size, By Application, 2015�2022 (USD Million)
Table 55 Netherlands: Market Size, By Application, 2015�2022 (Kiloton)
Table 56 Italy: Market Size, By Application, 2015�2022 (USD Million)
Table 57 Italy: Market Size, By Application, 2015�2022 (Kiloton)
Table 58 Spain: Market Size, By Application, 2015�2022 (USD Million)
Table 59 Spain: Market Size, By Application, 2015�2022 (Kiloton)
Table 60 Poland: Friction Modifiers Market Size, By Application, 2015�2022 (USD Million)
Table 61 Poland: Friction Modifiers Market Size, By Application, 2015�2022 (Kiloton)
Table 62 UK: Market Size, By Application, 2015�2022 (USD Million)
Table 63 UK: Market Size, By Application, 2015�2022 (Kiloton)
Table 64 Russia: Market Size, By Application, 2015�2022 (USD Million)
Table 65 Russia: Market Size, By Application, 2015�2022 (Kiloton)
Table 66 France: Market Size, By Application, 2015�2022 (USD Million)
Table 67 France: Market Size, By Application, 2015�2022 (Kiloton)
Table 68 APAC: Market Size, By Country, 2015�2022 (USD Million)
Table 69 APAC: Market Size, By Country, 2015�2022 (Kiloton)
Table 70 APAC: Market Size, By Type, 2015�2022 (USD Million)
Table 71 APAC: Market Size, By Type, 2015�2022 (Kiloton)
Table 72 APAC: Market Size, By Application, 2015�2022 (USD Million)
Table 73 APAC: Market Size, By Application, 2015�2022 (Kiloton)
Table 74 China: Friction Modifiers Market Size, By Application, 2015�2022 (USD Million)
Table 75 China: Friction Modifiers Market Size, By Application, 2015�2022 (Kiloton)
Table 76 South Korea: Friction Modifiers Market Size, By Application, 2015�2022 (USD Million)
Table 77 South Korea: Friction Modifiers Market Size, By Application, 2015�2022 (Kiloton)
Table 78 Japan: Market Size, By Application, 2015�2022 (USD Million)
Table 79 Japan: Market Size, By Application, 2015�2022 (Kiloton)
Table 80 Singapore: Market Size, By Application, 2015�2022 (USD Million)
Table 81 Singapore: Market Size, By Application, 2015�2022 (Kiloton)
Table 82 Malaysia: Market Size, By Application, 2015�2022 (USD Million)
Table 83 Malaysia: Market Size, By Application, 2015�2022 (Kiloton)
Table 84 India: Friction Modifiers Market Size, By Application, 2015�2022 (USD Million)
Table 85 India: Friction Modifiers Market Size, By Application, 2015�2022 (Kiloton)
Table 86 Middle East & Africa: Market Size, By Country, 2015�2022 (USD Million)
Table 87 Middle East & Africa: Market Size, By Country, 2015�2022 (Kiloton)
Table 88 Middle East & Africa: Market Size, By Type, 2015�2022 (USD Million)
Table 89 Middle East & Africa: Market Size, By Type, 2015�2022 (Kiloton)
Table 90 Middle East & Africa: Market Size, By Application, 2015�2022 (USD Million)
Table 91 Middle East & Africa: Market Size, By Application, 2015�2022 (Kiloton)
Table 92 Iran: Market Size, By Application, 2015�2022 (USD Million)
Table 93 Iran: Market Size, By Application, 2015�2022 (Kiloton)
Table 94 South Africa: Friction Modifiers Market Size, By Application, 2015�2022 (USD Million)
Table 95 South Africa: Friction Modifiers Market Size, By Application, 2015�2022 (Kiloton)
Table 96 South America: Market Size, By Country, 2015�2022 (USD Million)
Table 97 South America: Market Size, By Country, 2015�2022 (Kiloton)
Table 98 South America: Market Size, By Type, 2015�2022 (USD Million)
Table 99 South America: Market Size, By Type, 2015�2022 (Kiloton)
Table 100 South America: Market Size, By Application, 2015�2022 (USD Million)
Table 101 South America: Market Size, By Application, 2015�2022 (Kiloton)
Table 102 Brazil: Friction Modifiers Market Size, By Application, 2015�2022 (USD Million)
Table 103 Brazil: Friction Modifiers Market Size, By Application, 2015�2022 (Kiloton)
Table 104 Ranking of Key Friction Modifiers Manufacturers, 2016
Table 105 Expansion, 2013�2017
Table 106 New Product Launch, 2013�2017
Table 107 Acquisition, 2013�2017
List of Figures (39 Figures)
Figure 1 Friction Modifiers Market Segmentation
Figure 2 Friction Modifiers Market: Research Design
Figure 3 Friction Modifiers Market: Data Triangulation
Figure 4 Inorganic Friction Modifiers Segment to Lead the Market
Figure 5 Transportation Lubricants Segment to Be the Dominant Application
Figure 6 India to Be Fastest-Growing Friction Modifiers Market
Figure 7 APAC Led the Friction Modifiers Market in 2016
Figure 8 Stringent Environmental Regulations to Drive the Market
Figure 9 Singapore Led the APAC Friction Modifiers Market in 2016
Figure 10 Inorganic Friction Modifiers to Account for the Largest Market Share
Figure 11 India to Be the Fastest-Growing Friction Modifiers Market
Figure 12 Overview of Factors Governing the Friction Modifiers Market
Figure 13 Friction Modifiers Market: Porter�s Five Forces Analysis
Figure 14 Global Oil Production vs Consumption, 2012�2016
Figure 15 Global Crude Oil Production, 2015�2018 (Mbpd)
Figure 16 Global Infrastructural Investments By 2030
Figure 17 World Motor Vehicle Sales in 2016
Figure 18 Automotive (Car) Sales Outlook in 2016
Figure 19 Organic Friction Modifiers Segment to Register the Highest CAGR
Figure 20 Functional Polymers Segment to Register the Highest CAGR
Figure 21 Molybdenum Compounds Segment to Register the Highest CAGR
Figure 22 Transportation Lubricants Segment to Register the Highest CAGR
Figure 23 Passenger Vehicle Lubricants Segment to Register the Highest CAGR
Figure 24 APAC to Be the Fastest-Growing Friction Modifiers Market
Figure 25 North America: Friction Modifiers Market Snapshot
Figure 26 Europe: Friction Modifiers Market Snapshot
Figure 27 APAC: Friction Modifiers Market Snapshot
Figure 28 Companies Adopted Expansion as the Key Growth Strategy Between 2013 and 2017
Figure 29 Lubrizol Corporation: Company Snapshot
Figure 30 Lubrizol Corporation: SWOT Analysis
Figure 31 Afton Chemical Corporation: Company Snapshot
Figure 32 Afton Chemical Corporation: SWOT Analysis
Figure 33 Infineum International Limited: SWOT Analysis
Figure 34 Chevron Oronite Company LLC: SWOT Analysis
Figure 35 Croda International PLC: Company Snapshot
Figure 36 Croda International PLC: SWOT Analysis
Figure 37 BASF SE: Company Snapshot
Figure 38 BASF SE: SWOT Analysis
Figure 39 Chemtura Corporation: Company Snapshot


Growth opportunities and latent adjacency in Friction Modifiers Market