GaN Power Device Market by Device Type (Power, RF Power), Voltage Range, Application (Power Drives, Supply & Inverter, and RF), Vertical (Telecommunications, Consumer, Automotive, Military, Defense, Aerospace), and Geography - Global Forecast to 2023


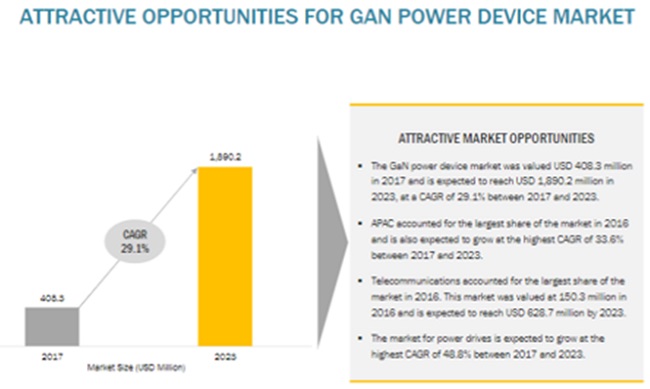
The GaN power device market is expected to grow from USD 408.3 Million in 2017 to USD 1890.2 Million by 2023, at a CAGR of 29.1% between 2017 and 2023. The key factors contributing to the growth of the GaN power device includes the vast addressable market for GaN in the consumer electronics and automotive verticals, wide bandgap property of GaN material encouraging innovative applications, success of GaN in RF power electronics, and increasing adoption of GaN RF power device in the military, defense, and aerospace vertical.
Currently, the overall GaN power device market is dominated by RF power devices. Major industries that dominate the global GaN power device market are telecommunications; consumer and enterprise; automotive; and military, defense, and aerospace. GaN power devices are mainly used in UPS and motor control, wireless charging, high-efficiency power supply applications, servo motor drive, and hybrid and EV battery control and health management systems. GaN RF power devices are mainly used in radio and TV broadcast, amateur radio, civilian radar, jammers, satellite communications, electronic warfare, and missiles.
The growing EV charging and electric vehicle production markets and increasing renewable energy generation are the major factors driving the growth of the GaN power device market. Moreover, there is a huge demand for motor drives owing to the high efficiency and performance characteristics offered by GaN devices in the high-voltage ranges (above 400 V).
Market Dynamics
Drivers: Huge revenue generation from the consumer electronics and automotive verticals
The digital world has also had an indirect impact on the power device market, with every digital appliance�big or small�requiring a power device for power functions, especially low-power devices. However, advancements in the digital world had little impact on medium- and high-voltage power devices. Thus, the market growth rate of medium- and high-voltage power devices was lower than low-voltage power devices. This, however, applies only to the market growth rate and not to the market size. Electric vehicles and hybrid electric vehicles, automotive braking control systems, rail traction, etc., have triggered the need for improved power devices, with GaN currently being the preferred choice in all aspects�performance, efficiency, and quality�as most automotive applications are in the medium-voltage range (200�800V) territory of GaN. Automotive is expected to grow at the fastest rate during the forecast period, followed by consumer and enterprise.
Restraints: Competition from SiC devices in high-voltage power applications
Since their commercial launch in 2001, Silicon carbide power devices have been trying to penetrate the global power device market. This can be attributed to the efforts made for replacing pure silicon by SiC. Its acceptance grew due to the special features it exhibits when used as a semiconductor material in power applications. These include better power efficiency and advanced power handling capacity for several power functions, including power rectification, power factor correction, power amplification, and power transmission.
Opportunities: Potential use of GaN in 5G infrastructure
Telecommunications service providers are focusing on providing networks with higher capacity, lower latency, and ubiquitous connectivity. Although the current network is better than the previous one, it can be improved further in terms of latency, energy efficiency, data rates, and traffic capacity. 5G is expected to be launched commercially by 2020�2021, with advantages such as eco-friendly and efficient communication networks. Currently, GaN is commonly used in small cell, distributed antenna system (DAS), and remote radio head network densification. In the future, GaN is expected to be used as a replacement material for 5G network applications.
Challenges: High material and fabrication costs
A major issue facing the GaN power device market is the high expenditure on industry processes in the supply chain. The total average expenditure per GaN power device, of all the supply chain processes put together (including expenditure from both complete upstream and downstream), is much more than the average expenditure per pure silicon semiconductor device.
Report Scope Table
|
Report Metric |
Details |
|
Report Name |
GaN Power Device Market |
|
Base year |
2016 |
|
Forecast period |
2017-2023 |
|
Units |
Value (USD) |
|
Segments covered |
Device, Voltage Range, Application, Vertical & Geography |
|
Geographic regions covered |
North America, APAC, Europe and RoW |
|
Companies covered |
CREE (US), Infineon (Germany), Qorvo (US), Macom (US), Microsemi (US), Mitsubishi Electric (Japan), Efficient Power Conversion (US), GaN Systems (Canada), Navitas Semiconductor (US), Toshiba (Japan) |
By Device Type:
- Power Device
- Discrete Power Device
- Integrated Power Device
RF Power Device
- Discrete RF Power Device
- Integrated RF Power Device
By Voltage Range:
- <200 Volt
- 200�600 Volt
- >600 Volt
By Application:
- Power Drives
- Supply and Inverter
- Radio Frequency
By Vertical:
- Telecommunications
- Industrial
- Automotive
- Renewables
- Consumer and Enterprise
- Military, Defense, and Aerospace
- Medicals
By Geography:
- North America
- Europe
- Asia Pacific (APAC)
- Rest of the World (RoW)
Major/Key Players are CREE (US), Infineon (Germany), Qorvo (US), Macom (US), Microsemi (US), Mitsubishi Electric (Japan), Efficient Power Conversion (US), GaN Systems (Canada), Navitas Semiconductor (US), Toshiba (Japan)
Recent Developments
- MACOM launched the 500 W GaN-on-Si power transistor between the range of 1.2 GHz to 1.4 GHz for pulsed L-Band radar systems targeted for airport surveillance radar (ASR) applications. The power transistor�MAGX-101214-500�delivers 500 W output power and greater than 70% power efficiency under pulsed conditions at 50 V operation.
- Efficient Power Conversion (EPC) launched the EPC9086, a half-bridge development board that could operate up to 10 MHz. The development board was evaluated in a 12 V to point-of-load DC-DC converter application achieving efficiency levels of 86% at 10 A when switching at 5 MHz and over 80% when switching at 10 MHz.
- CREE Wolfspeed launched a series of 28V GaN HEMT RF power devices. The CG2H400 series and CG2H800 series deliver 33% higher frequency operation to 8 GHz (from 6 GHz), an additional 1.5-2.0dB of gain, as well as a 5�10% boost in operating efficiency than its earlier generation devices.
To speak to our analyst for a discussion on the above findings, click Speak to Analyst
 Exclusive indicates content/data unique to MarketsandMarkets and not available with any competitors.
Table of Contents
1 Introduction (Page No. - 15)
1.1 Objectives of the Study
1.2 Definition
1.3 Study Scope
1.3.1 Markets Covered
1.3.2 Years Considered for the Study
1.4 Currency
1.5 Limitations
1.6 Stakeholders
2 Research Methodology (Page No. - 18)
2.1 Research Data
2.1.1 Secondary Data
2.1.1.1 Secondary Sources
2.1.2 Primary Data
2.1.2.1 Primary Sources
2.1.2.2 Key Industry Insights
2.1.2.3 Breakdown of Primaries
2.2 Market Size Estimation
2.2.1 Bottom-Up Approach
2.2.2 Top-Down Approach
2.3 Market Breakdown & Data Triangulation
2.4 Research Assumptions
3 Executive Summary (Page No. - 26)
4 Premium Insights (Page No. - 32)
4.1 Attractive Opportunities for GaN Power Device Market
4.2 Market, By Device Type
4.3 Market, By Voltage Range
4.4 Market, By Application
4.5 Market, By Vertical
4.6 Market in APAC, By Vertical and By Country
4.7 Market, By Geography
5 Market Overview (Page No. - 36)
5.1 Introduction
5.2 Market Dynamics
5.2.1 Drivers
5.2.1.1 Huge Revenue Generation From the Consumer Electronics and Automotive Verticals
5.2.1.2 Wide Bandgap Property of GaN Material Encouraging Innovation
5.2.1.3 Success of GaN in RF-Power Electronics
5.2.1.4 Increasing Adoption of GaN RF Power Device in Military, Defense, and Aerospace Vertical
5.2.2 Restraints
5.2.2.1 Competition From Sic Devices in High-Voltage Power Applications
5.2.3 Opportunities
5.2.3.1 Potential Use of GaN in 5g Infrastructure
5.2.3.2 Applications in Electric and Hybrid Electric Vehicles
5.2.4 Challenges
5.2.4.1 High Material and Fabrication Costs
5.2.4.2 Design Challenges and Complexity
5.3 Value Chain Analysis
5.4 Supply Chain Analysis
6 Market, By Device Type (Page No. - 46)
6.1 Introduction
6.2 Power Device
6.2.1 Discrete Power Device
6.2.2 Integrated Power Device
6.3 RF Power Device
6.3.1 Discrete RF Power Device
6.3.2 Integrated RF Power Device
7 GaN Power Device Market, By Voltage Range (Page No. - 68)
7.1 Introduction
7.2 <200 Volt
7.3 200�600 Volt
7.4 >600 Volt
8 GaN Power Device Market, By Application (Page No. - 72)
8.1 Introduction
8.2 Power Drives
8.2.1 EV Drives
8.2.2 Industrial Drives
8.2.3 Light Detection and Ranging
8.3 Supply and Inverter
8.3.1 Switch-Mode Power Supply
8.3.2 Inverter
8.3.3 Wireless Charging
8.3.4 EV Charging
8.4 Radio Frequency
8.4.1 Radio Frequency Front-End Module
8.4.2 Repeater/Booster/Das
8.4.3 Radar and Satellite
9 Market, By Vertical (Page No. - 83)
9.1 Introduction
9.2 Telecommunications
9.3 Industrial
9.4 Automotive
9.5 Renewables
9.6 Consumer and Enterprise
9.7 Military, Defense, and Aerospace
9.8 Medical
10 Geographic Analysis (Page No. - 94)
10.1 Introduction
10.2 North America
10.2.1 US
10.2.2 Canada
10.2.3 Mexico
10.3 Europe
10.3.1 UK
10.3.2 Germany
10.3.3 France
10.3.4 Rest of Europe
10.4 APAC
10.4.1 China
10.4.2 Japan
10.4.3 South Korea
10.4.4 Rest of APAC
10.5 RoW
10.5.1 South America
10.5.2 Middle East and Africa
11 Competitive Landscape (Page No. - 109)
11.1 Overview
11.2 Market Ranking Analysis, 2016
11.3 Competitive Scenario
11.3.1 Product Launches and Developments
11.3.2 Partnerships, Contracts, Acquisitions, and Agreements
12 Company Profiles (Page No. - 113)
(Business Overview, Products Offered, Strength of Product Portfolio, Business Strategy Excellence, Recent Developments, Key Relationships)*
12.1 Key Players
12.1.1 Cree
12.1.2 Infineon
12.1.3 Qorvo
12.1.4 Macom
12.1.5 Microsemi
12.1.6 Mitsubishi Electric
12.1.7 Efficient Power Conversion (EPC)
12.1.8 GaN Systems
12.1.9 Navitas Semiconductor
12.1.10 Toshiba
*Details on Business Overview, Products Offered, Strength of Product Portfolio, Business Strategy Excellence, Recent Developments, Key Relationships Might Not Be Captured in Case of Unlisted Companies.
12.2 Key Innovators
12.2.1 Exagan
12.2.2 Visic Technologies
12.2.3 Integra Technologies.
12.2.4 Transphorm
12.2.5 Qromis
12.3 Other Key Players
12.3.1 Ganpower
12.3.2 Analog Devices
12.3.3 Panasonic
12.3.4 Texas Instruments
12.3.5 Ampleon
12.3.6 Sumitomo Electric
12.3.7 Northrop Grumman Corporation
12.3.8 Dialog Semiconductor
12.3.9 Epigan
12.3.10 Polyfet
13 Appendix (Page No. - 161)
13.1 Insights of Industry Experts
13.2 Discussion Guide
13.3 Knowledge Store: Marketsandmarkets� Subscription Portal
13.4 Introducing RT: Real-Time Market Intelligence
13.5 Available Customizations
13.6 Related Reports
13.7 Author Details
List of Tables (70 Tables)
Table 1 GaN Power Device Market, By Device Type, 2014�2023 (USD Million)
Table 2 Market, By Device Type, 2014�2023 (Million Units)
Table 3 Market for Power Device, By Vertical, 2014�2023 (USD Million)
Table 4 Market for Power Devices in North America, By Vertical, 2014�2023 (USD Million)
Table 5 Market for Power Devices in Europe, By Vertical, 2014�2023 (USD Million)
Table 6 Market for Power Device in APAC, By Vertical, 2014�2023 (USD Million)
Table 7 Market for Power Device in RoW, By Vertical, 2014�2023 (USD Million)
Table 8 Market for Power Device, By Region, 2014�2023 (USD Million)
Table 9 Market for Power Device in Telecommunications, By Region, 2014�2023 (USD Million)
Table 10 Market for Power Device in Industrial, By Region, 2014�2023 (USD Million)
Table 11 Market for Power Device in Automotive, By Region, 2014�2023 (USD Million)
Table 12 Market for Power Device in Renewables, By Region, 2014�2023 (USD Million)
Table 13 Market for Power Device in Consumer and Enterprise, By Region, 2014�2023 (USD Million)
Table 14 Market for Power Device in Military, Defense, and Aerospace, By Region, 2014�2023 (USD Million)
Table 15 Market for Power Device in Medical, By Region, 2014�2023 (USD Million)
Table 16 Market for Power Device in Telecommunications, By Application, 2014�2023 (USD Million)
Table 17 Market for Power Device in Industrial, By Application, 2014�2023 (USD Million)
Table 18 Market for Power Device in Automotive, By Application, 2014�2023 (USD Million)
Table 19 Market for Power Device in Consumer and Enterprise, By Application, 2014�2023 (USD Million)
Table 20 Market for Power Device in Military, Defense, and Aerospace, By Application, 2014�2023 (USD Million)
Table 21 Market for Power Device in Medical, By Application, 2014�2023 (USD Million)
Table 22 Market for Power Device, By Type, 2014�2023 (USD Million)
Table 23 Market for RF Power Device, By Vertical, 2014�2023 (USD Million)
Table 24 Market for RF Power Device in North America, By Vertical, 2014�2023 (USD Million)
Table 25 Market for RF Power Device in Europe, By Vertical, 2014�2023 (USD Million)
Table 26 Market for RF Power Device in APAC, By Vertical, 2014�2023 (USD Million)
Table 27 Market for RF Power Device in RoW, By Vertical, 2014�2023 (USD Million)
Table 28 Market for RF Power Device, By Region, 2014�2023 (USD Million)
Table 29 Market for RF Power Device in Telecommunications, By Region, 2014�2023 (USD Million)
Table 30 Market for RF Power Device in Industrial, By Region, 2014�2023 (USD Million)
Table 31 Market for RF Power Device in Automotive, By Region, 2014�2023 (USD Million)
Table 32 Market for RF Power Device in Renewables, By Region, 2014�2023 (USD Million)
Table 33 Market for RF Power Device in Consumer and Enterprise, By Region, 2014�2023 (USD Million)
Table 34 Market for RF Power Device in Military, Defense, and Aerospace, By Region, 2014�2023 (USD Million)
Table 35 Market for RF Power Device in Telecommunications, By Application, 2014�2023 (USD Million)
Table 36 Market for RF Power Device in Automotive, By Application, 2014�2023 (USD Million)
Table 37 Market for RF Power Device in Renewables, By Application, 2014�2023 (USD Million)
Table 38 Market for RF Power Device in Consumer and Enterprise, By Application, 2014�2023 (USD Million)
Table 39 Market for RF Power Device in Military, Defense, and Aerospace, By Application, 2014�2023 (USD Million)
Table 40 Market for RF Power Device, By Type, 2014�2023 (USD Million)
Table 41 Market, By Voltage Range, 2014�2023 (USD Million)
Table 42 Market, By Application, 2014�2023 (USD Million)
Table 43 Market for Power Drives, By Application, 2014�2023 (USD Million)
Table 44 Market for Lidar, By Vertical, 2014�2023 (USD Million)
Table 45 Market for Supply and Inverter, By Application, 2014�2023 (USD Million)
Table 46 Market for Smps, By Vertical, 2014�2023 (USD Million)
Table 47 Market for Inverters, By Vertical, 2014�2023 (USD Million)
Table 48 Market for Wireless Charging, By Vertical, 2014�2023 (USD Million)
Table 49 Market for Radio Frequency, By Application, 2014�2023 (USD Million)
Table 50 Market for RF Fem, By Vertical, 2014�2023 (USD Million)
Table 51 Market for Repeater/Booster/Das, By Vertical, 2014�2023 (USD Million)
Table 52 Market for Radar and Satellite, By Application, 2014�2023 (USD Million)
Table 53 Market, By Vertical, 2014�2023 (USD Million)
Table 54 Market for Telecommunications, By Region, 2014�2023 (USD Million)
Table 55 Market for Industrial, By Region, 2014�2023 (USD Million)
Table 56 Market for Automotive, By Region, 2014�2023 (USD Million)
Table 57 Market for Renewables, By Region, 2014�2023 (USD Million)
Table 58 Market for Consumer and Enterprise, By Region, 2014�2023 (USD Million)
Table 59 Market for Military, Defense, and Aerospace, By Region, 2014�2023 (USD Million)
Table 60 Market for Medical, By Region, 2014�2023 (USD Million)
Table 61 Market, By Region, 2014�2023 (USD Million)
Table 62 Market in North America, By Country, 2014�2023 (USD Million)
Table 63 Market in North America, By Vertical, 2014�2023 (USD Million)
Table 64 Market in Europe, By Country, 2014�2023 (USD Million)
Table 65 Market in Europe, By Vertical, 2014�2023 (USD Million)
Table 66 Market in APAC, By Country, 2014�2023 (USD Million)
Table 67 Market in APAC, By Vertical, 2014�2023 (USD Million)
Table 68 Market in RoW, By Vertical, 2014�2023 (USD Million)
Table 69 10 Most Recent Product Launches in the market
Table 70 Partnerships, Contracts, and Agreements in the market
List of Figures (51 Figures)
Figure 1 GaN Power Device Market: Segmentation
Figure 2 Market: Research Design
Figure 3 Bottom-Up Approach to Arrive at the Market Size
Figure 4 Top-Down Approach to Arrive at the Market Size
Figure 5 Data Triangulation
Figure 6 Assumptions of the Research Study
Figure 7 Market Snapshot, 2014�2023 (USD Million)
Figure 8 GaN Power Device, By Device Type, 2014�2023 (USD Million)
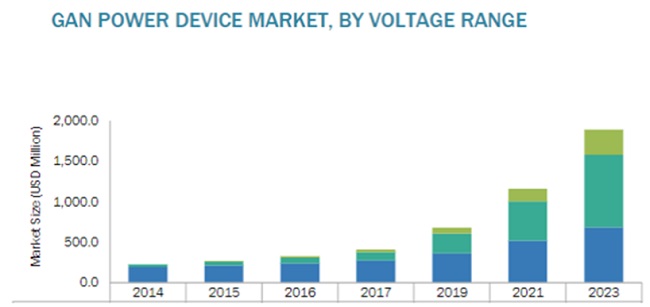
Figure 9 GaN Power Device, By Voltage Range, 2014�2023 (USD Million)
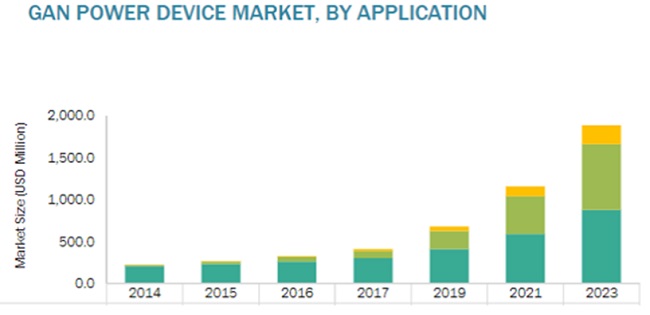
Figure 10 GaN Power Device, By Application, 2014�2023 (USD Million)
Figure 11 Market for Power Drives Expected to Grow at Highest CAGR During Forecast Period
Figure 12 Market, By Vertical (USD Million)
Figure 13 Market, By Region
Figure 14 Telecommunications to Drive Growth of market During Forecast Period
Figure 15 Power Expected to Hold Larger Share of market By 2023
Figure 16 200�600 Volt Expected to Hold Largest Share of market By 2023
Figure 17 Radio Frequency is Expected to Hold Largest Share of market During Forecast Period
Figure 18 Telecommunications Expected to Hold Largest Share of market During Forecast Period
Figure 19 Telecommunications Held Largest Share of market in China in 2017
Figure 20 APAC Expected to Witness Highest CAGR in market Between 2017 and 2023
Figure 21 Drivers, Restraints, Opportunities, & Challenges for Market
Figure 22 Value Chain Analysis: Major Value is Added During R&D, Design, & Manufacturing Phases
Figure 23 Supply Chain Analysis
Figure 24 Market Segmentation: By Device Type
Figure 25 Power Expected to Witness Highest CAGR in market During Forecast Period
Figure 26 Automotive Expected to Witness Highest CAGR in market During Forecast Period
Figure 27 Discrete Power Expected to Hold Larger Share of Market During Forecast Period
Figure 28 Consumer and Enterprise Expected to Witness Highest CAGR in Market During Forecast Period
Figure 29 Market Segmentation, By Voltage Range
Figure 30 >600 Voltage Expected to Witness Highest CAGR in Market During Forecast Period
Figure 31 Market Segmentation: By Application
Figure 32 Power Drives Expected to Witness Highest CAGR in market During Forecast Period
Figure 33 EV Charging Expected to Witness Highest CAGR in market During Forecast Period
Figure 34 RF Fem Expected to Hold Larger Share of Market During Forecast Period
Figure 35 Market Segmentation, By Vertical
Figure 36 Medical Expected to Witness Highest CAGR in Market During Forecast Period
Figure 37 Market: By Geography
Figure 38 Geographic Snapshot of Market
Figure 39 North America: Snapshot of market
Figure 40 Europe: Snapshot of market
Figure 41 APAC: Snapshot of market
Figure 42 RoW: Snapshot of market
Figure 43 Companies in the Market Adopted Product Launches as the Key Growth Strategy Between January 2014 and October 2017
Figure 44 Market Evaluation Framework
Figure 45 Cree: Company Snapshot
Figure 46 Infineon: Company Snapshot
Figure 47 Qorvo: Company Snapshot
Figure 48 Macom: Company Snapshot
Figure 49 Microsemi: Company Snapshot
Figure 50 Mitsubishi Electric: Company Snapshot
Figure 51 Toshiba: Company Snapshot


Growth opportunities and latent adjacency in GaN Power Device Market