Gas-Insulated Substation Market by Voltage Type (Medium, High, and Extra High), Installation (Indoor and Outdoor), Output Power, End User (Power Transmission Utility, Distribution Utility, and Generation Utility), and Region - Global Forecast to 2023


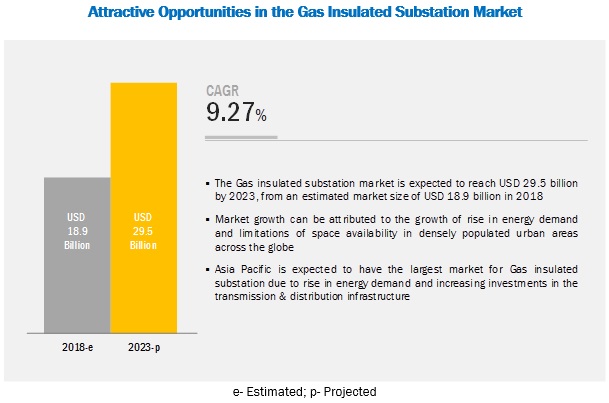
[132 Pages Report] The global gas-insulated substation market is projected to reach a size of USD 29.5 billion by 2023, at a CAGR of 9.27%, from an estimated USD 18.9 billion in 2018. This can be attributed to the growth in renewable power generation, increasing investments in the transmission & distribution infrastructure, the rise in energy demand and limitations of space availability in densely populated urban areas, and government initiatives toward improving electricity access.
By voltage type, the high voltage segment is expected to be the largest contributor in the market during the forecast period
The report segments the gas-insulated substation, by voltage type, into medium, high, and extra high. The high voltage segment is expected to hold the largest market share by 2023, due to its reliability and protection for the grid infrastructure. They are widely used in case of critical switchyard of large power generation plants. A majority of the gas-insulated substations connected to the high voltage transmission grid are the indoor type. Moreover, the high voltage segment is driven by the refurbishment of old power transmission infrastructure in developed countries of Europe and North America.
The power transmission utility segment holds the largest market share during the forecast period
The power transmission utility, by end user, is expected to dominate the gas-insulated substation industry by 2023. Power transmission utility is primarily driven by the addition of transmission lines which leads to the addition of high voltage substations. Gas insulated switchgear plays a vital role in grid protection and efficient flow of power, as well as protection and relaying of the transmission circuit. High voltage transmission and extra high voltage transmission lies under the jurisdiction of the power transmission utilities. These utilities are responsible for the transmission grid expansion, refurbishment, as well as procurement of high voltage equipment.
By Installation, the outdoor segment is expected to grow at the fastest rate during the forecast period
The outdoor segment is expected to grow at the fastest rate during the forecast period. Outdoor gas insulated substations provide reliable operations in high-voltage transmission and medium voltage, and are preferred for transmission and distribution of electricity over a long distance. Moreover, Asia Pacific holds the largest market share for gas insulated substations. Factors such as increased power consumption,government mandates on energy efficiency,rising influx of renewable sources in the energy mix, renovation, modernization, and upgradation of ageing hydropower plants are to drive the gas-insulated substation industry in the region.
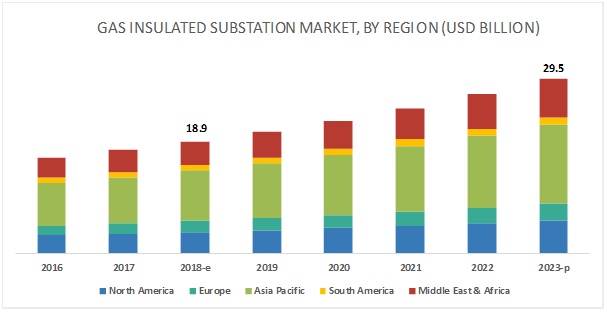
Asia Pacific is expected to account for the largest market size during the forecast period
In this report, the gas-insulated substations market has been analyzed with respect to 6 regions, namely, North America, Europe, South America, Asia Pacific, and the Middle East and Africa. The market in Asia Pacific is estimated to be the largest market from 2018 to 2023. According to EIA, China and India together will account for consumption of one-half of the total energy consumption, by 2035. Southeast Asia is another promising and dynamic energy market with energy demand grown by 60% in the last 15 years. The extending generation connections in Asia Pacific is another major driver for expanding investments in the transmission and distribution network.
The major players in the global gas-insulated substation market are ABB (Switzerland), Siemens (Germany), Hitachi (Japan), Toshiba Corporation (Japan), and General Electric (US). Between 2014 and 2018, the companies in the market focused on contracts & agreements as their key strategy to increase their market shares and regional presence.
Scope of the report
|
Report Metric |
Details |
|
Market size available for years |
2016�2023 |
|
Base year considered |
2017 |
|
Forecast period |
2018�2023 |
|
Forecast units |
Value (USD) |
|
Segments covered |
Installation, Voltage, End-User, and Region |
|
Geographies covered |
North America, Asia Pacific, South America, Europe, and the Middle East & Africa |
|
Companies covered |
ABB (Switzerland), GE (US), Siemens (Germany), Hitachi, Ltd. (Japan), L&T (India), and Toshiba Corporation (Japan) |
This research report categorizes the gas-insulated substations market based on installation, voltage rating, end-user, and region
On the basis of installation, the market has been segmented as follows:
- Indoor
- Outdoor
On the basis of voltage rating, the market has been segmented as follows:
- Medium voltage (Up to 72.5 kV)
- High Voltage (72.5 kV � 220 kV)
- Extra High Voltage (220 kV � 765 kV)
On the basis of by end-user, the market has been segmented as follows:
- Power transmission utility
- Power distribution utility
- Power generation utility
- Other (heavy industries & railways)
On the basis of by region, the market has been segmented as follows:
- Asia Pacific
- Europe
- North America
- Middle East & Africa
- South America
Key Questions addressed by the report
- The report identifies and addresses key markets for the gas-insulated substation, which would help manufacturers review the growth in demand.
- The report helps system providers understand the pulse of the market and provides insights into drivers, restraints, opportunities, and challenges.
- The report will help key players understand the strategies of their competitors better and make better strategic decisions.
- The report addresses the market share analysis of key players in the market, and with the help of this, companies can enhance their revenues in the respective market.
- The report provides insights about emerging geographies for the market, and the entire market ecosystem can gain competitive advantage from such insights.
Frequently Asked Questions (FAQ):
What are the growth projections for next five years in the Gas-Insulated Substation market?
Gas-Insulated Substation market is projected to grow at CAGR of 9.27% during the forecast period.
Which installation type is the fastest growing market in the Gas-Insulated Substation by 2023?
Outdoor segment is projected to grow at fastest rate.
Which region held the highest market share in Gas-Insulated Substation?
Asia Pacific is expected to account for the largest market size during the forecast period.
Which voltage type of the Gas-Insulated Substation will lead the market by 2023?
High voltage segment are reliable and protection for the grid infrastructure.
What organic strategies are used by the leading player in Gas-Insulated Substation to gain increased market share?
Contracts & agreements was the key strategy adopted by players to increase their respective market share and regional presence.
To speak to our analyst for a discussion on the above findings, click Speak to Analyst
 Exclusive indicates content/data unique to MarketsandMarkets and not available with any competitors.
Table of Contents
1 Introduction (Page No. - 16)
1.1 Objectives of the Study
1.2 Definition
1.3 Market Scope
1.3.1 Markets Covered
1.3.2 Regional Scope
1.3.3 Years Considered for the Study
1.4 Currency
1.5 Stakeholders
2 Research Methodology (Page No. - 19)
2.1 Research Methodology Scope
2.2 Market Size Estimation
2.2.1 Ideal Demand-Side Analysis
2.2.1.1 Assumptions
2.2.1.2 Calculation
2.2.2 Supply-Side Analysis
2.2.2.1 Assumptions
2.2.2.2 Calculation
2.2.3 Forecast
2.3 Statistics
2.3.1 T&D Investment, By Region (2014�2035)
2.4 Some of the Insights of Industry Experts
3 Executive Summary (Page No. - 24)
4 Premium Insights (Page No. - 28)
4.1 Attractive Opportunities in the Gas-Insulated Substation Market
4.2 Asia Pacific: Market Size, By End-User & Country
4.3 Gas-Insulated Substation, By Country
4.4 Gas-Insulated Substation, By Voltage Rating
4.5 Gas-Insulated Substation, By Voltage Rating
4.6 Gas-Insulated Substation, By Installation
5 Market Overview (Page No. - 32)
5.1 Introduction
5.2 Market Dynamics
5.2.1 Drivers
5.2.1.1 Rising Energy Demand and Space Constraint in Densely Populated Urban Areas
5.2.1.2 Increasing Investments in T&D Sector
5.2.2 Restraints
5.2.2.1 High Cost of Equipment as Compared to Air-Insulated Substation
5.2.2.2 Stringent Environmental & Safety Regulations
5.2.3 Opportunities
5.2.3.1 Development of an Environment-Friendly Alternative to Sf6 Gas
5.2.3.2 Adoption of the HVDC Technology
5.2.4 Challenges
5.2.4.1 Delays in Grid Expansion Projects
6 Gas-Insulated Substation, By Voltage (Page No. - 37)
6.1 Introduction
6.2 Medium Voltage
6.2.1 Rapid Development of Residential and Commercial Infrastructure
6.3 High Voltage
6.3.1 Increasing Investments for Power Generation Plants
6.4 Extra-High Voltage
6.4.1 Rising Focus on Development of Power Transmission for Long Distance
7 Gas-Insulated Substation Market, By Installation (Page No. - 42)
7.1 Introduction
7.2 Indoor
7.2.1 Increasing Investments in the Energy Sector Across the Nation
7.3 Outdoor
7.3.1 Rising Focus on Development of Power Transmission and Distribution for Long Distance
8 Gas-Insulated Substations Market, By End-User (Page No. - 46)
8.1 Introduction
8.2 Power Transmission Utility
8.2.1 Increasing Investment for Development of Transmission Grid Expansion and Refurbishment
8.3 Power Distribution Utility
8.3.1 Space Constraint Meanwhile Rising Demand for Electricity
8.4 Power Generation Utility
8.4.1 Rising Demand for Efficient and Long- Lasting Power Infrastructure
8.5 Others
9 Gas-Insulated Substation, By Region (Page No. - 52)
9.1 Introduction
9.2 North America
9.2.1 By Voltage Type
9.2.2 By Installation
9.2.3 By End-User
9.2.4 By Country
9.2.4.1 US
9.2.4.1.1 Increasing Investments for Replacing and Refurbishing the AGED Transmission Infrastructure
9.2.4.2 Canada
9.2.4.2.1 Rising Number of Projects From Renewables, Especially Offshore Wind, Which Demands Further Substations to Connect Electricity to Grid
9.2.4.3 Mexico
9.2.4.3.1 Improving and Modernizing Transmission & Distribution Networks Under Government's Reforms
9.3 Asia Pacific
9.3.1 By Voltage Type
9.3.2 By Installation
9.3.3 By End-User
9.3.4 By Country
9.3.4.1 China
9.3.4.1.1 Rising Demand for Efficient and Long-Lasting Power Infrastructure
9.3.4.2 India
9.3.4.2.1 Increased Transformation Capacity Along With Demand for 765 Kv Transmission Lines
9.3.4.3 Japan
9.3.4.3.1 Renovation of Grid Infrastructure to Integrate It With Distributed Energy Sources
9.3.4.4 Australia
9.3.4.4.1 Adoption of New Technologies, Including Electric Vehicles, Requiring Advanced Substations for Power Reliability
9.3.4.5 South Korea
9.3.4.5.1 Rising Demand for Power From Densely Populated Areas Along With Modernization of Grid
9.3.4.6 Indonesia
9.3.4.6.1 Increasing Demand for Electricity and Plan to Develop Small and Medium Wind Energy Systems
9.3.4.7 Rest of Asia Pacific
9.4 Europe
9.4.1 By Voltage Type
9.4.2 By Installation
9.4.3 By End-User
9.4.4 By Country
9.4.4.1 UK
9.4.4.1.1 Rapid Development of ICT Buildings and AGED Infrastructure
9.4.4.2 Germany
9.4.4.2.1 Continuous Electricity Addition Through Renewables Along With Construction of HVDC Lines
9.4.4.3 France
9.4.4.3.1 Reducing Power Dependence on Nuclear Sources and Increased Demand for Grid Infrastructure to Connect Renewables to Grid
9.4.4.4 Spain
9.4.4.4.1 Decentralization of Power Sector Along With Grid Interconnectivity
9.4.4.5 Norway
9.4.4.5.1 Construction of 420 Kv of Transmission Lines for Increased Wind Production
9.4.4.6 Rest of Europe
9.5 Middle East & Africa
9.5.1 By Voltage Type
9.5.2 By Installation
9.5.3 By End-User
9.5.4 By Country
9.5.4.1 Saudi Arabia
9.5.4.1.1 Plans for Construction of High Voltage Transmission Networks Along With Establishment of New Transmission Substations
9.5.4.2 UAE
9.5.4.2.1 Energy Generation Through Nuclear Reactors, Demanding for Adequate Transmission Infrastructure
9.5.4.3 South Africa
9.5.4.3.1 Rising Focus on Development of High Voltage Transmission Network
9.5.4.4 Egypt
9.5.4.4.1 Development of Power Infrastructure to Cater to the Rapidly Growing Power Demand
9.5.4.5 Kuwait
9.5.4.5.1 Space Constraint and Rising Demand for Electricity, Driving Construction of Space Efficient Gas-Insulated Substation
9.5.4.6 Rest of the Middle East & Africa
9.6 South America
9.6.1 By Voltage Type
9.6.2 By Installation
9.6.3 By End-User
9.6.4 By Country
9.6.4.1 Brazil
9.6.4.1.1 Increasing Dependence on Hydroelectric Power Source, Driving the Demand for Substations
9.6.4.2 Argentina
9.6.4.2.1 Construction Plans for 500 Kv High Voltage Transmission Lines By 2018
9.6.4.3 Chile
9.6.4.3.1 Rising Investments in Energy Sector Across the Nation
9.6.4.4 Rest of South America
10 Competitive Landscape (Page No. - 92)
10.1 Overview
10.2 Ranking of Players
10.3 Competitive Scenario
10.3.1 New Product Development
10.3.2 Expansions & Investments
10.3.3 Contracts & Agreements
10.3.4 Mergers & Acquisitions
10.4 Micro Quadrant Overview
10.4.1 Visionary Leaders:
10.4.2 Innovators:
10.4.3 Dynamic Differentiators:
11 Company Profile (Page No. - 98)
11.1 Company Benchmarking
(Business Overview, Products Offered, Recent Developments, MnM View)*
11.2 Hitachi
11.3 General Electric
11.4 ABB
11.5 Mitsubishi Electric
11.6 Toshiba Corporation
11.7 Larsen & Toubro
11.8 Siemens AG
11.9 CG Power and Industrial Solutions
11.10 Hyosung
11.11 Bharat Heavy Electricals Limited
11.12 Tbea Co. Ltd.
11.13 Elsewedy Electric
*Details on Business overview, Products offered, Recent Developments, SWOT analysis, MNM view might not be captured in case of unlisted companies.
12 Appendix (Page No. - 125)
12.1 Insights of Industry Experts
12.2 Discussion Guide
12.1 Knowledge Store: Marketsandmarkets� Subscription Portal
12.2 Available Customizations
12.3 Related Reports
12.4 Author Details
List of Tables (65 Tables)
Table 1 Gas-Insulated Substation Market Snapshot
Table 2 Global Urban Population Overview, By Region, 1990, 2014, 2050
Table 3 Global T&D Infrastructure Expansion Plans
Table 4 Key HVDC Projects By Abb
Table 5 Market Size, By Voltage, 2016�2023 (USD Million)
Table 6 Medium Voltage: Market Size, By Region, 2016�2023 (USD Million)
Table 7 High Voltage: Market Size, By Region, 2016�2023 (USD Million)
Table 8 Extra-High Voltage: Market Size, By Region, 2016�2023 (USD Million)
Table 9 Market Size, By Installation, 2016�2023 (USD Million)
Table 10 Asia Indoor: Market Size, By Region, 2016�2023 (USD Million)
Table 11 Outdoor: Market Size, By Region, 2016�2023 (USD Million)
Table 12 Market Size, By End-User, 2016�2023 (USD Billion)
Table 13 Power Transmission Utility: Market Size, By Region, 2016�2023 (USD Million)
Table 14 Power Distribution Utility: Market Size, By Region, 2016�2023 (USD Million)
Table 15 Power Generation Utility: Market Size, By Region, 2016�2023 (USD Million)
Table 16 Others: Market Size, By Region, 2016�2023 (USD Million)
Table 17 Market, By Region, 2016�2023 (USD Million)
Table 18 Market, By Top Country, 2016�2023 (USD Million)
Table 19 North America: Gas-Insulated Substations Market Size, By Voltage Type, 2016�2023 (USD Million)
Table 20 North America: Market Size, By Installation, 2016�2023 (USD Million)
Table 21 North America: Market Size, By End-User, 2016�2023 (USD Million)
Table 22 North America: Market Size, By Country, 2016�2023 (USD Million)
Table 23 US: Market Size, By End-User, 2016�2023 (USD Million)
Table 24 Canada: Market Size, By End-User, 2016�2023 (USD Million)
Table 25 Mexico: Market Size, By End-User, 2016�2023 (USD Million)
Table 26 Asia Pacific: Gas-Insulated Substations Market Size, By Voltage Type, 2016�2023 (USD Million)
Table 27 Asia Pacific: Market Size, By Installation, 2016�2023 (USD Million)
Table 28 Asia Pacific: Market Size, By End-User, 2016�2023 (USD Million)
Table 29 Asia Pacific: Market Size, By Country, 2016�2023 (USD Million)
Table 30 China: Market Size, By End-User, 2016�2023 (USD Million)
Table 31 India: Market Size, By End-User, 2016�2023 (USD Million)
Table 32 Japan: Market Size, By End-User, 2016�2023 (USD Million)
Table 33 Australia: Market Size, By End-User, 2016�2023 (USD Million)
Table 34 South Korea: Market Size, By End-User, 2016�2023 (USD Million)
Table 35 Indonesia: Market Size, By End-User, 2016�2023 (USD Million)
Table 36 Rest of Asia Pacific: Market Size, By End-User, 2016�2023 (USD Million)
Table 37 Europe: Gas-Insulated Substations Market Size, By Voltage Type, 2016�2023 (USD Million)
Table 38 Europe: Market Size, By Installation, 2016�2023 (USD Million)
Table 39 Europe: Market Size, By End-User, 2016�2023 (USD Million)
Table 40 Europe: Market Size, By Country, 2016�2023 (USD Million)
Table 41 UK: Market Size, By End-User, 2016�2023 (USD Million)
Table 42 Germany: Market Size, By End-User, 2016�2023 (USD Million)
Table 43 France: Market Size, By End-User, 2016�2023 (USD Million)
Table 44 Spain: Market Size, By End-User, 2016�2023 (USD Million)
Table 45 Norway: Market Size, By End-User, 2016�2023 (USD Million)
Table 46 Rest of Europe: Market Size, By End-User, 2016�2023 (USD Million)
Table 47 Middle East & Africa: Market Size, By Voltage Type, 2016�2023 (USD Million)
Table 48 Middle East & Africa: Market Size, By Installation, 2016�2023 (USD Million)
Table 49 Middle East & Africa: Market Size, By End-User, 2016�2023 (USD Million)
Table 50 Middle East & Africa: Market Size, By Country, 2016�2023 (USD Million)
Table 51 Saudi Arabia: Market Size, By End-User, 2016�2023 (USD Million)
Table 52 UAE: Market Size, By End-User, 2016�2023 (USD Million)
Table 53 South Africa: Market Size, By End-User, 2016�2023 (USD Million)
Table 54 Egypt: Market Size, By End-User, 2016�2023 (USD Million)
Table 55 Kuwait: Market Size, By End-User, 2016�2023 (USD Million)
Table 56 Rest of Middle East & Africa: Market Size, By End-User, 2016�2023 (USD Million)
Table 57 South America: Gas-Insulated Substations Market Size, By Voltage Type, 2016�2023 (USD Million)
Table 58 South America: Market Size, By Installation, 2016�2023 (USD Million)
Table 59 South America: Market Size, By End-User, 2016�2023 (USD Million)
Table 60 South America: Market Size, By Country, 2016�2023 (USD Million)
Table 61 Brazil: Market Size, By End-User, 2016�2023 (USD Million)
Table 62 Argentina: Market Size, By End-User, 2016�2023 (USD Million)
Table 63 Chile: Market Size, By End-User, 2016�2023 (USD Million)
Table 64 Rest of South America: Market Size, By End-User, 2016�2023 (USD Million)
Table 65 Developments of Key Players in the Market, 2014�November 2018
List of Figures (33 Figures)
Figure 1 Substation Installation of Key End-User Industries is the Major Determining Factor for Gas-Insulated Substations
Figure 2 Asia Pacific Held the Largest Share of the Market in 2017
Figure 3 High Voltage Segment of the Gas-Insulated Substations Market is Expected to Grow at the Highest CAGR During the Forecast Period
Figure 4 Power Transmission Utility Segment, By End-User, is Expected to Grow at the Highest CAGR During the Forecast Period
Figure 5 Outdoor Type Segment of the Market is Expected to Grow at the Highest CAGR During the Forecast Period
Figure 6 Rising Investments in Transmission & Distribution Infrastructure are Expected to Drive the Gas-Insulated Substation Market During the Forecast Period
Figure 7 Power Transmission Utility Segment & the Chinese Market Held the Maximum Share of the Gas-Insulated Substation in Asia Pacific in 2017
Figure 8 Saudi Arabia is Expected to Grow at the Highest CAGR During the Forecast Period
Figure 9 High Voltage Segment is Expected to Dominate the Market During the Forecast Period
Figure 10 Indoor Segment is Expected to Dominate the Market During the Forecast Period
Figure 11 Indoor Segment By Installation, is Expected to Dominate the Market During the Forecast Period
Figure 12 Gas-Insulated Substation: Drivers, Restraints, Opportunities, & Challenges
Figure 13 Market for High Voltage is Expected to Hold the Largest Market Share By 2023
Figure 14 Outdoor Installation Segment is Expected to Have the Highest Growth During the Forecast Period
Figure 15 Power Transmission Utility Segment is Expected to Hold the Largest Market Share in 2023
Figure 16 Regional Snapshot: the Market in Asia Pacific is Expected to Grow at the Highest CAGR During the Forecast Period
Figure 17 Gas-Insulated Substations Market Share (Value), By Region, 2017
Figure 18 Asia Pacific: Market Snapshot
Figure 19 Middle East & Africa: Market Snapshot
Figure 20 Key Developments in the Market, 2014� November 2018
Figure 21 Ranking of Key Players & Industry Concentration, 2017
Figure 22 Supply Chain Gas Insulated Substation Market (Global), Competitive Leadership Mapping, 2018
Figure 23 Hitachi: Company Snapshot
Figure 24 General Electric: Company Snapshot
Figure 25 ABB: Company Snapshot
Figure 26 Mitsubishi Electric: Company Snapshot
Figure 27 Toshiba Corporation: Company Snapshot
Figure 28 L&T: Company Snapshot
Figure 29 Siemens AG: Company Snapshot
Figure 30 CG Power and Industrial Solutions Limited: Company Snapshot
Figure 31 Hyosung: Company Snapshot
Figure 32 Bhel: Company Snapshot
Figure 33 Elsewedy Electric: Company Snapshot
The study involved 4 major activities in estimating the current size of the gas-insulated substation market. Exhaustive secondary research was done to collect information on the peer and parent markets. The next step was to validate these findings, assumptions, and sizing with industry experts across the value chain through primary research. Both top-down and bottom-up approaches were employed to estimate the complete market size. Thereafter, market breakdown and data triangulation were used to estimate the market size of the segments and subsegments.
Secondary Research
This research study involved the use of extensive secondary sources, directories, and databases, such as Hoover�s, Bloomberg BusinessWeek, Factiva, and OneSource, to identify and collect information useful for a technical, market-oriented, and commercial study of the global market. The other secondary sources included annual reports, press releases & investor presentations of companies, white papers, certified publications, articles by recognized authors, manufacturer associations, trade directories, and databases.
Primary Research
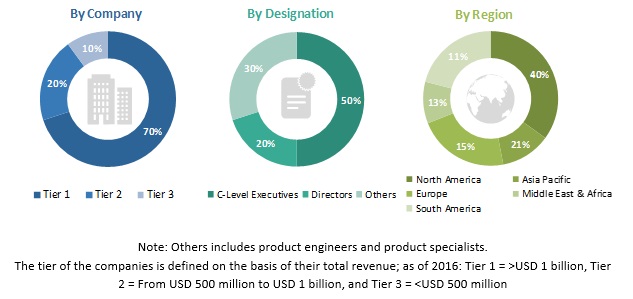
The gas-insulated substations market comprises several stakeholders such as substation manufacturers, power transmission utilities, power distribution utilities, consultants and advisory firms, substation EPC companies, and substation component distributors in the supply chain. The demand side of this market is characterized by the rising demand for transmission and distribution infrastructure in the developing countries, whereas, demand for the refurbishment of aged power infrastructure in the developed nations. Moreover, the demand is also driven by land prices getting higher, while power generation projects are rising from renewable sources across the globe. The supply side is characterized by rising demand for contracts from the transmission utilities, and mergers & acquisition among big players. Various primary sources from both, the supply and demand sides of the market were interviewed to obtain qualitative and quantitative information. Following is the breakdown of primary respondents:
To know about the assumptions considered for the study, download the pdf brochure
Market Size Estimation
Both top-down and bottom-up approaches were used to estimate and validate the total size of the market. These methods were also used extensively to estimate the size of various subsegments in the market. The research methodology used to estimate the market size includes the following:
- The key players in the industry and market have been identified through extensive secondary research.
- The industry�s supply chain and market size, in terms of value, have been determined through primary and secondary research processes.
- All percentage shares, splits, and breakdowns have been determined using secondary sources and verified through primary sources.
Data Triangulation
After arriving at the overall market size from estimation process explained above, the total market has been split into several segments and subsegments. To complete the overall market engineering process and arrive at the exact statistics for all the segments and subsegments, the data triangulation and market breakdown processes have been employed, wherever applicable. The data has been triangulated by studying various factors and trends from both the demand- and supply sides. Along with this, the market has been validated using both the top-down and bottom-up approaches.
Objectives of the Study
- To define, describe, and forecast the global gas-insulated substations market based on installation, voltage rating, end-user, and region
- To provide detailed information on the major factors influencing the growth of the market (drivers, restraints, opportunities, and industry-specific challenges)
- To strategically analyze the gas-insulated substations market with respect to individual growth trends, future expansions, and contributions to the market
- To analyze market opportunities for stakeholders and details of a competitive landscape for market leaders
- To forecast the growth of the gas-insulated substations market with respect to major regions (North America, Europe, Asia Pacific, South America, and the Middle East & Africa)
- To profile key players and comprehensively analyze their market ranking and core competencies
- To analyze competitive developments such as mergers & acquisitions, expansions, new product developments, and contracts & agreements in the field of gas-insulated substations market
Available Customizations:
With the given market data, MarketsandMarkets offers customizations as per the client�s specific needs. The following customization options are available for this report:
Company Information
Detailed analyses and profiling of additional market players (up to 5)


Growth opportunities and latent adjacency in Gas-Insulated Substation Market