Glass Insulation Market by Type (Insulating Glass Unit, Glass Wool, Cellular Glass), Application (Non-Residential Construction, Residential Construction, Industrial, HVAC), and Region - Global Forecast to 2021


[149 Pages Report] The global glass insulation market is projected to reach USD 58.71 Billion by 2021, at a CAGR of 7.6% between 2016. The years considered for the study are:
- Historical Year � 2014
- Base Year � 2015
- Estimated Year � 2016
- Projected Year � 2021
- Forecast Period � 2016 to 2021
For the companies profiled in the report, 2015 has been considered as the base year. In certain cases, wherein information is unavailable for the base year, the years prior to it have been considered.
The Objectives of this Study are:
- To define, describe, and forecast the glass insulation market based on type, application, and region
- To analyze and forecast the volume (kilotons) and value (USD million) of the global market
- To provide detailed information regarding key factors (drivers, restraints, opportunities, and industry-specific challenges) influencing the growth of the market
- To strategically analyze micro markets with respect to individual growth trends, future prospects, and contribution made to the overall market
- To analyze opportunities in the market for stakeholders and draw a competitive landscape of the market
- To forecast the market size in terms of value with respect to five main regions (along with countries), namely, Asia-Pacific, North America, Europe, Middle East & Africa, and Latin America.
- To strategically profile key players and comprehensively analyze their core competencies
- To analyze competitive developments, such as joint ventures, mergers & acquisitions, new product developments, and research & development activities (R&D) in the global glass insulation market
Research Methodology:
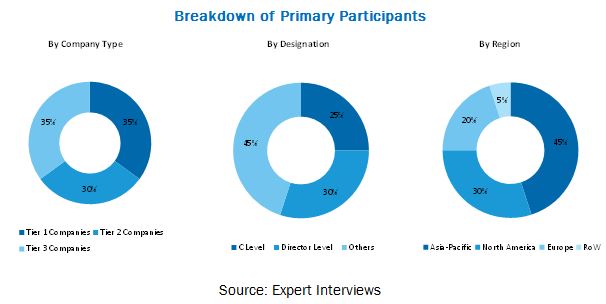
The research methodology used to estimate and forecast the global market involves capturing data on key vendor revenues through secondary research (annual reports, press releases & investor presentations of companies, white papers, solvent journals, certified publications & articles from recognized authors, authenticated directories, and databases). The vendor offerings are also taken into consideration to determine the market segmentation. The bottom-up procedure was employed to arrive at the overall size of the global glass insulation market. After arriving at the overall market size, the total market was split into several segments and subsegments, which were later verified through primary research by conducting extensive interviews with key personnel, such as CEOs, VPs, directors, and executives. The data triangulation and market breakdown procedures were employed to complete the overall market engineering process and arrive at the exact statistics for all segments and subsegments of the market. The breakdown of profiles of primaries is depicted in the figure below.
To know about the assumptions considered for the study, download the pdf brochure
The glass insulation market has a diversified ecosystem, including raw material suppliers along with vendors, end users, and government organizations. Key players in this market are Owens Corning (U.S.), Nippon Sheet Glass Co. Ltd. (Japan), Johns Manville (U.S.), Knauf Insulation (U.S.), PPG Industries, Inc. (U.S.), Certain Teed Corporation (U.S.), Pittsburgh Corning Corporation (U.S.), Arabian Fiberglass Insulation Co., Ltd. (Saudi Arabia), Saint-Gobain ISOVER (U.S.), and Saint-Gobain Glassolutions (U.K.), among others. The government & research organizations, raw material suppliers & distributors, construction companies, and industry associations are considered as critical stakeholders in this study.
Target Audience
- Glass insulation producers
- Glass insulation traders, distributors, and suppliers
- Manufacturers in end-use industries
- Associations and industry bodies
Scope of the Report: This research report categorizes the global glass insulation market on the basis of type, application, and region; forecasting volumes and revenues as well as analyzing trends in each of these submarkets.
On the basis of Type, the market is segmented into:
- Insulating glass units
- Glass wool
- Cellular glass
On the basis of Application, the market is segmented into:
- Non-residential construction
- Residential construction
- Industrial
- HVAC
- Others (OEM products, railways, automotive)
On the basis of Region, the market is segmented into:
- Asia-Pacific
- Europe
- North America
- Middle East & Africa
- Latin America
The following Customization Options are available for the report:
- Further breakdown of Asia-Pacific & European glass insulation markets
- Company information
- Detailed analysis and profiling of additional market players (up to three)
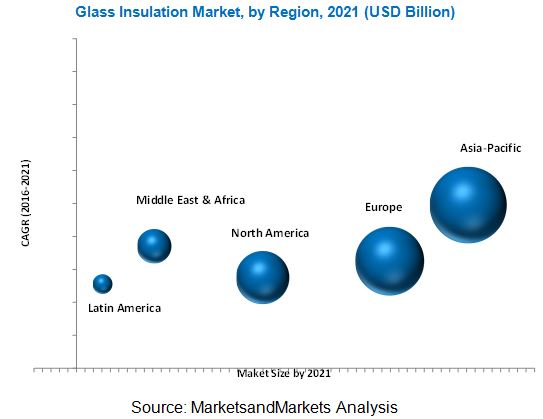
The global glass insulation market was valued at USD 37.94 Billion in 2015 and is projected to reach USD 58.71 Billion by 2021, at a CAGR of 7.6% from 2016. This growth is mainly attributed to growth in the construction industry, rising demand for value-added glass products, increasing demand for green buildings, increasing cost of energy, and stringent government regulations.
Among all types, the insulating glass units segment is the fastest-growing in the market, in terms of value. Value-added products such as low-e glass are increasingly used in insulating glass units to improve insulation. These products offer benefits such as low carbon dioxide emissions and energy savings. Insulating glass units offer other benefits such as sound insulation, safety, reduce damage to furnishings, and provide limited condensation. Governmental regulations in Europe and North America are driving the growth of this segment.
Among all applications, the non-residential construction segment is the fastest-growing in the glass insulation market, in terms of value. Non-residential construction includes construction activities in commercial buildings, offices, hotels, hospitals, educational institutes, stadiums, and airports and so on. Insulation helps these buildings reduce heating & cooling loads and manage indoor climate temperature, reduce noise pollution, and create a more environmentally sustainable building. Growth of this segment has been fueled by changes in building codes for increased energy efficiency.
The Asia-Pacific region held the largest share of the global market in 2015. The rising middle-class population of the region, with high disposable income, and demand for sustainable construction are contributing to the growth of the market. The growth of the Asia-Pacific market is also attributed to the availability of key raw materials, such as glass wool. The glass insulation market in the Asia-Pacific region is also driven by energy efficiency policies implemented by the governments of countries such as China, Japan, and India.
Factors inhibiting the growth of the global market include regulations related to carbon dioxide emissions, lack of awareness about insulation products, and difficulty in recycling glass wool. Owens Corning (U.S.), Nippon Sheet Glass Co. Ltd. (Japan), Johns Manville (U.S.), Knauf Insulation (U.S.), PPG Industries, Inc. (U.S.), Certain Teed Corporation (U.S.), Pittsburgh Corning Corporation (U.S.), Arabian Fiberglass Insulation Co., Ltd. (Saudi Arabia), Saint-Gobain ISOVER (U.S.), and Glassolutions Saint-Gobain (U.K.) are the key players operating in the glass insulation market.
To speak to our analyst for a discussion on the above findings, click Speak to Analyst
 Exclusive indicates content/data unique to MarketsandMarkets and not available with any competitors.
Table of Contents
1 Introduction (Page No. - 15)
1.1 Objectives of the Study
1.2 Market Definition
1.3 Scope of the Study
1.3.1 Markets Covered
1.3.2 Years Considered for the Study
1.4 Currency
1.5 Package Size
1.6 Stakeholders
2 Research Methodology (Page No. - 18)
2.1 Research Data
2.1.1 Key Data From Secondary Sources
2.1.2 Key Data From Primary Sources
2.1.2.1 Key Industry Insights
2.1.2.2 Breakdown of Primary Interviews
2.2 Market Size Estimation
2.3 Market Breakdown and Data Triangulation
2.4 Research Assumptions and Limitations
2.4.1 Assumptions
2.4.2 Limitations
3 Executive Summary (Page No. - 26)
3.1 Introduction
3.2 Future Outlook
3.3 Conclusion
4 Premium Insights (Page No. - 30)
4.1 Attractive Opportunities in the Glass Insulation Market
4.2 Glass Insulation Market, By Region
4.3 Glass Insulation Market in Asia-Pacific
4.4 Glass Insulation Market Share, By Region
4.5 Glass Insulation Market: By Application
4.6 Glass Insulation Market, By Country
4.7 Life Cycle Analysis, By Region
5 Market Overview (Page No. - 37)
5.1 Introduction
5.2 Market Segmentation
5.2.1 By Type
5.2.2 By Application
5.3 Market Dynamics
5.3.1 Drivers
5.3.1.1 Growth in the Construction Industry
5.3.1.2 Rising Demand for Value-Added Glass Products
5.3.2 Restraints
5.3.2.1 Regulations Related to Carbon Dioxide Emissions
5.3.2.2 Lack of Awareness About Insulation Products
5.3.3 Opportunities
5.3.3.1 Demand for Green Buildings
5.3.3.2 Increasing Energy Costs
5.3.3.3 Stringent Government Regulations
5.3.4 Challenges
5.3.4.1 Use of Energy-Efficient Manufacturing Techniques
5.3.4.2 Difficulty in Recycling Glass Wool
5.4 Revenue Pocket Matrix
5.4.1 Revenue Pocket Matrix for the Market, By Type
5.4.2 Revenue Pocket Matrix for the Market, By Application
6 Industry Trends (Page No. - 43)
6.1 Introduction
6.2 Value Chain Analysis of Glass Insulation
6.3 Porter�s Five Forces Analysis
7 Glass Insulation Market, By Type (Page No. - 46)
7.1 Introduction
7.2 Insulating Glass Units
7.3 Glass Wool
7.4 Cellular Glass
8 Glass Insulation Market, By Application (Page No. - 54)
8.1 Introduction
8.2 Non-Residential Construction
8.3 Residential Construction
8.4 Industrial Applications
8.5 HVAC
8.6 Others
9 Global Glass Insulation Market, By Region (Page No. - 62)
9.1 Introduction
9.2 Asia-Pacific
9.2.1 China
9.2.2 Japan
9.2.3 India
9.2.4 South Korea
9.2.5 Malaysia
9.2.6 Indonesia
9.2.7 Australia
9.2.8 Rest of Asia-Pacific
9.3 Europe
9.3.1 Germany
9.3.2 France
9.3.3 U.K.
9.3.4 Italy
9.3.5 Russia
9.3.6 Poland
9.3.7 Rest of Europe
9.4 North America
9.4.1 U.S.
9.4.2 Canada
9.4.3 Mexico
9.5 Middle East & Africa
9.5.1 Saudi Arabia
9.5.2 UAE
9.5.3 Egypt
9.5.4 Rest of Middle East & Africa
9.6 Latin America
9.6.1 Brazil
9.6.2 Argentina
9.6.3 Columbia
9.6.4 Rest of Latin America
10 Competitive Landscape (Page No. - 113)
10.1 Introduction
10.2 New Product Launches: the Most Popular Growth Strategy
10.3 Competitive Situations & Trends
10.3.1 New Product Developments/New Product Launches
10.3.2 Expansions
10.3.3 Mergers & Acquisitions
10.3.4 Partnerships/Collaborations
10.3.5 Joint Venture
11 Company Profiles (Page No. - 119)
(Overview, Financial*, Products & Services, Strategy, and Developments)
11.1 Owens Corning
11.2 Nippon Sheet Glass Co. Ltd.
11.3 Johns Manville
11.4 Knauf Insulation
11.5 PPG Industries, Inc.
11.6 Certain Teed Corporation
11.7 Pittsburgh Corning Corporation
11.8 Arabian Fiberglass Insulation Co., Ltd. (AFICO)
11.9 Saint-Gobain ISOver
11.10 Glassolutions Saint-Gobain
*Details Might Not Be Captured in Case of Unlisted Companies
12 Appendix (Page No. - 142)
12.1 Insights From Industrial Experts
12.2 Discussion Guide
12.3 Introducing RT : Real Time Market Intelligence
12.4 Knowledge Store: Marketsandmarkets� Subscription Portal
12.5 Available Customizations
12.6 Related Reports
List of Tables (101 Tables)
Table 1 Glass Insulation Market Size, By Type, 2014�2021 (USD Million)
Table 2 Insulating Glass Units Insulation Market Size, By Region, 2014�2021 (USD Million)
Table 3 Insulating Glass Units Insulation Market Size, By Region, 2014�2021 (Million Square Meters)
Table 4 Glass Wool Insulation Market Size, By Region, 2014�2021 (USD Million)
Table 5 Glass Wool Insulation Market Size, By Region, 2014�2021 (Kilotons)
Table 6 Cellular Glass Market Size, By Region, 2014�2021 (USD Million)
Table 7 Cellular Glass Insulation Market Size, By Region, 2014�2021 (Kilotons)
Table 8 Glass Insulation Market, By Application, 2014�2021 (USD Million)
Table 9 Glass Insulation Market Size in Non-Residential Construction, By Region, 2014�2021 (USD Million)
Table 10 Market Size in Residential Construction, By Region, 2014�2021 (USD Million)
Table 11 Market in Industrial Applications, By Region, 2014�2021 (USD Million)
Table 12 Market Size in HVAC Application, By Region, 2014�2021 (USD Million)
Table 13 Market in Other Applications, By Region, 2014�2021 (USD Million)
Table 14 Market Size, By Region, 2014�2021 (USD Million)
Table 15 Asia-Pacific: Glass Insulation Market Size, By Country, 2014�2021 (USD Million)
Table 16 Asia-Pacific: Market Size, By Type, 2014�2021 (USD Million)
Table 17 Asia-Pacific: Market Size, By Application, 2014�2021 (USD Million)
Table 18 Asia-Pacific: Insulating Glass Units Market Size, By Application, 2014�2021 (USD Million)
Table 19 Asia-Pacific: Glass Wool Market Size, By Application, 2014�2021 (USD Million)
Table 20 Asia-Pacific: Cellular Glass Market Size, By Application, 2014�2021 (USD Million)
Table 21 China: Market Size, By Type, 2014�2021 (USD Million)
Table 22 China: Market Size, By Application, 2014�2021 (USD Million)
Table 23 Japan: Market Size, By Type, 2014�2021 (USD Million)
Table 24 Japan: Market Size, By Application, 2014�2021 (USD Million)
Table 25 India: Market Size, By Type, 2014�2021 (USD Million)
Table 26 India: Glass Insulation Market Size, By Application, 2014�2021 (USD Million)
Table 27 South Korea: Market Size, By Type, 2014�2021 (USD Million)
Table 28 South Korea: Market Size, By Application, 2014�2021 (USD Million)
Table 29 Malaysia: Glass Insulation Market Size, By Type, 2014�2021 (USD Million)
Table 30 Malaysia: Market Size, By Application, 2014�2021 (USD Million)
Table 31 Indonesia: Market Size, By Type, 2014�2021 (USD Million)
Table 32 Indonesia: Market Size, By Application, 2014�2021 (USD Million)
Table 33 Australia: Market Size, By Type, 2014�2021 (USD Million)
Table 34 Australia: Market Size, By Application, 2014�2021 (USD Million)
Table 35 Rest of Asia-Pacific: Market Size, By Type, 2014�2021 (USD Million)
Table 36 Rest of Asia-Pacific: Market Size, By Application, 2014�2021 (USD Million)
Table 37 Europe: Glass Insulation Market Size, By Country, 2014�2021 (USD Million)
Table 38 Europe: Market Size, By Type, 2014�2021 (USD Million)
Table 39 Europe: Market Size, By Application, 2014�2021 (USD Million)
Table 40 Europe: Insulating Glass Units Market Size, By Application, 2014�2021 (USD Million)
Table 41 Europe: Glass Wool Market Size, By Application, 2014�2021 (USD Million)
Table 42 Europe: Cellular Glass Market Size, By Application, 2014�2021 (USD Million)
Table 43 Germany: Market Size, By Type, 2014�2021 (USD Million)
Table 44 Germany: Market Size, By Application, 2014�2021 (USD Million)
Table 45 France: Glass Insulation Market Size, By Type, 2014�2021 (USD Million)
Table 46 France: Market Size, By Application, 2014�2021 (USD Million)
Table 47 U.K.: Glass Insulation Market Size, By Type, 2014�2021 (USD Million)
Table 48 U.K.: Market Size, By Application, 2014�2021 (USD Million)
Table 49 Italy: Market Size, By Type, 2014�2021 (USD Million)
Table 50 Italy: Market Size, By Application, 2014�2021 (USD Million)
Table 51 Russia: Market Size, By Type, 2014�2021 (USD Million)
Table 52 Russia: Glass Insulation Market Size, By Application, 2014�2021 (USD Million)
Table 53 Poland: Market, By Type, 2014�2021 (USD Million)
Table 54 Poland: Market Size, By Application, 2014�2021 (USD Million)
Table 55 Rest of Europe: Glass Insulation Market Size, By Type, 2014�2021 (USD Million)
Table 56 Rest of Europe: Market Size, By Application, 2014�2021 (USD Million)
Table 57 North America: Market, By Country, 2014�2021 (USD Million)
Table 58 North America: Glass Insulation Market, By Type, 2014�2021 (USD Million)
Table 59 North America: Market, By Application, 2014�2021 (USD Million)
Table 60 North America: Insulating Glass Units Market, By Application, 2014�2021 (USD Million)
Table 61 North America: Glass Wool Market, By Application, 2014�2021 (USD Million)
Table 62 North America: Cellular Glass Market, By Application, 2014�2021 (USD Million)
Table 63 U.S.: Market, By Type, 2014�2021 (USD Million)
Table 64 U.S.: Market, By Application, 2014�2021 (USD Million)
Table 65 Canada: Glass Insulation Market, By Type, 2014�2021 (USD Million)
Table 66 Canada: Market, By Application, 2014�2021 (USD Million)
Table 67 Mexico: Market, By Type, 2014�2021 (USD Million)
Table 68 Mexico: Market, By Application, 2014�2021 (USD Million)
Table 69 Middle East & Africa: Glass Insulation Market, By Country, 2014�2021 (USD Million)
Table 70 Middle East & Africa: Market, By Type, 2014�2021 (USD Million)
Table 71 Middle East & Africa: Glass Insulation Market, By Application, 2014�2021 (USD Million)
Table 72 Middle East & Africa: Insulating Glass Units Market, By Application, 2014�2021 (USD Million)
Table 73 Middle East & Africa: Glass Wool Market, By Application, 2014�2021 (USD Million)
Table 74 Middle East & Africa: Cellular Glass Market, By Application, 2014�2021 (USD Million)
Table 75 Saudi Arabia: Market, By Type, 2014�2021 (USD Million)
Table 76 Saudi Arabia: Market, By Application, 2014�2021 (USD Million)
Table 77 UAE: Market, By Type, 2014�2021 (USD Million)
Table 78 UAE: Glass Insulation Market, By Application, 2014�2021 (USD Million)
Table 79 Egypt: Market, By Type, 2014�2021 (USD Million)
Table 80 Egypt: Market, By Application, 2014�2021 (USD Million)
Table 81 Rest of Middle East & Africa: Glass Insulation Market, By Type, 2014�2021 (USD Million)
Table 82 Rest of Middle East & Africa: Market, By Application, 2014�2021 (USD Million)
Table 83 Latin America Market, By Country, 2014�2021 (USD Million)
Table 84 Latin America: Market, By Type, 2014�2021 (USD Million)
Table 85 Latin America: Glass Insulation Market, By Application, 2014�2021 (USD Million)
Table 86 Latin America: Insulating Glass Units Market, By Application, 2014�2021 (USD Million)
Table 87 Latin America: Glass Wool Market, By Application, 2014�2021 (USD Million)
Table 88 Latin America: Cellular Glass Market, By Application, 2014�2021 (USD Million)
Table 89 Brazil: Market, By Type, 2014�2021 (USD Million)
Table 90 Brazil: Glass Insulation Market, By Application, 2014�2021 (USD Million)
Table 91 Argentina: Market, By Type, 2014�2021 (USD Million)
Table 92 Argentina: Market, By Application, 2014�2021 (USD Million)
Table 93 Columbia: Market, By Type, 2014�2021 (USD Million)
Table 94 Columbia: Market, By Application, 2014�2021 (USD Million)
Table 95 Rest of Latin America Glass Insulation Market, By Type, 2014�2021 (USD Million)
Table 96 Rest of Latin America: Market, By Application, 2014�2021 (USD Million)
Table 97 New Product Developments/New Product Launches, 2011�2016
Table 98 Expansions, 2012�2015
Table 99 Mergers & Acquisitions, 2013�2014
Table 100 Collaboration, 2016
Table 101 Joint Venture, 2013
List of Figures (49 Figures)
Figure 1 Glass Insulation Market: Research Design
Figure 2 Bottom-Up Approach
Figure 3 Top-Down Approach
Figure 4 Data Triangulation
Figure 5 The Asia-Pacific Region Accounted for the Largest Share in the Glass Insulation Market in 2015
Figure 6 Insulating Glass Units Segment is Expected to Dominate the Market During the Forecast Period
Figure 7 Non-Residential Construction Segment is Expected to Dominate the Market During the Forecast Period
Figure 8 Asia-Pacific is Projected to Dominate the Market By 2021
Figure 9 Glass Insulation Market to Register High Growth Between 2016 and 2021
Figure 10 Asia-Pacific to Grow at the Highest CAGR During the Forecast Period
Figure 11 Non-Residential Construction Accounts for the Largest Share in the Asia-Pacific Glass Insulation Market
Figure 12 Asia-Pacific is Estimated to Account for the Largest Share in the Glass Insulation Market in 2014-2021
Figure 13 Non-Residential Construction Was the Leading Application in the Asia-Pacific Region (2015)
Figure 14 China to Lead the Glass Insulation Market, By Country, 2016-2021
Figure 15 Asia-Pacific to Register the Fastest Growth in the Global Market
Figure 16 Drivers, Restraints, Opportunities, and Challenges in the Market
Figure 17 Revenue Pocket Matrix: Type
Figure 18 Revenue Pocket Matrix: Application
Figure 19 Insulating Glass Units (IGUs): Value Chain Analysis
Figure 20 Glass Wool: Value Chain Analysis
Figure 21 Cellular Glass: Value Chain Analysis
Figure 22 Insulating Glass Units are Expected to Dominate the Glass Insulation Market During the Forecast Period
Figure 23 Asia-Pacific to Remain the Market Leader in the Insulating Glass Units Insulation Market By 2021
Figure 24 Asia-Pacific to Register the Fastest Growth in the Glass Wool Market During the Forecast Period
Figure 25 Europe to Remain the Market Leader in the Cellular Glass Market By 2021
Figure 26 Global Glass Insulation Market, By Application, 2016 & 2021 (USD MN)
Figure 27 Asia-Pacific is Expected to Lead the Market in Non-Residential Construction
Figure 28 Europe to Lead the Market in Residential Construction During the Forecast Period
Figure 29 Asia-Pacific to Remain the Market Leader in the Glass Insulation Market for Industrial Applications
Figure 30 HVAC Application Segment in the Asia-Pacific Region to Grow at the Highest CAGR in the Glass Insulation Market
Figure 31 Asia-Pacific to Lead the Other Applications Segment in the Market During the Forecast Period
Figure 32 Global Glass Insulation Market Regional Snapshot, 2015
Figure 33 Asia-Pacific Market Snapshot: China to Drive the Glass Insulation in the Region
Figure 34 European Market Snapshot: Germany to Continue to Dominate the Market
Figure 35 North American Market Snapshot: the Region is A Mature Market for Glass Insulation
Figure 36 Middle Eastern & African Market Snapshot: the Region is A Growing Market for Glass Insulation
Figure 37 Latin American Market Snapshot: Brazil is Projected to Lead the Glass Insulation Market Through 2021
Figure 38 Companies Primarily Adopted Organic Growth Strategies (2011�2016)
Figure 39 New Product Launches Was the Most Popular Strategy Adopted Between 2011 and 2016
Figure 40 Owens Corning: Company Snapshot
Figure 41 Owens Corning: SWOT Analysis
Figure 42 Nippon Sheet Glass Co. Ltd.: Company Snapshot
Figure 43 Nippon Sheet Glass Co., Ltd.: SWOT Analysis
Figure 44 Johns Manville.: SWOT Analysis
Figure 45 Knauf Insulation: SWOT Analysis
Figure 46 PPG Industries, Inc.: Company Snapshot
Figure 47 Certain Teed Corporation: Company Snapshot
Figure 48 Saint-Gobain is over Company Snapshot
Figure 49 Glassolutions Saint-Gobain: Company Snapshot


Growth opportunities and latent adjacency in Glass Insulation Market