Nanoelectromechanical Systems (NEMS) Market (2012 - 2022) by Applications (STM/AFM, Medical, Gas/Flow Sensor, RF), Products (Switches, Cantilevers), Components (Nanotubes, Nanowires, Nanofilms), Materials (Graphene, ZnO, SiC, GaN, SiO2)


NEMS, i.e. "Nanoelectromechanical Systems", are used for the devices integrating mechanical and electrical functionality on the nanoscale. NEMS is the advanced level of miniaturization after MEMS devices. NEMS includes various devices like sensors, actuators, gears, accelerometers, cantilevers, tweezers, and many other nano devices. Different properties of the NEMS-based devices, which makes them unique are low mass, high electrical strength, high mechanical resonance frequencies, potentially large quantum mechanical effects such as zero point motion and a high surface-to-volume ratio useful for surface-based sensing mechanisms.
This report deals with all the driving factors, restraints, and opportunities with respect to the NEMS market, which are helpful in identifying trends and key success factors for the industry. The report also profiles companies active in the field of NEMS market. This report provides the competitive landscape of the players, which covers key growth strategies, followed by all the major players. The players are related to research organizations that play a major role in this industry, nano-component suppliers, nano-material suppliers, and Original Equipment Manufacturers (OEMs). The report formulates the entire value chain of the market; right from data source to the applications of the NEMS.
Apart from the market segmentation, the report also includes critical market data showing the price trend analysis for, and market dynamics such as; drivers, restraints, and opportunities.
The global NEMS market is expected to reach $108.88 million by 2022 at an estimated CAGR of 29.69%. North America leads the NEMS market.
Scope of the Report
The report categorizes the Global Nanoelectromechanical Systems (NEMS) Market, based on the current and future applications and it also covers the forecasted revenue from 2012 to 2022 depending upon the commercialization of the various applications. The report also shows the cost analysis of the NEMS systems, products, components, and the nano-materials. It also shows the various activities that are being conducted by different institutes, universities, and non-profit organizations. The report describes the applications mapping in the NEMS market with respect to the growth potential and adoption by the users. The report also describes the adoption of NEMS-based systems and applications in various regions.
On the basis of applications
The application segmentation for the NEMS market is broadly divided into three groups; tools & equipments, sensing & control, and solid state electronics. Each of the applications is further divided into level two applications such as microscopy, automotive, medical, sensors, and memories. Analysis of all the applications includes estimation of the year of commercialization, penetration rate in the existing market, and value/volume data. The technology-based segmentation includes only qualitative data. The quantitative part has been avoided as technology for NEMS is evolving and hence forecasting for the evolving technology will induce errors.
On the basis of products
The market is also segmented according to various types of products such as nano-tweezers, nano-cantilevers, nano-accelerometers, and nano-fluidic modules. These products are manufactured from various components; all the products are categorized on the basis of different applications in which they are used.
On the basis of components
In the report, the market is also segmented on the basis of various nano-components. Different nano-components are used for the production of different nano-products. Various nano-materials are used for manufacturing nano-components. The nano-components covered in the report are nanotubes, nanowires, nanofilms, and nanobelts.
On the basis of materials
On the whole, 17 raw materials that are largely used for NEMS production are covered in the materials chapter. All the 17 materials are distributed amongst three basic categories; metals, semiconductors, and insulators. Thus, it can be said that the entire market breakdown of the supply side of the NEMS market is done for report.
On the basis of geography
The NEMS market is also mapped against geography. The market by geography is further segmented into North America, Europe, APAC, and ROW, which gives a detailed insight about the potential regions for the NEMS market. The report also describes the concentrated regional pockets that are critical for revenue generation.
NEMS stands for �Nanoelectromechanical Systems�. NEMS extends the miniaturization feature further towards the ultimate limit of individual atoms and molecules. The NEMS-based devices stand on the movement at the nanometer level. NEMS are considered to be the structural elements at or below 100 nm when compared to the microelectromechanical systems that are at micrometer length scale. NEMS is preferred for the high efficient applications like high frequency resonator and ultrasensitive sensors due to the most attractive features of NEMS; i.e. smaller mass, higher electrical efficiency, and higher surface area to volume ratio.
Major Advantages of NEMS Devices
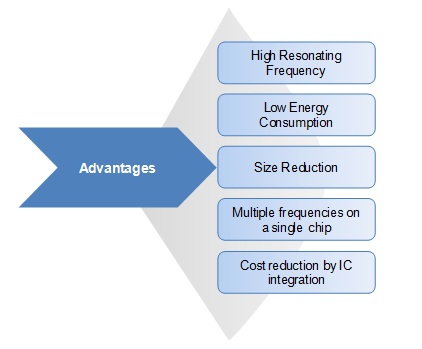
Source: MarketsandMarkets Analysis
It is expected that in the next ten years NEMS will be preferred over MEMS in high frequency applications. The major reason behind this is the high resonating frequency of the NEMS, which is in the range of GHz. Another major advantage of NEMS device is the low power consumption. NEMS devices bring a fundamental breakthrough in the way materials, devices, and systems are designed and manufactured. With the help of various nano fabrication techniques, mechanical elements such as sensors, actuators, and cantilevers are combined with the electronic circuitry to control the miniature device. In the NEMS, the mechanical components are combined with electronic properties at nanoscale to develop devices which are capable of performing tasks that are impossible using conventional technologies.
NEMS applications are still in their infancy; with global research & developments actively under way. The global market for NEMS is forecasted to grow at a CAGR of 29.7% from 2012 to 2022. In the report, the overall NEMS market is segmented into three major application sectors, namely, tools & equipments, sensing & control, and solid state electronics market. The report also includes the segmentation of major NEMS products, components used for manufacturing NEMS-based products, and nanomaterials used for manufacturing nanocomponents.
The overall NEMS report is segmented into five major segments, namely, applications, nano-products, nano-components, nano-materials and fabrication technologies. In the current scenario scanning probe microscopic (SPM) tips is the only commercialized application in the NEMS market. The nano-materials which are covered in the report are categorized into three major types, namely, nano-metals, nano-semiconductors and nano-insulating materials.
This report describes the market trends, drivers, and challenges of NEMS market and forecasts the NEMS market from 2012 to 2022, based on the various NEMS applications. It covers geographies like North America, Europe, APAC, and ROW (Rest of the World).
The companies or organizations included in the report are categorized into four major types, namely, research organizations, component suppliers, raw material suppliers and original equipment manufacturers (OEMs). Some of the major companies which are covered in the report are California Institute Of Technology (U.S.), Cranfield University (U.K.), Fraunhofer-Gesellschaft (Germany), Interuniversity Microelectronics Centre (Belgium), SUN Innovations, Inc (U.S.), Showa Denko K.K. (Japan), Asylum Research Corporation (U.S.) and Bruker Corporation (U.S.).
 Exclusive indicates content/data unique to MarketsandMarkets and not available with any competitors.
Table Of Contents
1 Introduction To Nems
1.1 Key Take-Aways
1.2 Report Description
1.3 Markets Covered
1.4 Nanoelectromechanical Systems Market Stakeholders
1.5 Research Methodology Adopted For Nanoelectromechanical Systems Market
1.5.1 Key Data Points From Secondary Sources
1.5.2 Key Data Points From Primary Sources
1.5.3 Assumptions Made For Nanoelectromechanical Systems Market
1.5.4 List Of Companies And Research Institutes
2 Executive Summary
3 Market Overview
3.1 Market Definition
3.2 Market Segmentation For Nanoelectromechanical Systems
3.3 Researches In The Field Of Nanotechnology
3.4 Industry Lifecycle Of Nanoelectromechanical Systems
3.5 Market Dynamics
3.5.1 Drivers
3.5.1.1 Increasing Demand Of High Precision Microscopes Boosting Overall Market Growth
3.5.1.2 Increasing Corporate & Government Funding For Life Science And Nanotechnology Research
3.5.1.3 Demand Of The Miniature Electronic Components Due To Various Advantages
3.5.1.4 Technology Advancements In Nano-Components And Nano-Materials
3.5.2 Restraints
3.5.2.1 Manufacturing Difficulties And Absence Of Mass Manufacturing Techniques
3.5.2.2 Health Hazards & Environment Concern
3.5.2.3 High Price Factor Of Nanoscale Components
3.5.3 Opportunities
3.5.3.1 Nanotechnology Applications For Consumer Electronics
3.5.3.2 Innovations And Advancements Of The Nano Surgical Instruments
3.6 Nanoelectromechanical Systems Comparison With Mems
3.7 Cost Analysis Of The Nanoelectromechanical Systems Market
3.8 Value Chain Analysis Of Nanoelectromechanical Systems
4 Technology Market
4.1 Introduction To Nems Technology
4.2 Nanoelectromechanical Systems: Fabrication Technologies
4.2.1 Top-Down Approach
4.2.1.1 Electron-Beam Lithography
4.2.1.2 Nano-Manipulation
4.2.1.3 Field Alignment
4.2.2 Bottom-Up Approach
4.2.2.1 Direct Method
4.2.2.2 Self Assembly
4.3 Future/Promising Nanoelectromechanical Systems Technologies
4.3.1 Mechanosynthesis
5 Applications Market
5.1 Introduction To Nanoelectromechanical Systems Applications
5.2 Commercialization Timeline Of Nanoelectromechanical Systems Application
5.3 Tools & Equipment Application Of Nanoelectromechanical Systems
5.3.1 Nems Based Scanning Probe Microscope (Spm)
5.3.1.1 Scanning Tunneling Microscope (Stm)
5.3.1.2 Atomic Force Microscope (Afm)
5.3.1.2.1 Contact Mode
5.3.1.2.2 Non-Contact Mode Afm
5.3.2 Mass Spectrometry
5.4 Sensing & Controls Application Of Nanoelectromechanical Systems
5.4.1 Automotive Application Of Nems
5.4.1.1 Airbags
5.4.1.2 Powertrain
5.4.2 Medical Application Of Nems
5.4.2.1 Diabetes Immunoassays
5.4.2.2 Oncology Immunoassays
5.4.3 Industrial Process Control Application Of Nems
5.4.3.1 Gas & Chemical Sensing
5.4.3.2 Flow Sensing
5.5 Solid State Electronics Application Of Nanoelectromechanical Systems
5.5.1 Random Access Memory Application
5.5.2 Wireless Communication Application
5.5.2.1 Nems-Based Oscillators
5.5.2.2 Rf Nanoelectromechanical Systems
5.6 High Potential Applications Of Nanoelectromechanical Systems
5.6.1 Nanorobotics
5.6.1.1 Bio-Nanorobotics
5.6.1.2 Current State And Major Developments
5.6.1.3 Estimated Time To Market
5.6.2 Nanofactories
6 Product Market
6.1 Introduction To Nanoelectromechanical Systems Products
6.2 Nano-Tweezers
6.3 Nano-Cantilevers
6.4 Nano-Switches
6.5 Nano-Accelerometers
6.6 Nano-Fluidic Modules
7 Component Market
7.1 Introduction To Nanoelectromechanical Systems Components
7.1.1 Physical Properties Of Nano-Components
7.1.2 Components� Market Overview
7.2 Nanotubes For Nanoelectromechanical Systems
7.2.1 Single-Walled Nanotubes
7.2.2 Multi-Walled Nanotubes
7.2.3 Nanocoils
7.2.4 Nanotube Market By Applications
7.2.4.1 Nanotubes For �Tools & Equipment� Application
7.2.4.2 Nanotubes For Sensing & Control Applications
7.2.4.2.1 Nanotubes For Automotive Applications
7.2.4.2.2 Nanotubes For Medical Applications
7.2.4.2.3 Nanotubes For Industrial Process Control Applications
7.2.4.3 Nanotubes For Solid State Electronic Applications
7.2.4.3.1 Nanotubes For Wireless Communication Applications
7.3 Nanowires For Nanoelectromechanical Systems
7.3.1 Nanowire Market By Applications
7.3.1.1 Nanowires For Tools & Equipment Application
7.3.1.2 Nanowires For Sensing & Control Applications
7.3.1.2.1 Nanowires For Automotive Applications
7.3.1.2.2 Nanowires For Medical Applications
7.3.1.2.3 Nanowires For Industrial Process Control Applications
7.3.1.3 Nanowires For Solid State Electronic Applications
7.3.1.3.1 Nanowires For Wireless Communication Applications
7.3.2 Raw Materials Used For Nanowires
7.4 Nanofilms For Nanoelectromechanical Systems
7.4.1 Nanofilms Market By Applications
7.4.1.1 Nanofilms For Tools & Equipment Application
7.4.1.2 Nanofilms For Sensing & Control Applications
7.4.1.2.1 Nanofilms For Automotive Applications
7.4.1.2.2 Nanofilms For Medical Applications
7.4.1.2.3 Nanofilms For Industrial Process Control Applications
7.4.1.3 Nanofilms For Solid State Electronics Applications
7.4.1.3.1 Nanofilms For Wireless Communication Applications
7.5 Nanobelts For Nanoelectromechanical Systems
7.5.1 Nanobelt Market By Applications
7.5.1.1 Nanobelts For Tools & Equipment Application
7.5.1.2 Nanobelts For Sensing & Control Applications
7.5.1.2.1 Nanobelts For Automotive Applications
7.5.1.2.2 Nanobelts For Medical Applications
7.5.1.2.3 Nanobelts For Industrial Process Control Applications
7.5.1.3 Nanobelts For Solid State Electronics Applications
7.5.1.3.1 Nanobelts For Wireless Communication Applications
7.5.2 Raw Materials Used For Nanobelts
8 Materials Market
8.1 Introduction To Nanoelectromechanical Systems Materials
8.2 Nano-Metals For Nanoelectromechanical Systems
8.3 Nano-Semiconductors For Nanoelectromechanical Systems
8.4 Nano-Insulators For Nanoelectromechanical Systems
9 Geographic Analysis
9.1 Introduction To Nanoelectromechanical Systems Market By Regions
9.2 North America
9.3 Europe
9.4 Apac
9.5 Row
10 Competitive Landscape
10.1 Patents Related To Nanoelectromechanical Systems
10.2 Investments Related To Nanoelectromechanical Systems
11 Company Profiles
11.1 Nanoelectromechanical Systems: Research Institutes & Organizations
11.1.1 California Institute Of Technology (Caltech)
11.1.2 Centre Suisse D'electronique Et Microtechnique S.A.
11.1.3 Cranfield University
11.1.4 Defense Advanced Research Projects Agency (Darpa)
11.1.5 Fraunhofer-Gesellschaft
11.1.6 Iit Madras
11.1.7 Institute Of Microengineering And Nanoelectronics (Imen)
11.1.8 Imec (Interuniversity Microelectronics Centre)
11.1.9 Korea Institute Of Science And Technology
11.1.10 Material And Electrochemical Research (Mer) Corporation
11.1.11 Northeastern University: Nems Laboratory
11.2 Nanoelectromechanical Systems: Materials Suppliers
11.2.1 Inframat Advanced Materials Llc
11.2.2 Nanoshell Llc
11.2.3 Sun Innovations, Inc.
11.3 Nanoelectromechanical Systems: Components Suppliers
11.3.1 Cnano Technology Ltd
11.3.2 Nanocyl
11.3.3 Showa Denko K.K.
11.4 Nanoelectromechanical Systems: Original Equipment Manufacturers (Oems)
11.4.1 Agilent Technologies Inc.
11.4.2 Asylum Research Corporation
11.4.4 Bruker Corporation
List Of Tables
Table 1 List Of Companies
Table 2 Comparison Of The Properties Of Nems & Mems
Table 3 Cost Breakdown Of Nanoelectromechanical Systems
Table 4 Nanoelectromechanical Systems Market Revenue By Applications, 2012 � 2022 ($Million)
Table 5 Nanoelectromechanical Systems Shipments, By Applications, 2012 � 2022 (1,000 Units)
Table 6 Nanoelectromechanical Systems-Based Tools & Equipment Market Revenue, 2012 � 2022 ($Million)
Table 7 Nanoelectromechanical Systems-Based Tools & Equipment Market, 2012 � 2022 (1,000 Units)
Table 8 Market Value Of Nanoelectromechanical Systems Used For Spm Applications, 2012 � 2022 ($Million)
Table 9 Shipments Of Nanoelectromechanical Systems Used For Spm Applications, 2012 � 2022 (1,000 Units)
Table 10 Asp Of Nanoelectromechanical Systems Used For Spm Applications, 2012 � 2022 ($)
Table 11 Market Value Of Nanoelectromechanical Systems Used For Spm Applications,By Geography, 2012 � 2022 ($Million)
Table 12 Nems Market Revenue For Stm Applications, 2012 � 2022 ($Million)
Table 13 Cost Break-Down Of Stm, 2012 � 2022 ($)
Table 14 Nems Market Revenue For Stm Application, By Geography, 2012 � 2022 ($Million)
Table 15 Nems Market Revenue For Afm Application, 2012 � 2022 ($Million)
Table 16 Cost Break-Down Of Afm, 2012 � 2022 ($)
Table 17 Nems Market For Afm Application, By Geography, 2012 � 2022 ($Million)
Table 18 Nanoelectromechanical Systems-Based Mass Spectroscopy Market, 2012 � 2022 ($1,000)
Table 19 Nanoelectromechanical Systems Based Mass Spectroscopy Market, 2012 � 2022 (Units)
Table 20 Nanoelectromechanical Systems Market Revenue For Sensing & Control Applications, 2015 � 2022 ($Million)
Table 21 Nems Shipments For Sensing And Control Applications, 2015 � 2022 (1,000 Units)
Table 22 Nanoelectromechanical Systems Market Revenue For Automotive Applications, 2016 � 2022 ($Million)
Table 23 Nems Shipments For Automotive Applications, 2016 � 2022 (1,000 Units)
Table 24 Nems Market For Automotive Applications, By Geography, 2016 � 2022 ($Million)
Table 25 Market For Airbag Application, 2016 � 2022 ($Million)
Table 26 Nems Market Revenue For Airbag Application, By Geography, 2016 � 2022 ($1,000)
Table 27 Market For Powertrain Application, 2016 � 2022 ($Million)
Table 28 Nems Market For Powertrain Application, By Geography, 2016 � 2022 ($1,000)
Table 29 Nanoelectromechanical Systems Market Revenue For Medical Immunoassay, 2017 � 2022 ($Million)
Table 30 Nems Shipments For Medical Immunoassay, 2017 � 2022 (1,000 Units)
Table 31 Nems Market For Medical Immunoassay, By Geography, 2017 � 2022 ($1,000)
Table 32 Global Split Of Diabetic Population, 2010 � 2022
Table 33 Nems-Based Diabetes Immunoassays Market, 2017 � 2022 ($Million)
Table 34 Nems-Based Diabetes Immunoassays Market, By Geography, 2017 � 2022 ($1,000)
Table 35 Global Split Of Cancer Population, 2010 � 2022
Table 36 Nanoelectromechanical Systems-Based Oncology Immunoassays Market, 2017 � 2022 ($Million)
Table 37 Nems Based Oncology Immunoassays Market, By Geography, 2017 � 2022 ($1,000)
Table 38 Nanoelectromechanical Systems Market For Industrial Process Control, 2014 � 2022 ($Million)
Table 39 Nems Shipments For Industrial Process Control, 2014 � 2022 (1,000 Units)
Table 40 Nanoelectromechanical Systems Market For Industrial Process Control, By Geography, 2014 � 2022 ($1,000)
Table 41 Nanoelectromechanical Systems-Based Gas & Chemical Sensing Application Market Revenue, 2014 � 2022 ($Million)
Table 42 Nems-Based Gas & Chemical Sensing Application Market, By Geography, 2014 � 2022 ($1,000)
Table 43 Nems-Based Flow Sensing Application Market Revenue, 2014 � 2022 ($Million)
Table 44 Nems-Based Flow Sensing Application Market Revenue, By Geography, 2014 � 2022 ($1,000)
Table 45 Nanoelectromechanical Systems Market For Solid State Electronic Devices, 2014 � 2022 ($Million)
Table 46 Nems Shipments For Solid State Electronic Devices, 2014 � 2022 (1,000 Units)
Table 47 Nanoelectromechanical Systems Based Market For Memory Applications, 2014 � 2022
Table 48 Nems-Based Market For Memory Applications, By Geography, 2014 � 2022 ($1,000)
Table 49 Nems Market For Wireless Applications, 2014 � 2022 ($Million)
Table 50 Nems Shipment For Wireless Applications, 2014 � 2022 (1,000 Units)
Table 51 Nanoelectromechanical Systems Market For Wireless Applications, By Geography, 2014 � 2022 ($1,000)
Table 52 Market For Oscillator Application, 2014 � 2022 ($Million)
Table 53 Nems Market For Oscillator Application, By Geography, 2014 � 2022 ($1,000)
Table 54 Nems Market For Rf Application, 2014 � 2022 ($Million)
Table 55 Nems Market For Rf Application, By Geography, 2014 � 2022 ($Million)
Table 56 Nanoelectromechanical Systems-Based Products Market Revenue, 2012 � 2022 ($Million)
Table 57 Nems-Based Products Market Shipments, 2012 � 2022 (1,000 Units)
Table 58 Nems Based Nano-Tweezers Market, 2012 � 2022
Table 59 Nems-Based Nano-Cantilevers Market, 2012 � 2022
Table 60 Nems-Based Nan0-Switches Market, 2012 � 2022
Table 61 Nems-Based Nano-Accelerometers Market, 2012 � 2022
Table 62 Nems Based Nano-Fluidics Market, 2012 � 2022
Table 63 Physical Parameters Of Nano-Components
Table 64 Volume Market Of Nanoelectromechanical Systems Components, 2012 � 2022 (Nanograms)
Table 65 Average Selling Price (Asp) Of The Components, 2012 � 2022 ($/Gram)
Table 66 Market Value Of The Components Used For Nanoelectromechanical Systems, 2012 � 2022 (Cents/1000)
Table 67 Nems Based Nanotubes Market, 2012 � 2022
Table 68 Cost Of Different Types Of Nanotubes, 2012 � 2022 ($/Gram)
Table 69 Nanotubes Shipments For Tools & Equipment Applications, 2012 � 2022 (Nanograms)
Table 70 Nanotubes Shipments For Sensing & Control Applications, 2015 � 2022 (Nanograms)
Table 71 Nanotubes Shipments For Automotive Applications, 2017 � 2022 (Nanograms)
Table 72 Nanotubes Shipments For Medical Immunoassays Applications, 2017 � 2022 (Nanograms)
Table 73 Nanotubes Shipments For Industrial Process Control Applications, 2015 � 2022 (Nanograms)
Table 74 Nanotubes Shipments For Solid State Electronics Applications, 2015 � 2022 (Nanograms)
Table 75 Nanotubes Shipments For Wireless Communication Applications, 2015 � 2022 (Nanograms)
Table 76 Global Nems Market: Weight Of Raw Materials For The Nanotubes, 2012 � 2022 (Nanograms)
Table 77 Nems Based Nanowires Market, 2012 � 2022
Table 78 Nanowires Shipments For Tools & Equipment Applications, 2012 � 2022 (Nanograms)
Table 79 Nanowires Shipments For Sensing & Control Applications, 2015 � 2022 (Nanograms)
Table 80 Nanowires Shipments For Automotive Applications, 2017 � 2022 (Nanograms)
Table 81 Nanowires Shipments For Medical Immunoassays Applications, 2012 � 2022 (Nanograms)
Table 82 Nanowires Shipmetns For Industrial Process Control Applications, 2015 � 2022 (Nanograms)
Table 83 Nanowires Shipments For Solid State Electronics Applications, 2015 � 2022 (Nanograms)
Table 84 Nanowires Shipments For Wireless Communication Applications ,2015 � 2022 (Nanograms)
Table 85 Raw Materials Market For Nanowires, 2012 � 2022 (Nanograms)
Table 86 Nems Based Nanofilms Market , 2012 � 2022
Table 87 Nanofilms Shipments For Tools & Equipment Applications, 2015 � 2022 (Nanograms)
Table 88 Nanofilms Shipments For Sensing & Control Applications, 2015 � 2022 (Nanograms)
Table 89 Nanofilms Shipments For Automotive Applications, 2017 � 2022 (Nanograms)
Table 90 Nanofilms Shipments For Medical Immunoassays Applications, 2017 � 2022 (Nanograms)
Table 91 Nanofilms Shipments For Industrial Process Control Applications, 2015 � 2022 (Nanograms)
Table 92 Nanofilms For Solid State Electronics Applications, 2015 � 2022 (Nanograms)
Table 93 Nanofilms Shipments For Wireless Communication Applications, 2015 � 2022 (Nanograms)
Table 94 Nems Based Nanobelts Market, 2012 � 2022
Table 95 Nanobelts Shipments For Tools & Equipment Applications, 2012 � 2022 (Nanograms)
Table 96 Nanobelts Shipments For Sensing & Control Application, 2015 � 2022 (Nanograms)
Table 97 Nanobelts Shipments For Automotive Applications, 2017 � 2022 (Nanograms)
Table 98 Nanobelts Shipmetns For Medical Immunoassays Applications, 2017 � 2022 (Nanograms)
Table 99 Nanobelts Shipments For Industrial Process Control Applications,2015 � 2022 (Nanograms)
Table 100 Nanobelts Shipemtns For Solid State Electronics Applications, 2015 � 2022 (Nanograms)
Table 101 Nanobelts Shipmetns For Wireless Communication Applications, 2015 � 2022 (Nanograms)
Table 102 Raw Materials Used For Nanobelts, 2012 � 2022 (Nanograms)
Table 103 Materials Shipments For Nanoelectromechanical Systems Products, 2012 � 2022 (Nanograms)
Table 104 Materials Weighted Average Selling Price, 2012 � 2022 ($/Gram)
Table 105 Nano-Metals Shipments For Nems Products, 2012 � 2022 (Nanograms)
Table 106 Nano-Metals Average Selling Price, 2012 � 2022 ($/Gram)
Table 107 Nano-Semiconductors Shipments For Nems Products, 2012 � 2022 (Nanograms)
Table 108 Nano-Semiconductors Average Selling Price, 2012 � 2022 ($/Gram)
Table 109 Nano-Insulators Shipments For Nems Products, 2012 � 2022 (Nanograms)
Table 110 Nano-Insulators Average Selling Price, 2012 � 2022 ($/Gram)
Table 111 Global Nanoelectromechanical Systems Market, By Geography, 2012 � 2022 ($Million)
Table 112 North America: Global Nanoelectromechanical Systems Market, 2012 � 2022 ($Million)
Table 113 North America: Global Nems Market By Sensing & Control Application, 2012 � 2022 ($Million)
Table 114 North America: Global Nems Market By Solid State Semiconductor Application, 2012 � 2022 ($Million)
Table 115 Europe: Global Nanoelectromechanical Systems Market, 2012 � 2022 ($Million)
Table 116 Europe: Global Nems Market By Sensing & Control Application, 2012 � 2022 ($Million)
Table 117 Europe: Global Nems Market By Solid State Semiconductor Application, 2012 � 2022 ($Million)
Table 118 Apac: Global Nanoelectromechanical Systems Market, 2012 � 2022 ($Million)
Table 119 Apac: Global Nems Market By Sensing & Control Application, 2012 � 2022 ($Million)
Table 120 Apac: Global Nems Market By Solid State Semiconductor Application, 2012 � 2022 ($Million)
Table 121 Row: Global Nanoelectromechanical Systems Market, 2012 � 2022 ($Million)
Table 122 Row: Global Nems Market By Sensing & Control Application, 2012 � 2022 ($Million)
Table 123 Row: Global Nems Market By Solid State Semiconductor Application, 2012 � 2022 ($Million)
Table 124 U.S. Patents For Global Nanocomponents, Products & Materials Industry
Table 125 Europe Patents For Global Nanocomponents, Products & Materials Industry
Table 126 Japan Patents For Global Nanocomponents, Products & Materials Industry
Table 127 Global Nano Components, Products & Materials Market: Public Investments
Table 128 Nanotube Product Portfolio Of Showa Denko, 2012
Table 129 Showa Denko K.K.: Revenue & Market Share, 2009 � 2011 ($Million)
Table 130 Showa Denko K.K.: Market Revenue By Segments, 2009 � 2011 ($Million)
Table 131 Showa Denko K.K.: Market Revenue By Geography, 2009 � 2011 ($Million)
Table 132 Agilent Technologies: Overall Revenue & Net Income, 2010 � 2011($Million)
Table 133 Agilent Technologies: Overall Revenue, By Business Segments, 2010 � 2011 ($Million)
Table 134 Agilent Technologies: Overall Revenue, By Geography, 2010 � 2011 ($Million)
Table 135 Bruker Corporation: Market Revenue, 2010 � 2011 ($Million)
Table 136 Bruker Corporation: Market Revenue, By Components, 2010 � 2011 ($Million)
Table 137 Bruker Corporation: Market Revenue, By Geography, 2010 � 2011 ($Million)
List Of Figures
Figure 1 Research Methodology For Existing Applications Of Nanoelectromechanical Systems
Figure 2 Determining The Commercialization Year Of Nanoelectromechanical Systems Application
Figure 3 Penetration Of Nems In To Mems Based Market
Figure 4 Major Advantages Of Nems Devices
Figure 5 Global Nanoelectromechanical Systems Market, By Applications, 2012 � 2022 ($Million)
Figure 6 Ongoing And Upcoming Researches In The Field Of Nanotechnology
Figure 7 Life Cycle Of The Nems Overall Market
Figure 8 Impact Analysis Of The Drivers
Figure 9 Impact Analysis Of The Restraints
Figure 10 Variation In The Price And Volume In The Nems Overall Market
Figure 11 Value Chain Of The Nanoelectromechanical Systems Market
Figure 12 Fabrication Technologies
Figure 13 Nems Applications: Time To The Market
Figure 14 Segmentation Of Nems Based Tools & Equipment Market
Figure 15 Percent Break-Up Of Spm Types (%)
Figure 16 Operating Modes Of Scanning Tunneling Microscope
Figure 17 Block Diagram Of Scanning Tunneling Microscope
Figure 18 Operating Modes For Atomic Force Microscope
Figure 19 Contact Scanning Mode Of Afm
Figure 20 Non-Contact Scanning Mode Of Afm
Figure 21 Nanoelectromechanical Systems-Based Mass Spectroscope
Figure 22 Nems Based Automotive Application
Figure 23 Nems Percent Split Of Automotive Application, By Sub-Types, 2017 � 2022
Figure 24 Working Structure Of The Sensors In Airbag
Figure 25 Penetration Rate Of Nems Airbags, By Geography, 2017 � 2022 (%)
Figure 26 Penetration Rate Of Nems Powertrain Application, By Geography 2017 � 2022 (%)
Figure 27 Segmentation Of Medical Application Of Nanoelectromechanical Systems
Figure 28 Nems: Percent Split By Sub-Types, 2017 � 2022
Figure 29 Adoption Of Nems Based Diabetes Immunoassay Devices, 2022
Figure 30 Adoption Of Nems-Based Oncology Immunoassay Devices, 2022
Figure 31 Segmentation Of Nems Industrial Process Control Application, By Sub-Types
Figure 32 Nems Percent Split Of Industrial Process Control Application By Sub-Types, 2014 � 2022
Figure 33 Gas & Chemical Sensing Using Nanoelectromechanical Systems
Figure 34 Nems Percent Split Of Wireless Applications, By Sub-Types, 2014 � 2022
Figure 35 Time Frame Of The Nanorobotics To Be Commercialized
Figure 36 Segmentation Of Nanoelectromechanical Systems Based Products
Figure 37 Components Used For Building Nems
Figure 38 Component Composition In Nanoelectromechanical Systems, 2012 � 2022 (%)
Figure 39 Segmentation Of The Nanotubes By Types, 2012 � 2022
Figure 40 Nanoelectromechanical Systems Market, By Geography
Figure 41 Region-Wise Analysis Of Nems Market
Figure 42 Total Patents Related To Nanoelectromechanical Systems Market, By Geography, 2000 � 2010
Figure 43 Global Nano Components, Products & Materials Industry: Public Investments, By Geography
Figure 44 Global Nems Components, Products And Materials Market: Venture Funding (2009)
Figure 45 Imen: Major Research Projects
Figure 46 Imec: Major Research Fields
Figure 47 Product Segments Of Inframat Advanced Materials Llc
Figure 48 The Company's Key Products
Figure 49 Subsidiaries Of Showa Denko, 2012
Figure 50 Major Atomic Force Microscopes Of Agilent Technologies Inc.


Growth opportunities and latent adjacency in Nanoelectromechanical Systems (NEMS) Market