
Hardware in the Loop Market Size, Share, Trends and Growth

Hardware in the Loop Market by Offering (Hardware, Software and Consulting and System Design, System Integration, Maintenance and Support)), Type (Open Loop, Closed Loop), Vertical and Region - Global Forecast to 2030


OVERVIEW
Source: Secondary Research, Interviews with Experts, MarketsandMarkets Analysis
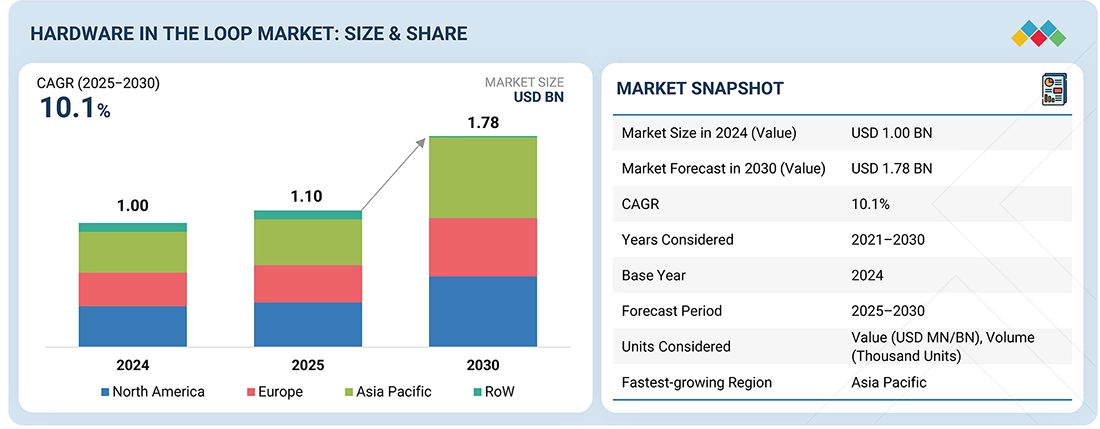
The hardware in the loop market is projected to grow from USD 1,001.7 million in 2024 to USD 1,784.4 million by 2030, at a CAGR of 10.1%. The hardware in the loop (HIL) market is undergoing rapid development primarily due to the increased need for advanced testing in applications such as electric vehicles, autonomous systems, aerospace, and industrial automation.
KEY TAKEAWAYS
-
BY TYPEThe market for the closed loop segment is projected to register a higher CAGR during the forecast period. Protective relays, controllers, and other hardware equipment are connected to real-time simulation equipment for HIL simulation. These simulations are used in the aerospace, defense, space, and utility industries. The rising implementation of autonomous driving and ADAS is expected to boost the demand for closed-loop hardware in the loop systems across the automotive industry.
-
BY OFFERINGSoftware plays a crucial role in ensuring accuracy, efficiency, and safety during the product development process. As embedded systems become more complex, the need for advanced software to simulate intricate behaviours and interactions grows. This makes software an essential component in reducing development time and improving product reliability.
-
BY VERTICALThe market in the power electronics sector is expected to witness the highest growth rate from 2025 to 20230. Companies in this sector use HIL to develop and test electronic grids, wind turbine generators, photovoltaic inverters, nuclear power plant control systems, and other products. Typhoon HIL (US), OPAL-RT Technologies (Canada), and Emerson Electric Co. (US) provide hardware-in-the-loop solutions to the power electronics segment.
-
BY REGIONThe Asia Pacific is expected to register the highest CAGR in the HIL market from 2025 to 2030. China, Japan, and India are significant drivers of the market. The rapid growth of the automotive, aerospace, and power electronics sectors has contributed to the growth of the HIL market. Some of the automobile manufacturers in the Asia Pacific using HIL are Subaru (Japan) and TATA Motors (India).
-
COMPETITIVE LANDSCAPECompanies such as dSPACE GmbH (Germany), Emeson Electric Co. (US), Vector Informatic GmbH (Germany), Elektrobit (Germany), and OPAL-RT Technologies (Canada) are the leading players in the market. These companies rely on strategies that include new product launches and developments, partnerships and collaborations, and acquisitions. Such advantages give these companies an edge over other companies in the market.
The hardware in the loop (HIL) market is experiencing robust growth, driven by rising adoption in automotive, aerospace, and industrial automation sectors for advanced, real-time simulation and validation.The market benefits from the accelerating complexity of embedded systems, autonomous vehicles, and regulatory requirements for more efficient and cost-effective testing. Expanding use cases in renewable energy, robotics, and smart infrastructure continue to reinforce HIL solutions as critical tools for innovation and compliance.
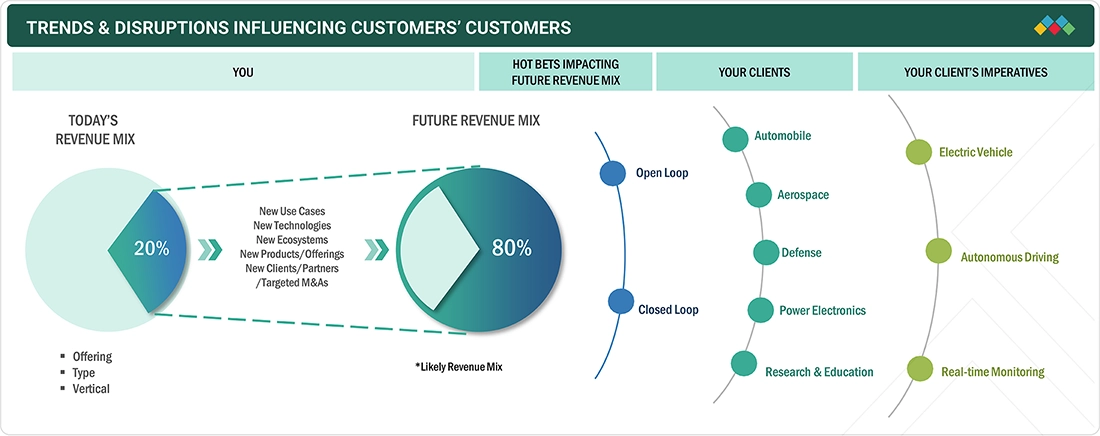
TRENDS & DISRUPTIONS IMPACTING CUSTOMERS' CUSTOMERS
HIL simulation is a key technology used in the automotive industry for testing control modules, such as those for engines and transmissions. With the complexity of powertrain systems, design departments are using HIL to test embedded software and controllers with actual hardware components to simulate real-world conditions. Hardware in the loop simulation can also benefit the development of ECUs for chassis and body electronics, such as airbags, active suspension, heating and cooling, seats, and keyless entry.
Source: Secondary Research, Interviews with Experts, MarketsandMarkets Analysis
MARKET DYNAMICS
Level
-
Faster product development with early stages of testing using hardware in the loop

-
Technological advancements in electric and autonomous vehicles

Level
-
High cost of ownership and technical complexity in implementation

Level
-
Adoption in new application areas such as power electronics and industrial robotics

Level
-
Reluctance to invest

-
Complexity in creating a real-time simulation

Source: Secondary Research, Interviews with Experts, MarketsandMarkets Analysis
Driver: Faster product development with early stages of testing using hardware in the loop
Many industries such as automobile, aerospace, defense, semiconductor, and energy are continuously working on reducing the time period utilized in product development stages where electronic controls are a crucial part of the product. Model-based design techniques such as V-cycle are implemented by companies to speed up the development of control systems during the development phase of a product.
Restraint: High cost of ownership and technical complexity in implementation
HIL is a complex technique because designing the mathematical model can be challenging due to the variables and the function block added to the system. Complex systems such as microgrids, aircraft models, and automobile environment generation need hardware capable of handling heavy data processing. This requires investing in an initial setup of expensive real-time simulators and rack computers to run the simulation model.
Opportunity: Adoption in new application areas such as power electronics and industrial robotics
The hardware-in-the-loop technique is primarily used for testing in the automotive and aerospace industries. As modern vehicles become more complex, the demand for hardware-in-the-loop testing solutions has increased. In the aviation sector, hardware-in-the-loop systems are mainly employed to verify and validate aerospace control systems. Because physical testing in this industry can be very risky for both the actual equipment and human safety, hardware-in-the-loop methods are favored for most testing requirements.
Challenge: Reluctance to invest
HIL testing requires significant investments in the initial stage, which is why manufacturers are often reluctant to invest in it. Limited awareness of its benefits, such as its ability to lower costs by identifying errors and issues early in development, also hampers its wider adoption.
Hardware in the Loop Market: COMMERCIAL USE CASES ACROSS INDUSTRIES
| COMPANY | USE CASE DESCRIPTION | BENEFITS |
|---|---|---|
 |
Simulation and validation platforms for automotive, aerospace, and industrial automation | Accelerates controller software testing, enables early fault detection, reduces development time |
 |
Modular HIL systems for embedded controller development in automotive (including EVs), aerospace, and energy | Shortens prototype cycles, increases test coverage, lowers costs, improves innovation speed |
 |
Power electronics and grid HIL solutions for energy and utilities | Real-time fault injection, safer equipment validation, robust compliance and risk reduction |
 |
HIL for automotive ECU, ADAS, and sensor simulation | Enhanced reliability of advanced driver-assistance systems, efficient failure mode exploration |
Logos and trademarks shown above are the property of their respective owners. Their use here is for informational and illustrative purposes only.
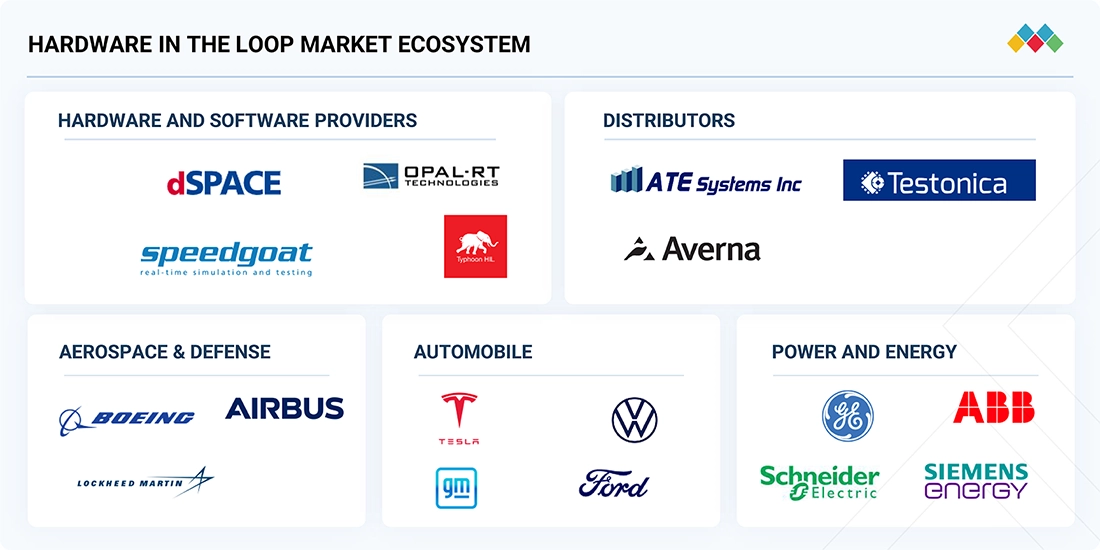
MARKET ECOSYSTEM
The HIL market ecosystem includes hardware and software providers, distributors, and potential customers. Hardware and software include companies like dSPACE (Germany), Emerson Electric Co. (US), and OPAL-RT Technologies (Canada), among others. Distributors include ATE Systems Inc. (US) and Testonica (Estonia), among others. The next part of the ecosystem includes potential customers. In terms of vertical, potential customers in the automobile industry include Tesla (US) and Ford (US). In aerospace, Boeing (US) and Airbus (France) are some of the major customers.
Logos and trademarks shown above are the property of their respective owners. Their use here is for informational and illustrative purposes only.
MARKET SEGMENTS

Source: Secondary Research, Interviews with Experts, MarketsandMarkets Analysis
Hardware in the Loop Market, By Offering
The hardware segment is expected to have the largest market size during the forecast period. HIL market offerings provide more authentic operational testing environments for practice and application. Several industries prefer dedicated hardware setups based on reliability and durability in testing, along with the capacity for high-speed, real-time simulations without latency. As testing needs continue to shift toward application testing, the use of customized hardware configurations will naturally evolve.
Hardware in the Loop Market, By Type
The closed-loop testing segment is expected to grow at the highest CAGR during the forecast period. Closed-loop HIL reduces time spent testing fatigue while allowing for a more accurate validation and testing of safety-critical systems. One of the most significant opportunities for growth is in the automotive industry, as closed-loop HIL is critical for validating ADAS, sensor fusion capabilities, and high-voltage powertrain components in realistic processing environments.
Hardware in the Loop Market, By Vertical
The automotive industry is expected to play a major role in the hardware-in-the-loop (HIL) market because of the growing use of the HIL technique for improving electronic control units (ECUs), reducing time-to-market, and meeting automotive standards. As the automotive sector adopts new technologies related to electric vehicles (EVs) or autonomous driving systems, the need for testing these new technologies becomes even more important for critical components, including Battery Management Systems (BMS), computer vision, LiDAR, and other sensor systems.
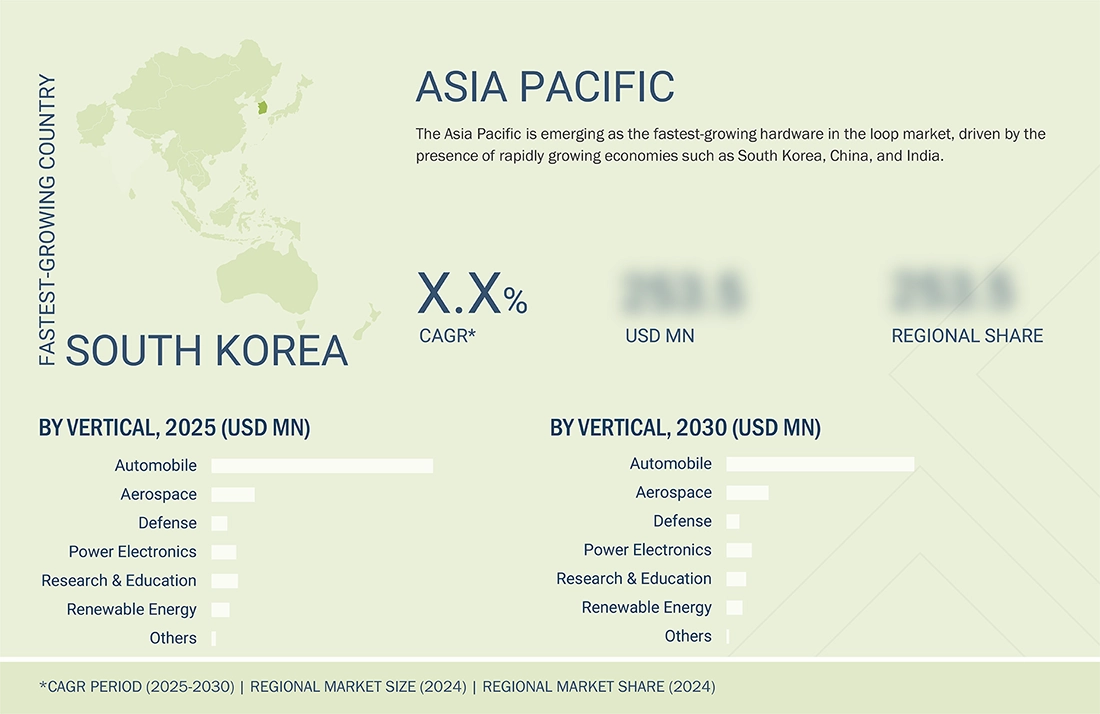
REGION
Asia Pacific to be fastest-growing region in global hardware in the loop market during forecast period
During the forecast period, the Asia Pacific region is projected to grow at the highest CAGR in the hardware-in-the-loop (HIL) industry due to various factors. Countries like China, India, and Japan have undergone rapid industrialization and infrastructural development, resulting in increased demand for HIL solutions in the automotive, aerospace, and electronics industries.
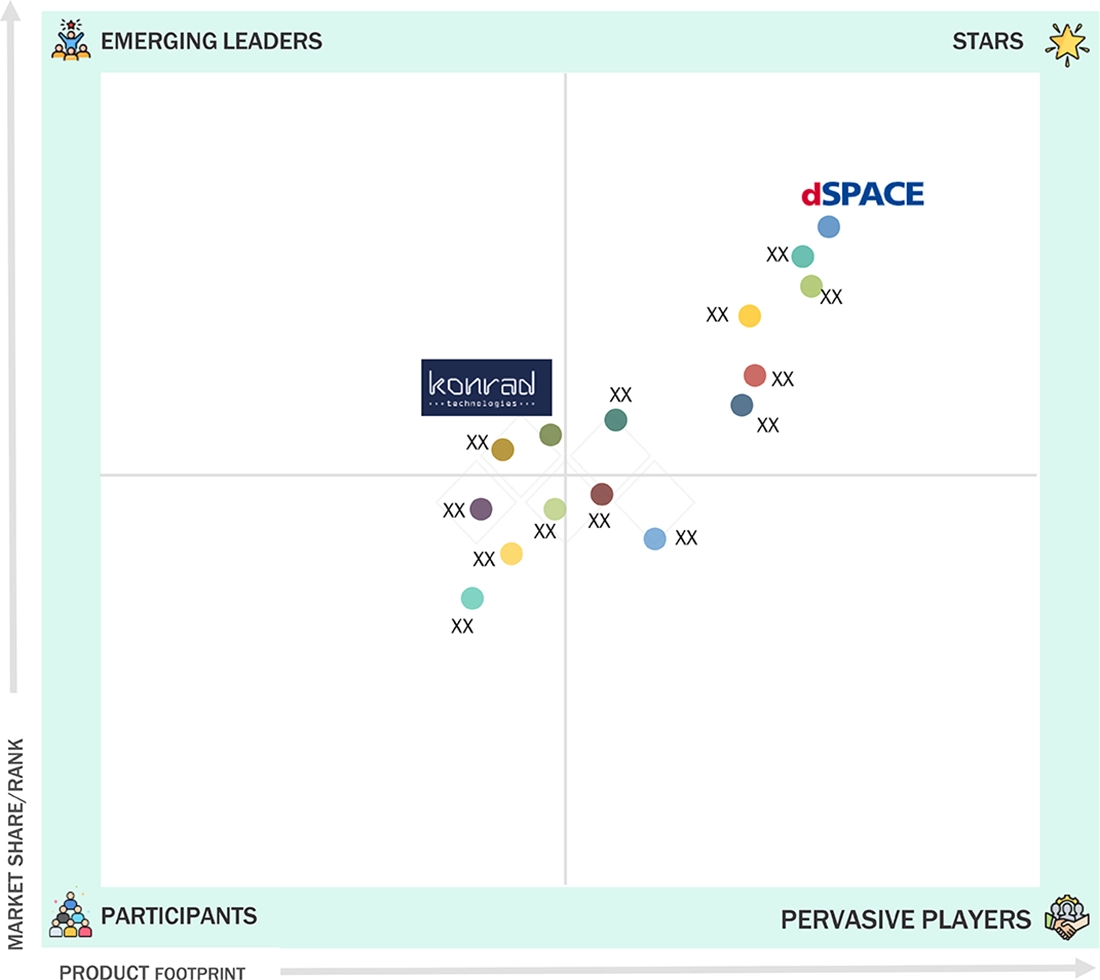
Hardware in the Loop Market: COMPANY EVALUATION MATRIX
dSPACE (Star) is a leading company in terms of product portfolio, technology offerings, and presence. Star companies are well-reputed in the market; therefore, it is easy for them to expand their reach worldwide. Konrad Technologies (Emerging Leader) shows strong growth potential. Emerging leaders are characterized by innovative products and substantial R&D portfolios.
Source: Secondary Research, Interviews with Experts, MarketsandMarkets Analysis
KEY MARKET PLAYERS
MARKET SCOPE
| REPORT METRIC | DETAILS |
|---|---|
| Market Size in 2024 (Value) | USD 1.00 Billion |
| Market Forecast in 2030 (Value) | USD 1.78 Billion |
| Growth Rate | CAGR of 10.1% from 2025-2030 |
| Years Considered | 2021-2030 |
| Base Year | 2024 |
| Forecast Period | 2025-2030 |
| Units Considered | Value (USD Million/Billion), Volume (Thousand Units) |
| Report Coverage | Revenue forecast, company ranking, competitive landscape, growth factors, and trends |
| Segments Covered |
|
| Regions Covered | North America, Asia Pacific, Europe, RoW |
WHAT IS IN IT FOR YOU: Hardware in the Loop Market REPORT CONTENT GUIDE
DELIVERED CUSTOMIZATIONS
We have successfully delivered the following deep-dive customizations:
| CLIENT REQUEST | CUSTOMIZATION DELIVERED | VALUE ADDS |
|---|---|---|
| Leading Automotive OEM | Competitive profiling of HIL system suppliers (product offerings, integration capabilities, test coverage) | Identify qualified HIL technology partners |
| Component/System Manufacturer | Benchmarking of HIL adoption across automotive, aerospace, industrial controls | Switching cost analysis for test platform migrations |
RECENT DEVELOPMENTS
- January 2025 : dSPACE, a leading provider of solutions for developing connected, autonomous, and electric vehicles, partnered with Microsoft to explore the use of generative AI in advancing virtual electronic control unit (V-ECU) development. This collaboration aims to enhance software-in-the-loop (SIL) testing by leveraging AI to accelerate V-ECU creation and updates, enabling greater efficiency and faster CI/CD and validation pipelines.
- February, 2025 : Elektrobit partnered with Cognizant to integrate its Adaptive AUTOSAR solution into Cognizant's Software-Defined Vehicle (SDV) solution accelerator. This collaboration aims to assist OEMs and Tier 1 suppliers in developing scalable and flexible SDV architectures, thereby accelerating development cycles and enhancing customer satisfaction.
- November 2024 : OPAL-RT Technologies recently concluded its first-ever real-time simulation conference, RT24-IN, in Bengaluru, India. The event featured the unveiling of the OP1400-BM Bench, a specialized Power-Hardware-in-the-Loop (PHIL) system designed for academic use.
- June 2023 : NI (formerly National Instruments) announced that it had joined the Indy Autonomous Challenge (IAC) as the official Hardware-in-the-Loop (HIL) Technology Sponsor. This partnership allows IAC teams to leverage NI's state-of-the-art HIL test systems to validate car architectures and thoroughly test components in a controlled environment before racing. The collaboration aims to advance autonomous vehicle technology and accelerate its commercialization by providing a unified testing ground for industry technologies.
Table of Contents
 Exclusive indicates content/data unique to MarketsandMarkets and not available with any competitors.
Methodology
This research study involved the extensive use of secondary sources, directories, and databases such as Hoovers, Bloomberg, Businessweek, Factiva, and OneSource, to identify and collect information useful for a technical, market-oriented, and commercial study of the hardware in the loop market. Primary sources were several experts from core and related industries and preferred suppliers, manufacturers, distributors, service providers, technology developers, and organizations related to all the segments of the value chain of the hardware in the loop ecosystem.
In-depth interviews with various primary respondents, such as key industry participants, subject matter experts (SMEs), C-level executives of key market players, and industry consultants, among other experts, were conducted to obtain and verify critical qualitative and quantitative information and assess future market prospects.
Secondary Research
Secondary sources referred to for this research study included corporate filings (such as annual reports, investor presentations, and financial statements); trade, business, and professional associations; white papers; certified publications; articles by recognized authors; directories; and databases. Secondary data was collected and analyzed to arrive at the overall market size, which was further validated through primary research.
Primary Research
Extensive primary research was conducted after gaining knowledge about the current scenario of the hardware in the loop market through secondary research. Several primary interviews were conducted with experts from both the demand and supply sides across four major regions: North America, Europe, Asia Pacific, and RoW. This primary data was collected through questionnaires, emails, and telephone interviews.

Note: Other designations include sales managers, marketing managers, and product managers.
The three tiers of the companies have been defined based on their total revenue as of 2024; tier 1: revenue greater than USD 1 billion; tier 2: revenue between USD 500 million and USD 1 billion; and tier 3: revenue less than USD 500 million.
To know about the assumptions considered for the study, download the pdf brochure
Market Size Estimation
Both the top-down and bottom-up approaches were used to estimate and validate the size of the hardware in the loop market and its various dependent submarkets.
Hardware in the Loop Market : Top-Down and Bottom-Up Approach

Data Triangulation
After arriving at the overall market size using the market size estimation processes explained above, the market was split into several segments and subsegments. The data triangulation and market breakup procedures were employed, wherever applicable, to complete the overall market engineering process and arrive at the exact statistics of each market segment and subsegment. The data was triangulated by studying various factors and trends from both the demand and supply sides.
Market Definition
Hardware in the loop (HIL) is a hardware simulation/emulation technology used to virtually emulate a plant under control. This virtual environment is later connected to an electronic control unit (ECU) to observe the real-time performance of the ECU without even connecting to the physical plant. This report covers various verticals of hardware in the loop systems, such as aerospace, defense, automotive, power electronics, renewable energy, and research & education.
Key Stakeholders
- End users of hardware in the loop
- Hardware in the loop solution providers
- Technology providers
- Research organizations and consulting companies
- Venture capitalists, private equity firms, and start-ups
- Research organizations and consulting companies
- Technology standard organizations, forums, alliances, and associations
Report Objectives
- To define and forecast the hardware in the loop market size by type and vertical in terms of value
- To describe and forecast the market for four key regions: North America, Europe, Asia Pacific, and Rest of the World (RoW), along with their respective countries
- To provide detailed information regarding the significant drivers, restraints, opportunities, and challenges influencing the market growth
- To strategically analyze micromarkets1 with respect to individual growth trends, prospects, and contributions to the overall market
- To study the complete value chain of the hardware in the loop market
- To analyze opportunities in the market for stakeholders by identifying high-growth segments of the hardware in the loop ecosystem
- To strategically profile key players and comprehensively analyze their market position in terms of ranking and core competencies2 and provide details of the competitive landscape
- To analyze strategic approaches such as product launches, collaborations, contracts, acquisitions, agreements, expansions, and partnerships in the hardware in the loop market
Available Customizations
With the given market data, MarketsandMarkets offers customizations according to the specific requirements of companies. The following customization options are available for the report:
Company Information
- Detailed analysis and profiling of additional market players
Key Questions Addressed by the Report
Need a Tailored Report?
Customize this report to your needs
Get 10% FREE Customization
Customize This ReportPersonalize This Research
- Triangulate with your Own Data
- Get Data as per your Format and Definition
- Gain a Deeper Dive on a Specific Application, Geography, Customer or Competitor
- Any level of Personalization
Let Us Help You
- What are the Known and Unknown Adjacencies Impacting the Hardware in the Loop Market
- What will your New Revenue Sources be?
- Who will be your Top Customer; what will make them switch?
- Defend your Market Share or Win Competitors
- Get a Scorecard for Target Partners

Custom Market Research Services
We Will Customise The Research For You, In Case The Report Listed Above Does Not Meet With Your Requirements
Get 10% Free CustomisationGrowth opportunities and latent adjacency in Hardware in the Loop Market


Dan
Feb, 2016
Is this report includes the profile of Danlaw?.
Jan
Feb, 2016
We are quite interested in the HIL growth potential in the aerospace industry and which type of HIL systems are used there at the moment. Furthermore, we have an interest in future HIL development in the field of Infotainment and ADAS testing in the automotive industry..
Thorsten
Feb, 2019
Interested in HiL market for Automotive industry .
Rob
May, 2019
Hi, I'm conducting a research for a university project. It would really helpful for me to have a list of all HiL system providers in the UK/Europe. .