
Power Electronics Market Size, Share & Trends

Power Electronics Market Size, Share & Trends by Power Discrete (Diode, Transistor, Thyristor), Power Module (FET, IGBT, Intelligent Power Module, Standard and Power Integrated Module), Power IC, Silicon, Silicon Carbide, Gallium Nitride - Global Forecast to 2030


POWER ELECTRONICS MARKET SIZE, SHARE & TRENDS
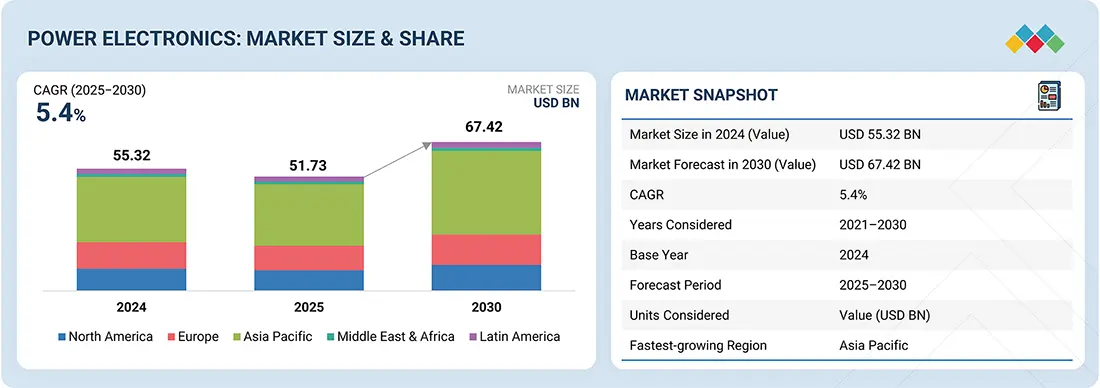
According to Marketsandmarkets, the global Power Electronics Market Size was valued at USD 51.73 billion in 2025 and is projected to reach USD 67.42 billion by 2030, growing at a CAGR of 5.4% from 2025 to 2030. The market growth is driven by increasing demand for energy-efficient power management solutions across various sectors, including renewable energy, electric vehicles (EVs), industrial automation, and consumer electronics. Advances in semiconductor technologies, such as wide bandgap (WBG) technologies like silicon carbide (SiC) and gallium nitride (GaN), contribute to improved performance, higher efficiency, and reduced size of power electronic devices. Government initiatives to reduce carbon emissions and promote clean energy transitions are further bolstering the adoption of power electronics solutions globally.
MARKET SNAPSHOT TABLE
| REPORT METRIC | DETAILS |
|---|---|
| Market Size in 2025 (Value) | USD 51.73 Billion |
| Market Forecast in 2030 (Value) | USD 67.42 Billion |
| Growth Rate | CAGR of 5.4% from 2025-2030 |
| Years Considered | 2021-2030 |
| Base Year | 2024 |
| Forecast Period | 2025-2030 |
| Units Considered | Value (USD Million) |
| Report Coverage | Revenue forecast, company ranking, competitive landscape, growth factors, and trends |
| Segments Covered |
|
| Regions Covered | North America, Asia Pacific, Europe, the Middle East & Africa, and Latin America |
| Top Companies |
|
| Growth Drivers |
|
POWER ELECTRONICS MARKET GROWTH & FORECAST
POWER ELECTRONICS MARKET SHARE KEY TAKEAWAYS
-
BY TYPEPower ICs enable enhanced power management in applications like consumer electronics, automotive, and industrial systems, driving widespread adoption as industries prioritize energy efficiency and miniaturization.
-
BY MATERIALSilicon holds the largest market share in the power electronics market due to its mature technology, cost-effectiveness, and widespread availability. It offers reliable performance for various applications, including industrial drives, consumer electronics, and renewable energy systems, making it the preferred choice despite emerging alternatives like SiC and GaN.
-
BY VOLTAGEThe low voltage segment holds the largest market share in the power electronics market due to its extensive use in consumer electronics, industrial automation, and electric vehicles. Increasing demand for energy-efficient devices, widespread adoption of low-voltage drives, and government regulations promoting energy savings drive its significant growth.
-
BY VERTICALThe automotive & transportation segment holds the largest market share in the power electronics market due to rising electric vehicle (EV) adoption, stringent emission regulations, and growing demand for advanced driver-assistance systems (ADAS). Power electronics improve energy efficiency, power management, and performance in EVs, hybrid vehicles, and smart transportation systems.
-
BY REGIONThe Asia Pacific region holds the largest market share due to rapid industrialization, increasing adoption of renewable energy, and rising electric vehicle demand. Strong manufacturing capabilities in countries like China, Japan, and India, supported by government incentives for energy-efficient technologies, drive significant market growth during the forecast period.
-
COMPETITIVE LANDSCAPEThe major market players have adopted both organic and inorganic strategies, including partnerships, mergers & acquisitions, and investments. For instance, Infineon Technologies AG and Semiconductor Components Industries, LLC have engaged in various strategic collaborations and acquisitions to enhance their product portfolios and expand their market presence.
The power electronics Industry is projected to witness strong growth over the next decade, driven by rising demand for energy-efficient solutions and advancements in semiconductor technologies such as silicon carbide (SiC) and gallium nitride (GaN). Industries are increasingly adopting power electronics for their ability to enhance efficiency, reduce power losses, and enable compact system designs, making them vital in electric vehicles, renewable energy systems, industrial automation, and consumer electronics.
Source: Secondary Research, Interviews with Experts, MarketsandMarkets Analysis
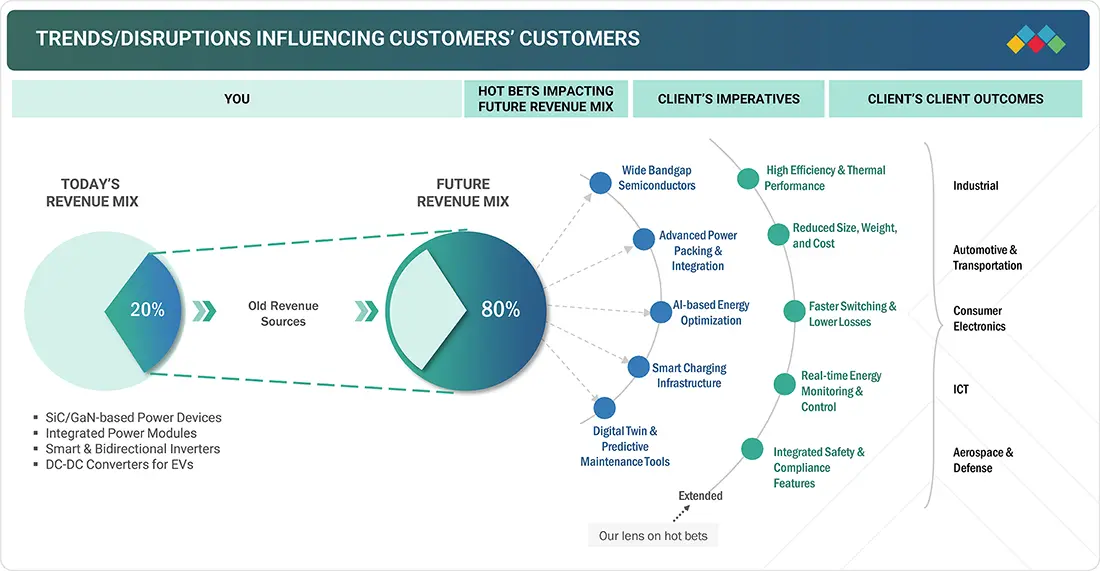
TRENDS & DISRUPTIONS IMPACTING CUSTOMERS' CUSTOMERS
The power electronics market trends is undergoing significant transformation driven by emerging trends and disruptions that will reshape the future revenue mix over the next 4–5 years. Key trends include wide bandgap semiconductors, advanced power packaging & integration, AI-based energy optimization, smart charging infrastructure, and digital twin & predictive maintenance tools. Power electronics devices are used in automotive applications for electric vehicle inverters, battery management systems, and DC-DC converters; in industrial sectors for motor drives and factory automation; in consumer electronics for power supplies and chargers; in ICT for data center power management; and in aerospace for efficient power conversion and control. These innovations address client imperatives such as high efficiency, advanced integration, and predictive capabilities, benefiting automotive, industrial, consumer electronics, ICT, and aerospace sectors.
Source: Secondary Research, Interviews with Experts, MarketsandMarkets Analysis
POWER ELECTRONICS MARKET DYNAMICS
Level
-
Widespread adoption of renewable power sources

Level
-
High cost of designing and complexities associated with integrating multiple functionalities into single chip

Level
-
Emergence of wide bandgap semiconductor materials

Level
-
Difficulties in designing and packaging SiC power devices

Source: Secondary Research, Interviews with Experts, MarketsandMarkets Analysis
Driver: Widespread adoption of renewable power sources
The widespread adoption of renewable energy sources like solar and wind is a key driver for the power electronics market growth. These sources require advanced power electronics, such as inverters and converters, to efficiently manage energy conversion and integrate with the grid. Governments and utilities are heavily investing in renewable infrastructure, as seen with initiatives like India's PM-KUSUM scheme and the U.S. Inflation Reduction Act. This investment boosts the demand for reliable and efficient power electronic devices. Companies like Hitachi Energy and ABB are responding by developing new converter technologies to support large-scale renewable integration and improve grid stability.
Restraint: High cost of designing and complexities associated with integrating multiple functionalities into single chip
The high cost and complexity of integrating multiple functions into a single chip are key restraints for the power electronics market. The demand for compact, efficient, and high-performance power systems, such as system-on-chip (SoC) solutions, drives significant R&D investment and requires advanced packaging. Combining analog, digital, and power components on one chip introduces challenges like thermal management and interference, which increase costs. This poses a barrier for smaller manufacturers with limited capital, slowing down the adoption of new power devices. For example, both Infineon and Texas Instruments have developed advanced integrated solutions but acknowledge their premium cost due to these design and fabrication complexities.
Opportunity: Emergence of wide bandgap semiconductor materials
The emergence of wide bandgap (WBG) semiconductor materials, like GaN and SiC, is a significant opportunity for the power electronics market share. These materials enable the creation of smaller, faster, and more reliable components with greater efficiency than traditional silicon-based parts. This higher efficiency reduces power loss and allows for more compact systems, cutting down on size, weight, and overall costs. WBG materials also improve existing technologies like MOSFETs and IGBTs, allowing them to operate at higher switching speeds. Leading companies such as Infineon, NXP, and STMicroelectronics are already using these materials for demanding applications like electric vehicles and optoelectronics.
Challenge: Difficulties in designing and packaging SiC power devices
A major challenge for power electronics is the difficulty in designing and packaging SiC power devices, despite their advantages in high-voltage, high-efficiency applications like electric vehicles. While SiC offers superior thermal conductivity and faster switching speeds than silicon, its widespread adoption is hindered by complex design and packaging requirements. SiC chips need specialized packaging to manage high temperatures and power densities without compromising reliability. Companies like STMicroelectronics is investing in advanced packaging and manufacturing to overcome these issues. The design process must address issues like parasitic inductance and thermal stress, which are more pronounced in SiC devices, to ensure optimal performance and reliability.
POWER ELECTRONICS MARKET SIZE, SHARE & GROWTH, 2030: COMMERCIAL USE CASES ACROSS INDUSTRIES
| COMPANY | USE CASE DESCRIPTION | BENEFITS |
|---|---|---|
 |
Power electronics are core to electric vehicle platforms and energy storage solutions. They are used in the EV powertrain (inverters, DC-DC converters), and in home energy products like Powerwall, which integrates an inverter for solar and battery management. | For EVs, the benefits include increased range, efficiency, and performance. For home energy systems, the benefits include providing backup power during outages, enabling energy savings through time-of-use rates, and contributing to a more sustainable energy ecosystem. |
 |
Some of the major applications include power generation (solar inverters), mobility electrification (EV charging and powertrains), and green ICT infrastructure (data centers and telecommunication networks). | Advanced power electronics solutions lead to higher efficiency in renewable energy systems, accelerate the adoption of green transportation with ultra-fast charging, and enable the construction of low-carbon, intelligent data centers and communication networks. |
 |
Large-scale renewable energy and grid applications include converters and inverters for wind turbines, solar farms, hydropower, and battery energy storage systems (BESS). | Stabilization of the grid, improvement in the efficiency of renewable energy generation, and capability to integrate diverse energy sources contribute to a more reliable, sustainable, and resilient power systems. |
 |
Adoption of power management ICs for smartphones, TVs, and appliances along with data centers. | Development of compact and energy-efficient products, extended battery life in mobile devices, and improved efficiency of home appliances and data center infrastructure contributing to resource efficiency and a circular economy. |
Logos and trademarks shown above are the property of their respective owners. Their use here is for informational and illustrative purposes only.
POWER ELECTRONICS MARKET GROWTH ECOSYSTEM
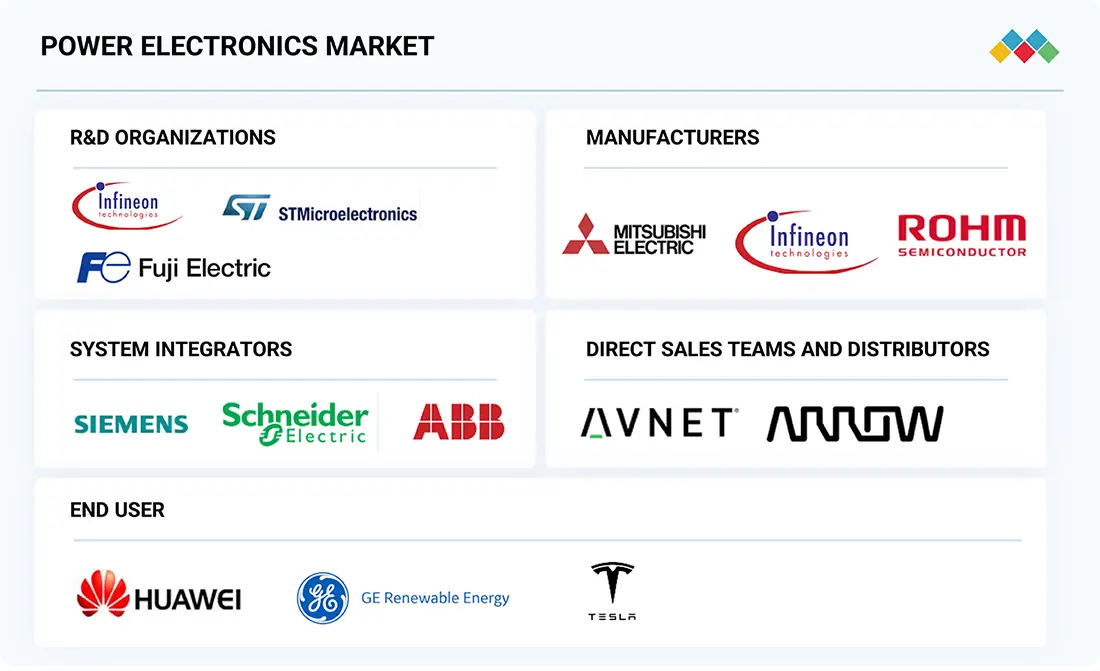
The power electronics ecosystem involves identifying and analyzing interconnected relationships among various stakeholders, including semiconductor material suppliers, power device manufacturers, system integrators, distributors, and end users. The semiconductor material suppliers provide key materials like silicon, silicon carbide (SiC), and gallium nitride (GaN) to power device manufacturers. The manufacturers use technologies such as wafer fabrication, packaging, and module assembly to produce power semiconductor devices and power electronic modules. The distributors and suppliers facilitate the connection between manufacturing companies and end users, streamlining the supply chain, enhancing operational efficiency, and driving profitability across the industry.
Logos and trademarks shown above are the property of their respective owners. Their use here is for informational and illustrative purposes only.
POWER ELECTRONICS MARKET GROWTH SEGMENTS
Source: Secondary Research, Interviews with Experts, MarketsandMarkets Analysis
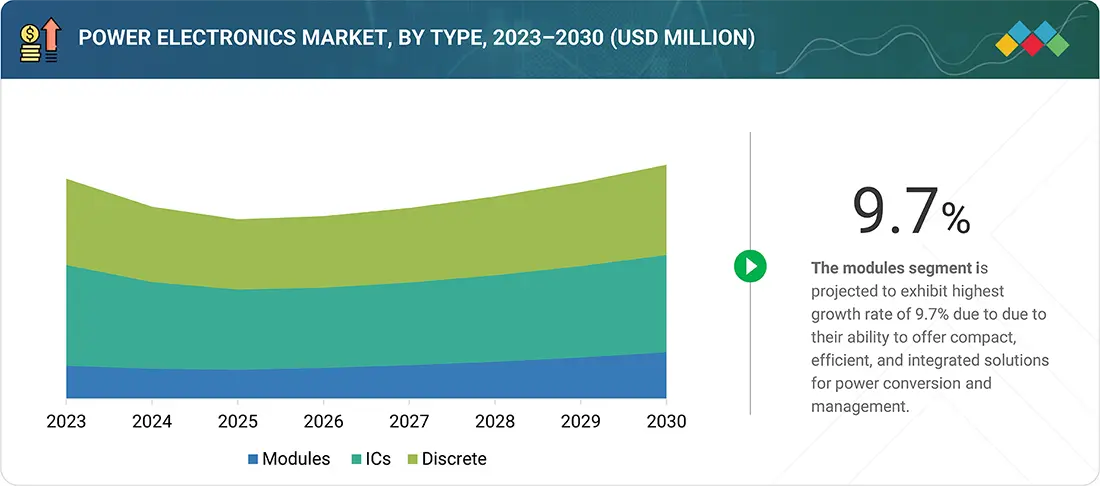
Power Electronics Market, By Type
The modules segment in the power electronics market is expected to witness the highest CAGR during the forecast period due to increasing demand for integrated power electronic solutions that offer improved efficiency, compactness, and reliability. Power modules combine multiple power semiconductor devices into a single package, simplifying design and reducing system size and thermal losses. As industries such as automotive (especially electric vehicles), renewable energy, and industrial automation focus on reducing energy consumption and enhancing performance, power modules become increasingly essential. Their ability to support high power density, robust thermal management, and ease of integration drives significant adoption, fueling market growth.
Power Electronics Market, By Material
Silicon carbide (SiC) is expected to witness the highest CAGR in the power electronics market during the forecast period due to its superior electrical, thermal, and mechanical properties compared to traditional silicon (Si). SiC offers higher breakdown voltage, greater thermal conductivity, and faster switching speeds, enabling improved energy efficiency, compact design, and better performance in high-power and high-temperature applications. These advantages make SiC ideal for applications in electric vehicles, renewable energy systems, industrial motor drives, and power supplies. The rising demand for energy-efficient solutions, coupled with declining manufacturing costs of SiC devices, further accelerates its market growth.
Power Electronics Market, By Voltage
The medium voltage (MV) segment in the power electronics market is expected to witness the highest CAGR during the forecast period due to rising industrial automation and growing demand for efficient energy distribution. Medium voltage converters and inverters are widely used in industries such as manufacturing, energy, and transportation, where they enhance energy efficiency and ensure reliable power supply. Additionally, the increasing deployment of renewable energy sources like solar and wind power at the grid level requires robust medium voltage power electronics for grid integration and stability. These factors, coupled with technological advancements and strict energy regulations, drive strong market growth.
Power Electronics Market, By Vertical
The automotive & transportation segment in the power electronics market is expected to witness the highest CAGR during the forecast period due to the rapid shift toward electrification of vehicles, driven by stringent emission regulations and growing environmental concerns. Increasing adoption of electric vehicles (EVs) and hybrid electric vehicles (HEVs) is accelerating demand for advanced power electronics components such as inverters, converters, and battery management systems. Furthermore, government incentives promoting clean energy vehicles, advancements in semiconductor technologies, and rising consumer awareness about sustainable mobility are further boosting market growth. These factors collectively contribute to the robust expansion of power electronics in automotive applications.
POWER ELECTRONICS MARKET TRENDS BY REGION
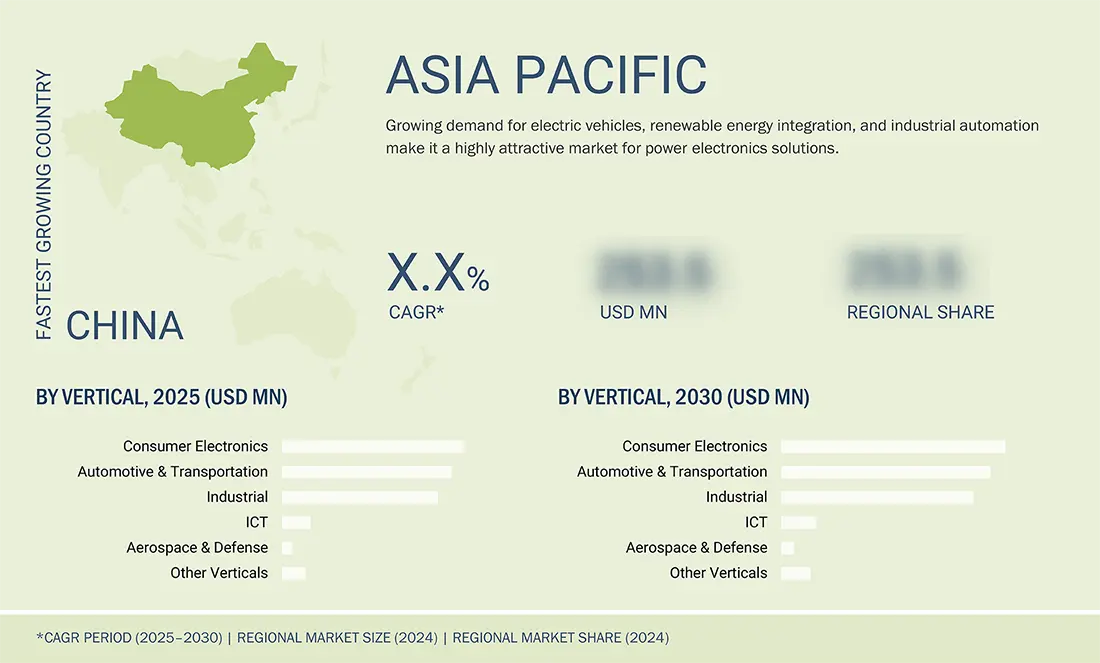
Asia Pacific to be fastest-growing region in global power electronics market during forecast period
The Asia Pacific region is the fastest-growing market for power electronics during the forecast period due to rapid industrialization, increasing urbanization, and strong government initiatives supporting renewable energy adoption. The region is home to major manufacturers of power electronic components and systems, especially in countries like China, Japan, South Korea, and India. High demand for electric vehicles, industrial automation, and energy-efficient power solutions further accelerate growth. Additionally, substantial investments in infrastructure development, expansion of smart grids, and the rising trend of energy storage systems contribute to market growth. Competitive manufacturing costs and large consumer base also drive regional dominance.
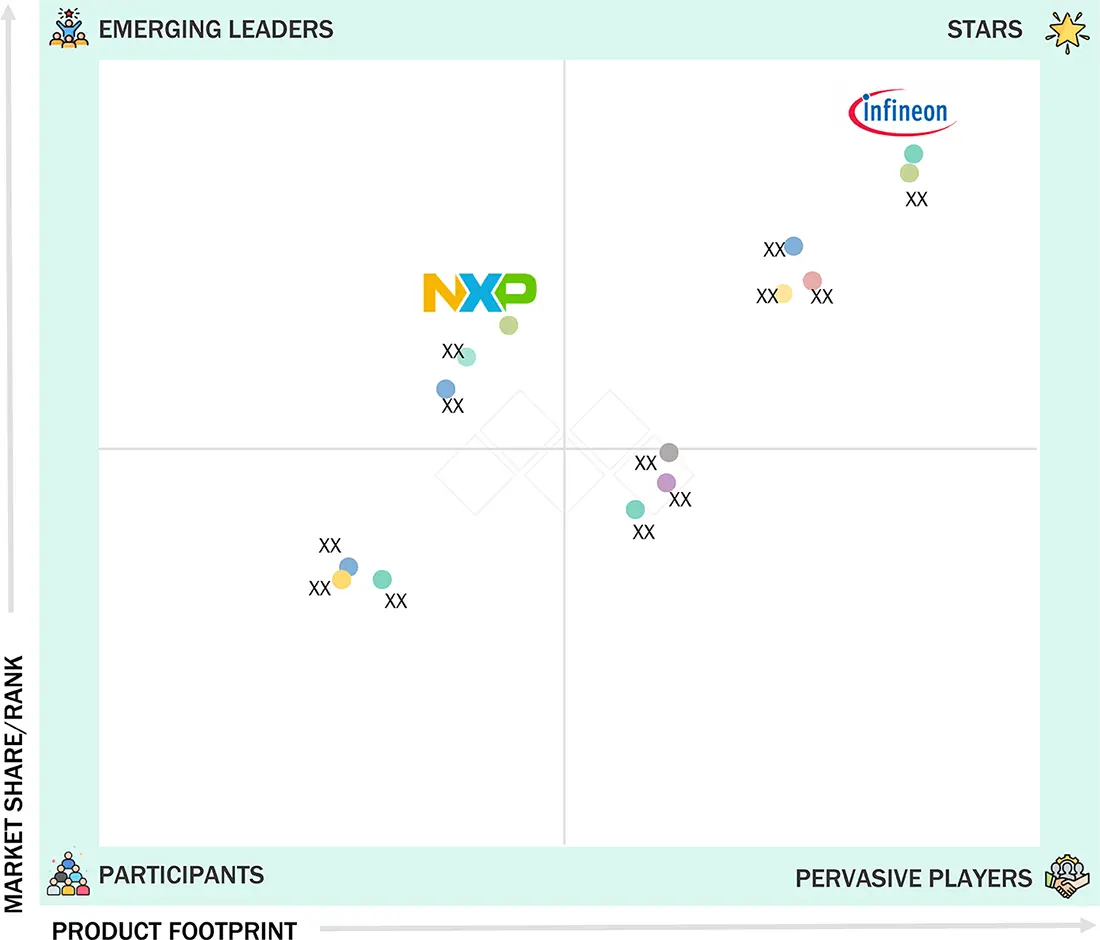
POWER ELECTRONICS MARKET SIZE, SHARE & GROWTH, 2030: COMPANY EVALUATION MATRIX
In the power electronics market matrix, Infineon Technologies AG (Star) leads with a strong market presence, advanced semiconductor technologies, and a broad product portfolio, driving widespread adoption in automotive, industrial automation, renewable energy, and consumer electronics applications. NXP Semiconductors (Emerging Leader) is gaining momentum with innovative solutions in automotive power management, smart energy applications, and industrial power devices. While Infineon dominates the market through scale, technological leadership, and global reach, NXP Semiconductors demonstrates significant growth potential, supported by strong R&D and expanding product offerings, positioning itself to advance toward the leaders’ quadrant in the power electronics market.
Source: Secondary Research, Interviews with Experts, MarketsandMarkets Analysis
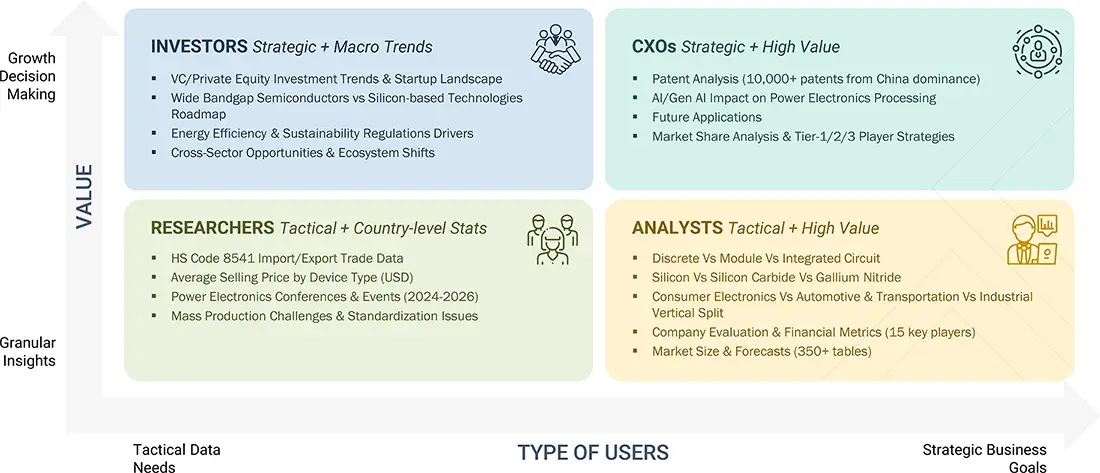
WHAT IS IN IT FOR YOU: POWER ELECTRONICS MARKET SIZE, SHARE & GROWTH, 2030 REPORT CONTENT GUIDE
DELIVERED CUSTOMIZATIONS
We have successfully delivered the following deep-dive customizations:
| CLIENT REQUEST | CUSTOMIZATION DELIVERED | VALUE ADDS |
|---|---|---|
| US-based Power Electronics Manufacturer | • Detailed company profiles of competitors • (Financials, product portfolio) by end-use sector • Partnership ecosystem mapping by end-use sector | • Identify interconnections and supply chain blind spots • Detect customer migration trends across industries • Highlight untapped customer clusters for market entry |
| Power Electronics Module Manufacturer | • Comprehensive list of module manufacturers with segmentation by industry and application - Benchmarking of adoption rates across ICT, consumer electronics, industrial, and automotive & transportation - Analysis of switching barriers for customers | • Insights on revenue shifts towards emerging applications • Pinpoint cross-high substitution risks and opportunities • Enable targeting of high-margin applications |
| Automotive Power Electronics Customer | • Assessment of OEM adoption roadmaps | • Identify future applications in EV lightweighting & thermal management • Secure early-mover advantage in emerging applications |
RECENT DEVELOPMENTS
- April 2025 : Infineon Technologies AG launched CoolSiC MOSFET 750?V G2. It is a next-generation silicon carbide power transistor designed for automotive and industrial applications.
- November 2024 : Infineon Technologies and Stellantis announced a collaboration to jointly develop next-generation power conversion and distribution architecture for Stellantis’ electric vehicles (EVs).
- February 2024 : Texas Instruments (TI) launched two new power conversion device portfolios at APEC 2024 to help engineers deliver higher power density in compact spaces for automotive and industrial applications.
- July 2023 : Semiconductor Components Industries and BorgWarner Inc., known for innovative and sustainable mobility solutions globally, declared an expansion in their strategic partnership focused on SiC, marking a total agreement value exceeding USD 1 billion over its lifetime.
- May 2022 : Analog Devices collaborated with Infineon to develop advanced power electronics for renewable energy systems, focusing on efficient energy conversion and sustainable tech innovations.
Table of Contents
 Exclusive indicates content/data unique to MarketsandMarkets and not available with any competitors.
Methodology
The research study involved four major activities in estimating the size of the power electronics market. Exhaustive secondary research has been done to collect important information about the market and peer markets. The validation of these findings, assumptions, and sizing with the help of primary research with industry experts across the value chain has been the next step. Both top-down and bottom-up approaches have been used to estimate the market size. Post, the market breakdown and data triangulation have been adopted to estimate the market sizes of segments and sub-segments.
Secondary Research
In the secondary research process, various secondary sources were referred to identify and collect information required for this study. The secondary sources include annual reports, press releases, investor presentations of companies, white papers, and articles from recognized authors. Secondary research has been mainly done to obtain key information about the market’s value chain, the pool of key market players, market segmentation according to industry trends, regional outlook, and developments from both market and technology perspectives.
Primary Research
In primary research, various primary sources from both the supply and demand sides have been interviewed to obtain qualitative and quantitative insights required for this report. Primary sources from the supply side include experts such as CEOs, vice presidents, marketing directors, manufacturers, technology and innovation directors, end users, and related executives from multiple key companies and organizations operating in the power electronics market ecosystem. After interacting with industry experts, brief sessions were conducted with highly experienced independent consultants to reinforce the findings from our primary research. This, along with the in-house subject matter experts’ opinions, has led us to the findings as described in the report. The breakdown of primary respondents is as follows:

Note: “Others” includes sales, marketing, and product managers.
To know about the assumptions considered for the study, download the pdf brochure
Market Size Estimation
In the market engineering process, both top-down and bottom-up approaches, along with data triangulation methods, have been used to estimate and validate the size of the power electronics market and other dependent submarkets. The research methodology used to estimate the market sizes includes the following:
The bottom-up procedure has been employed to arrive at the overall size of the power electronics market.
- Major companies that provide power electronics devices were identified. This included analyzing company portfolios, product offerings, and presence across various regions.
- The segment-specific revenues of the companies, particularly those related to power electronics, were determined.
- The product-specific revenues of the companies, particularly those related to power electronics, were determined.
- These individual revenue figures were compiled to determine the total revenue generated across the identified companies within the sector.
- Using this consolidated data, the global market size for power electronics was obtained.
The top-down approach has been used to estimate and validate the total size of the power electronics market.
- Identified top-line investments and spending in the ecosystem and major market developments to consider segment-level splits
- Estimated the overall power electronics market size, then segmented the global market by allocating shares based on the segments considered
- Distributed the segment-level markets into regions and countries by aligning regional power electronics activity with economic indicators, power electronics manufacturing presence, and national development initiatives
Power Electronics Market : Top-Down and Bottom-Up Approach

Data Triangulation
After arriving at the overall market size using the market size estimation processes as explained above, the market has been split into several segments and subsegments. To complete the entire market engineering process and arrive at the exact statistics of each market segment and subsegment, data triangulation and market breakdown procedures have been employed, wherever applicable. The data has been triangulated by studying various factors and trends from the demand and supply sides of the power electronics market.
Market Definition
The power electronics market involves the design, development, and deployment of systems that control and convert electrical power using solid-state electronics. These systems are essential in efficiently managing energy flow in a wide range of applications across automotive, industrial, consumer electronics, renewable energy, and telecommunication sectors. Power electronics solutions are crucial for optimizing energy conversion, reducing losses, and improving performance in systems that operate at various voltage and power levels. Key components in power electronics include power integrated circuits (ICs), insulated-gate bipolar transistors (IGBTs), metal-oxide-semiconductor field-effect transistors (MOSFETs), diodes, and thyristors, which are often integrated with control units, sensors, and thermal management solutions. These systems enable precise control of voltage, frequency, and current, contributing to higher energy efficiency and system reliability. With the increasing adoption of electric vehicles, renewable energy installations, and smart grid technologies, the demand for compact, lightweight, and energy-efficient power electronics is rising. Modern systems incorporate digital control, real-time monitoring, and AI-based diagnostics to enable predictive maintenance and fault detection. As industries transition toward electrification and sustainability, power electronics play a pivotal role in enhancing operational efficiency, reducing emissions, and supporting the development of advanced, intelligent energy systems.
Key Stakeholders
- Raw material & wafer suppliers
- Component manufacturers
- Original equipment manufacturers (OEMs)
- Integrated device manufacturers (IDMs)
- Original design manufacturers (ODMs)
- Assembling, testing, and packaging vendors
- Technology, service, and solution providers
- Suppliers and distributors
- Government and other regulatory bodies
- Research institutes and organizations
Report Objectives
- To define, describe, segment, and forecast the power electronics market size by device type, material, voltage level, vertical, and region, in terms of value
- To define, describe, and forecast the power electronics market size in four key regions: North America, Europe, Asia Pacific, and Rest of the World (RoW), in terms of value
- To provide detailed information regarding the key factors, such as drivers, restraints, opportunities, and challenges influencing the growth of the market
- To analyze the power electronics value chain and ecosystem, along with the average selling price by device type and region
- To strategically study the regulatory landscape, tariff, standards, patents, Porter’s Five Forces, import & export scenarios, trade values, and case studies pertaining to the market under study
- To understand micromarkets with regard to individual growth trends, prospects, and contributions to the overall market
- To assess opportunities in the market for stakeholders by identifying high-growth segments
- To provide details of the competitive landscape for market leaders
- To offer the impact of AI/Gen AI on the power electronics market
- To outline the macroeconomic outlook for the regions under study
- To analyze strategies such as product launches, collaborations, acquisitions, and partnerships adopted by players in the power electronics market
- To profile key market players and comprehensively analyze their ranking based on their revenue, market share, and core competencies
Available customizations:
With the given market data, MarketsandMarkets offers customizations according to the specific requirements of companies. The following customization options are available for the report:
Country-wise Information:
- Country-wise breakdown for North America, Europe, Asia Pacific, and Rest of the World
Company Information:
- Detailed analysis and profiling of additional market players (up to five)
Key Questions Addressed by the Report
What is the current size of the global power electronics market?
The global power electronics market is valued at USD 51.73 billion in 2025 and is projected to reach USD 67.42 billion by 2030. (MarketsandMarkets)
What is the expected growth rate of the power electronics market?
The market is expected to grow at a CAGR of 5.4% from 2025 to 2030, driven by increasing demand for energy-efficient power management solutions. (MarketsandMarkets)
What are the major growth drivers for the power electronics market?
Key growth drivers include rising adoption of electric vehicles (EVs), increasing renewable energy installations, industrial automation, smart grids, and demand for energy-efficient electronic devices. (MarketsandMarkets)
Which industry vertical dominates the power electronics market?
The Automotive & Transportation segment holds the largest market share due to growing EV adoption, stringent emission regulations, and increasing demand for advanced vehicle electronics. (MarketsandMarkets)
Which material segment leads the power electronics industry?
Silicon currently holds the largest market share because of its mature technology, cost-effectiveness, and widespread use across industrial, consumer, and energy applications. (MarketsandMarkets)
Which material is expected to witness the fastest growth?
Silicon Carbide (SiC) is projected to register the highest CAGR due to its superior thermal conductivity, higher efficiency, faster switching speeds, and suitability for EVs and renewable energy systems. (MarketsandMarkets)
Which region leads the global power electronics market?
Asia Pacific holds the largest market share and is also the fastest-growing region, supported by rapid industrialization, strong manufacturing capabilities, EV production, and renewable energy investments in China, Japan, South Korea, and India. (MarketsandMarkets)
What are the key trends shaping the power electronics market?
Major trends include adoption of wide-bandgap semiconductors such as SiC and GaN, AI-based energy optimization, smart charging infrastructure, advanced power packaging, and predictive maintenance technologies. (MarketsandMarkets)
Who are the leading companies in the power electronics market?
Key companies include Infineon Technologies AG, Texas Instruments Incorporated, onsemi, STMicroelectronics, and Analog Devices, Inc.. (MarketsandMarkets)
What is the future outlook for the power electronics industry?
The market outlook remains positive through 2030 due to accelerating electrification, renewable energy integration, industrial digitalization, and growing demand for efficient power conversion technologies across multiple industries. (MarketsandMarkets)
Need a Tailored Report?
Customize this report to your needs
Get 10% FREE Customization
Customize This ReportPersonalize This Research
- Triangulate with your Own Data
- Get Data as per your Format and Definition
- Gain a Deeper Dive on a Specific Application, Geography, Customer or Competitor
- Any level of Personalization
Let Us Help You
- What are the Known and Unknown Adjacencies Impacting the Power Electronics Market
- What will your New Revenue Sources be?
- Who will be your Top Customer; what will make them switch?
- Defend your Market Share or Win Competitors
- Get a Scorecard for Target Partners

Custom Market Research Services
We Will Customise The Research For You, In Case The Report Listed Above Does Not Meet With Your Requirements
Get 10% Free CustomisationTESTIMONIALS

Tetsuya Ohhira
Business Development Manager-Technology Business
Nikon Corporation,
Leading Japanese MNC specializing in optics and imaging productswww.nikon.com
MarketsandMarkets™ response
is quick. Their attitude is flexible and positive. Analyst Insights are globally considered and
significant. Client Services quickly respond to our inquiry and demand. Their wide range of global
surveys help us make our strategic plan.
We hope Knowledge Store will be easier to search
for a report.
VP - Marketing & Business Development
Leading Provider of Process Control Solutions
We engaged with MarketsandMarkets on a study to perform an analysis and recommend a Go-To-Market strategy for metrology and process control in the semiconductor market. The study was tailored to our targets and needs with well-defined milestones. Our overall experience with the MarketsandMarkets team was very good throughout the project in all aspects including the analysis methodologies used, the quality and depth of primary and secondary data sets, the professionalism and flexibility of the team and the ability to meet the target schedule and milestones. We want to thank MarketsandMarkets team for a job well done.
Growth opportunities and latent adjacency in Power Electronics Market


User
Sep, 2019
HI, I want to know more about power electronics business in Asia & Europe Can I have specific information about that with in this study.
Babak
May, 2020
Can someone clarify Power Electronics market in this report? Are the numbers for Power Electronics Systems or only Power Semiconductor Devices/modules?.
User
Sep, 2019
I would like to buy sections of this report - is that possible? I am interested in understanding the market for transportation application in Europe. Also, I would like to know more about the transportation market for specific countries in Europe..
User
Sep, 2019
We would like to understand the ecosystem for the power electronics market and the major product offerings of leading players in this market, Can you provide market share analysis and product offerings along with business strategies adopted by each player;.
User
Nov, 2019
We are looking into how this industry works and would like more information about the developments and future trends in power electronics market. Also, we would like to know more about the segments covered in the report and research methodology used to arrive at the market size..
User
Mar, 2019
I would like to know the inclusion and exclusion of the power electronics market report in terms of the industries covered and the type of components that are included in the report. Also, can you provide market sizing for the transportation and renewable industry?.