
High Purity Gas Market

High Purity Gas Market by Type (High Atmospheric Gas, Noble Gas, Carbon Gas, Other Gases), Storage & Distribution and Transportation, Function, Manufacturing Process, End-use Industry, and Region - Global Forecast to 2030


OVERVIEW
Source: Secondary Research, Interviews with Experts, MarketsandMarkets Analysis
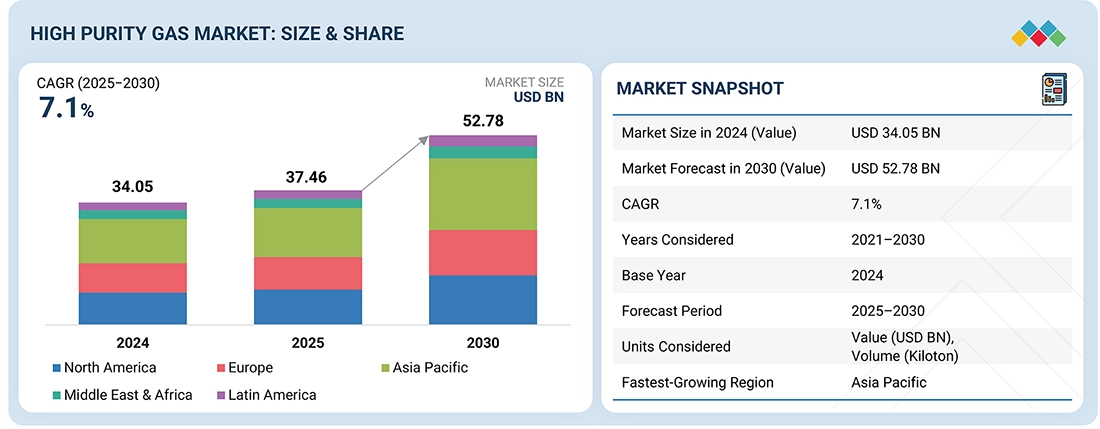
The high purity gas market is projected to grow from USD 37.46 billion in 2025 to USD 52.78 billion by 2030, registering a CAGR of 7.1% during the forecast period. Growing urbanization and applications in electronics, metal production, oil & gas, chemicals, food & beverage, and medical & healthcare industries are increasing the demand for high purity gas.
KEY TAKEAWAYS
-
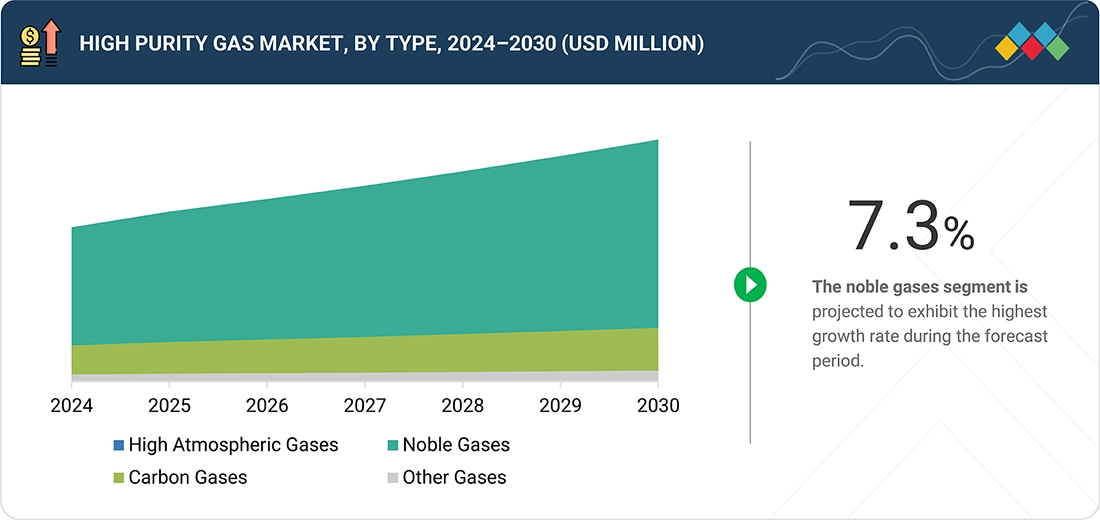
BY TYPEThe high purity gas market comprises high atmospheric gases, noble gas, carbon gas, and other gases. By type, the noble gases segment is projected to register the highest CAGR during the forecast period due to their critical use in semiconductor manufacturing, electronics, and specialty industrial applications requiring ultra-high purity and inert environments.
-
BY STORAGE & DISTRIBUTION AND TRANSPORTATIONThis segment comprises cylindered/ packaged gas, merchant liquid, and tonnage. Cylinders/packaged gas are expected to register the highest CAGR due to their flexibility, ease of handling, and suitability for small- to medium-scale industrial and laboratory applications.
-
BY MANUFACTURING PROCESSThe manufacturing processes of high purity gas market includes hydrogen production and air separation technology. Air separation technology is projected to register the higher CAGR due to its efficiency in producing large volumes of ultra-high purity gases for diverse industrial and electronic applications.
-
BY FUNCTIONBased on function, the high purity gas market is segmented into insulation, Illumination, and coolants. Insulation is projected to register the highest CAGR in the overall high purity gas market due to its critical role in maintaining gas purity and stability during storage and transport.
-
BY END-USE INDUSTRYBased on end-use industry, the high purity gas market is segmented into electronics, metal production, chemicals, oil & gas, medical & healthcare, food & beverages, and other end-use industries. The electronics industry is projected to register the highest CAGR in the high purity gas market due to rising demand for semiconductors, displays, and advanced electronic components requiring ultra-high purity gases.
-
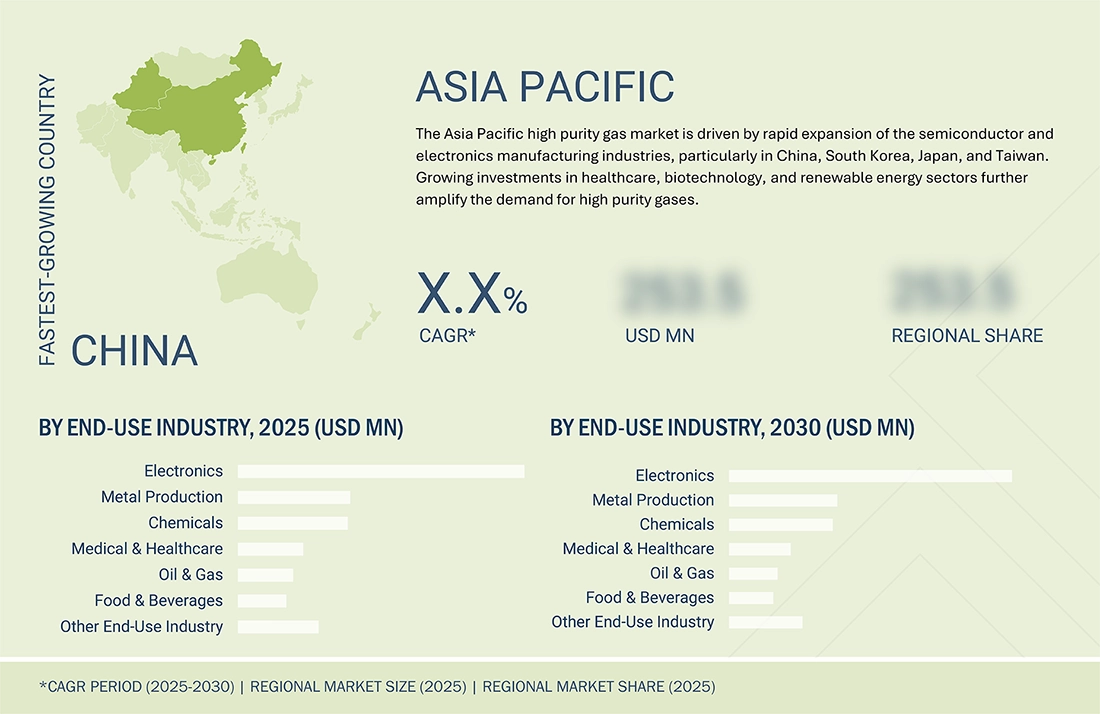
BY REGIONThe high purity gas market covers Europe, North America, Asia Pacific, Latin America, and the Middle East & Africa. Asia Pacific is projected to register the highest CAGR in the high purity gas market due to the rapid growth in semiconductor manufacturing, electronics, and pharmaceutical industries across China, Japan, South Korea, and India.
-
COMPETITIVE LANDSCAPEMajor market players have adopted both organic and inorganic strategies, including partnerships and investments. For instance, Air Liquide (France) and Linde Plc (Ireland) have entered into a number of agreements and partnerships to cater to the growing demand for high purity gas across innovative applications.
High purity gas refers to the gas produced, handled, and used with extremely low levels of impurities. This type of gas is typically used in applications where purity and precision are critical, such as in semiconductor manufacturing, pharmaceutical manufacturing, and laboratory research. High purity and ultra-high purity gas are used for specialized functions in manufacturing processes across multiple industries. The purity of this gas ranges from 99.95% to 99.999%. It is used in various end-use segments to reduce operational and production costs, improve the quality of the overall yield, and optimize the performance of other operations and industrial procedures. High purity gas comprises atmospheric gas, noble gas, carbon gas, and other types of gas such as fluorine, chlorine, and bromine.
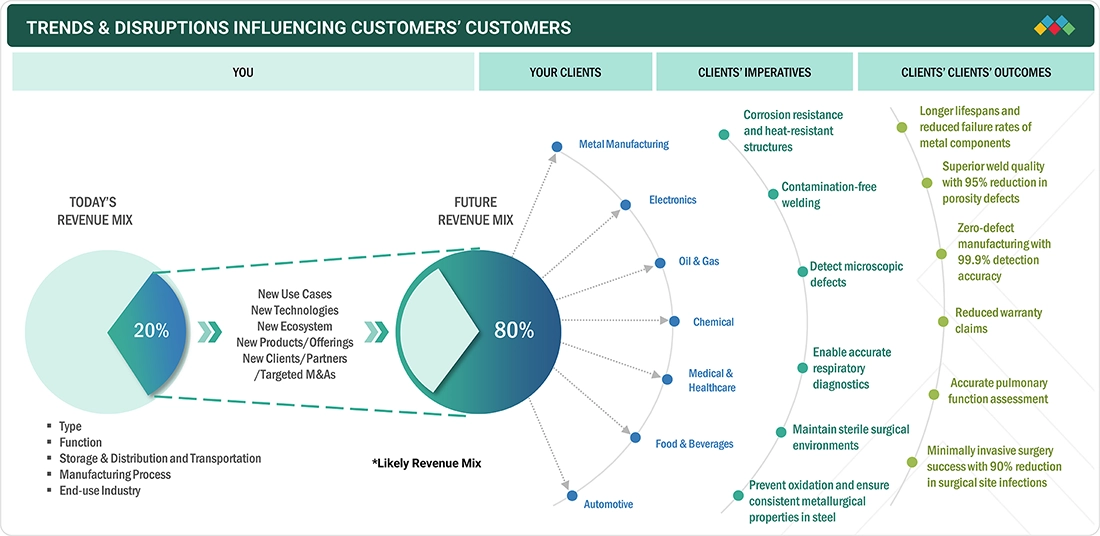
TRENDS & DISRUPTIONS IMPACTING CUSTOMERS' CUSTOMERS
Changes in customer trends or disruptions affect consumers' businesses. These shifts influence the revenues of end users. As a result, the revenue changes for end users are likely to impact the revenues of high purity gas suppliers, which in turn, affect the revenues of high purity gas manufacturers.
Source: Secondary Research, Interviews with Experts, MarketsandMarkets Analysis
MARKET DYNAMICS
Level
-
Rising demand for solar photovoltaic panels

-
Increasing demand from electronics industry

Level
-
High cost of gas processing

-
Stringent regulatory environment

Level
-
Growing demand from chemical and automotive industries

-
Rising applications in medical and pharmaceutical sector

Level
-
Technological disruptions

-
Production and supply chain complexities

Source: Secondary Research, Interviews with Experts, MarketsandMarkets Analysis
Driver: Increasing demand from electronics industry
The sale of consumer electronics, household appliances, mobiles, and smart appliances, including smart home devices, appliances, wearables, tablets, laptops, and smartphones, has increased significantly over the years. This has increased the demand for electronic components. As technology advances, electronics become increasingly complex and miniaturized. High purity gas is critical for the precise control needed in the advanced manufacturing processes for electronics. Electronic component and equipment manufacturers often invest heavily in research and development activities, which frequently involve the use of high purity gas for the development of new materials and technologies, further driving the demand for high purity gas. As the electronics industry demands standard quality and efficiency in the end product, the use of high purity gas becomes absolutely necessary to prevent any impurities and defects in sensitive manufacturing processes. The development and expansion of high-tech manufacturing facilities for electronics, including clean rooms and specialized production environments, rely heavily on high purity gas to maintain the necessary conditions for production. As the electronics industry expands, especially in emerging markets, the need for consistent and high purity gas supplies is expected to increase.
Restraint: High cost of gas processing
The high cost of the production of high purity gas will restrain the market growth during the forecast period. The production of high purity gas involves the use of specialized machines, technologies, and infrastructure, like air separation units, high-precision filters, reactors, and large storage tanks. Such equipment and technologies are expensive to acquire, maintain, and operate, adding to the overall expense of producing high purity gas. Moreover, achieving high purity levels (from 99.95% to 99.9999%) requires advanced purification processes and technologies. These processes, such as pressure swing adsorption, cryogenic distillation, and membrane separation, are technologically complex and expensive to apply, execute, and maintain.
Opportunity: Growing demand from chemical and automotive industries
High purity gas is crucial for performing precise and controlled chemical reactions in the chemical industry and laboratory research activities. It ensures the quality and consistency of the products and the reactions involved by minimizing impurities that could affect the outcome of chemical processes. High purity nitrogen, oxygen, hydrogen, argon, and carbon dioxide are used in many chemical processes to act as catalysts and reactants. For example, high purity nitrogen is used for inert atmospheres, and high purity hydrogen is used for hydrogenation reactions. Owing to technological advancements and research & development activities by major industry players, the chemicals industry is expanding its production of high-performance and specialty chemicals, which require high purity gas to meet industry regulations.
Challenge: Technological disruptions
Although there is no substitute to replace high purity gas applications in end-use industries currently, development and advances in alternative technologies may provide possible substitutes for processes that traditionally rely on high purity gas. New materials and methods in biotechnology or nanotechnology may require stringent purity levels in the gases used, impacting the demand for high purity gas in applications and manufacturing processes. New processes or equipment that improve operational efficiency or reduce costs may render traditional high purity gas functions and applications less relevant, impacting sales and market dynamics. Many companies are relying on increased automation in manufacturing processes, which helps streamline processes and reduce the need for certain high purity gases, leading to lower consumption of these gases.
High Purity Gas Market: COMMERCIAL USE CASES ACROSS INDUSTRIES
| COMPANY | USE CASE DESCRIPTION | BENEFITS |
|---|---|---|
 |
Intel uses ultra-high purity gases (99.9999% purity) in semiconductor fabrication at facilities like Fab 34 in Ireland. It utilizes nitrogen for inerting and purging silicon wafers, hydrogen for reduction processes, and argon for sputtering applications. Its USD 18.5 billion facility consumes up to 50,000 cubic meters of nitrogen per hour during production. | Facilitates the production of advanced semiconductor nodes at 5nm and smaller; Supports precise chemical vapor deposition and etching processes |
 |
Mayo Clinic uses medical-grade oxygen (>99.5% purity) for hyperbaric oxygen therapy and critical care applications. Patients breathe 100% pure oxygen in pressurized chambers to treat conditions like carbon monoxide poisoning, diabetic wounds, and radiation tissue damage. The clinic maintains strict FDA compliance for pharmaceutical-grade oxygen. | Speeds up wound healing by 300% through improved oxygen delivery; Addresses hypoxemia and increases blood oxygen saturation to over 95% |
 |
Boeing employs ultra-high purity nitrogen in composite wing manufacturing for the 777X aircraft. Air Products installed a specialized nitrogen system with three 15,000-gallon liquid tanks to create inert atmospheres in the world's largest autoclave. | Produces defect-free composite wings that are 30% lighter than metallic structures and prevents oxidation during wing curing processes, which cost over USD 50 million |
Logos and trademarks shown above are the property of their respective owners. Their use here is for informational and illustrative purposes only.
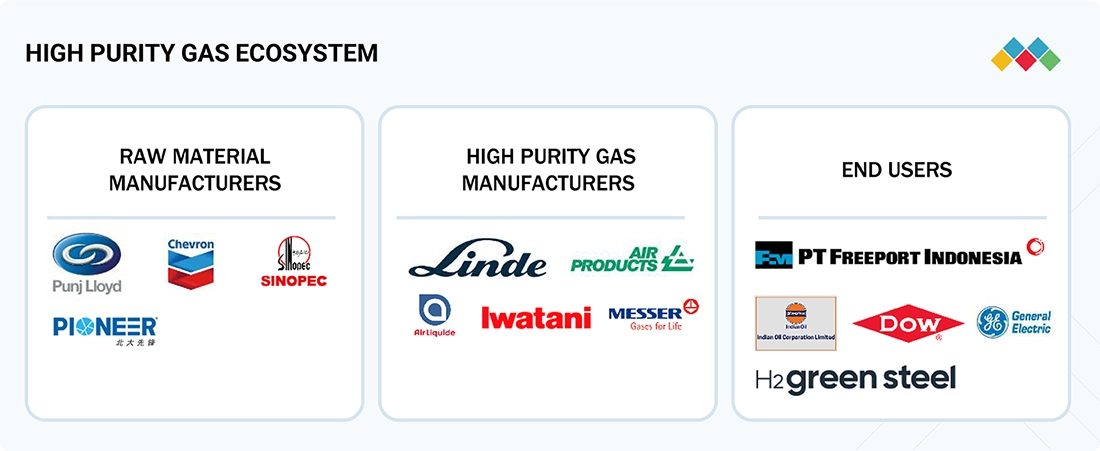
MARKET ECOSYSTEM
The high purity gas market ecosystem consists of raw material suppliers (Chevron Corporation, Sinopec), high purity gas manufacturers (Air Liquide, Linde Plc), distributors (Greco Gas, Maharashtra Gas Co.), and end users (General Electric, Dow). The raw material suppliers provide materials like fuel, natural gas, and air separation units. The distributors and suppliers establish contact between the manufacturing companies and end users to streamline the supply chain, increasing operational efficiency and profitability.
Logos and trademarks shown above are the property of their respective owners. Their use here is for informational and illustrative purposes only.
MARKET SEGMENTS
Source: Secondary Research, Interviews with Experts, MarketsandMarkets Analysis
High Purity Gas Market, By Type
High purity noble gases such as helium, argon, and neon are extensively used in the manufacturing processes of semiconductors, like gas spectroscopy and gas chromatography. The inert nature of high purity noble gases prevents contamination during manufacturing, which is extremely necessary to produce efficient and reliable electronic components. High purity helium is used for anesthesia and cryogenics in the medical & healthcare industry. The unique properties of the gas, including low boiling point and inertness, make them suitable for various medical applications. Ongoing research activities for the possible applications of high purity noble gas across various scientific fields contribute to their growing demand in end-use industries.
High Purity Gas Market, By Storage & Distribution and Transportation
The cylinders/packaged gas method is used extensively in the high purity gas industry due to its convenient and efficient nature. Cylinders/packaged gas have a design that makes them convenient and safe for handling, making them suitable for use in end-use industries like food & beverage, medical & healthcare, electronics, and oil & gas, wherein ease of mobility and accessibility are critical. Cylinders can be used to store and transport a variety of gases, including toxic, flammable, and inert gases, which broadens their application across end-use industries like manufacturing, healthcare, and food processing.
High Purity Gas Market, By Manufacturing Process
Air separation technology is a favored method for the production of high purity gas as it is known to achieve very high purity levels (99.95% to 99.9999%) for high purity oxygen and nitrogen. Achieving these levels of purity is critical for applications in the electronics, food & beverage, and medical & healthcare industries, where product quality may be significantly affected by negligible contaminants. Over the years, air separation technology has evolved and developed in such a way that it has now become highly automated, which enhances consistency and reliability in gas production. Automated systems reduce the chances of human error and ensure that the gases produced meet the purity specifications. For end-use industries whose operations depend on precise compositions of high purity gas, this reliability is essential.
High Purity Gas Market, By Function
The insulation segment is projected to register the highest CAGR in the high purity gas market during the forecast period due to the growing electronics industry, where the insulation function is extensively used. High purity gases are essential in enhancing the thermal and electrical properties used in electronic manufacturing. Continuous innovations in insulation technologies that incorporate high purity gas contribute to the growing market size. Improved and enhanced insulating materials increase energy efficiency and performance, making them increasingly attractive to producers in various end-use industries.
High Purity Gas Market, By End-use Industry
The electronics industry is rapidly growing and holds a considerable share of the high purity gas market due to various influencing factors. High purity gas is heavily used in the production of semiconductors and electronics. The manufacturing process of semiconductors requires high purity nitrogen, argon, hydrogen, and oxygen to prevent contamination that may compromise the efficiency and reliability of electronic devices. Advancements in technologies such as artificial intelligence (AI), Internet of Things (IoT), and 5G have increased the demand for high purity gas, as they are used in different applications in the manufacturing processes of electronics like deposition, cleaning, and etching.
REGION
Asia Pacific to be fastest-growing region in global high purity gas market during forecast period
Asia Pacific is projected to register the highest CAGR in the high purity gas market during the forecast period. Factors such as rising urbanization and industrialization, coupled with significant expenditure in the electronics sector, are the primary drivers for market growth. The region is also experiencing high demand from the metal production, chemicals, medical & healthcare, and food & beverage industries, further propelling the high purity gas market. While China remains a dominant player in the global market, other Asia Pacific countries like India, Japan, and Australia attract foreign investments in the region’s high purity gas market. Since these countries are expanding their production capacities in electronics, chemicals, and food & beverage industries, the requirement of high purity gas meeting strict purity requirements has grown.
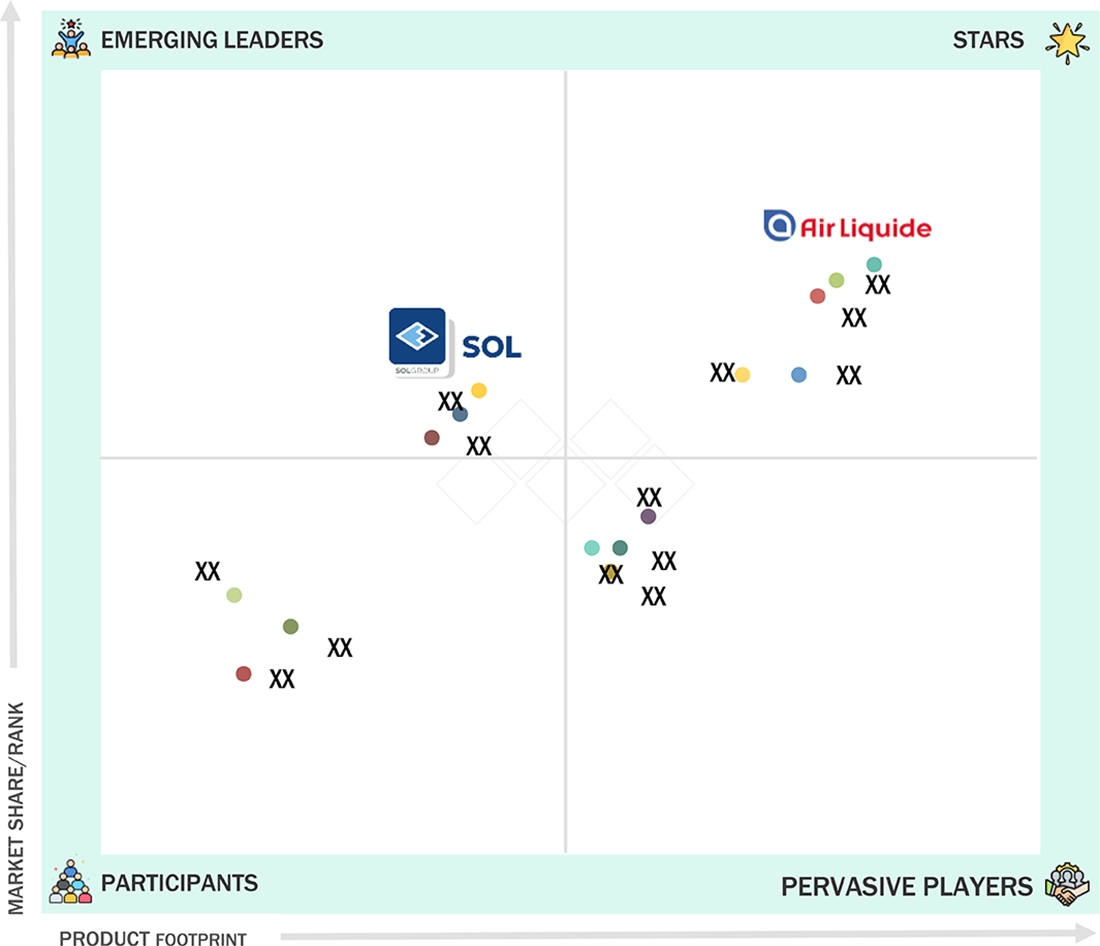
High Purity Gas Market: COMPANY EVALUATION MATRIX
In the high purity gas market, Air Liquide (Star) leads with a strong market share and extensive product footprint, driven by its collaborations and partnerships with end users. SOL Spa (Emerging Leader) is emerging as a promising player, leveraging regional expansion, innovative gas solutions, and strategic partnerships to gradually strengthen its footprint in the high purity gas market. While Air Liquide dominates through scale and a diverse portfolio, SOL Spa shows significant potential to move toward the leaders’ quadrant as demand for high purity gas continues to rise.
Source: Secondary Research, Interviews with Experts, MarketsandMarkets Analysis
KEY MARKET PLAYERS
MARKET SCOPE
| REPORT METRIC | DETAILS |
|---|---|
| Market Size in 2025 (Value) | USD 37.46 Billion |
| Market Forecast in 2030 (value) | USD 52.78 Billion |
| Growth Rate | CAGR of 7.1% from 2025 to 2030 |
| Years Considered | 2021-2030 |
| Base Year | 2024 |
| Forecast Period | 2025-2030 |
| Units Considered | Value (USD Million/Billion), Volume (Kiloton) |
| Report Coverage | Revenue forecast, company ranking, competitive landscape, growth factors, and trends |
| Segments Covered |
|
| Regions Covered | North America, Asia Pacific, Europe, Latin America, Middle East & Africa |
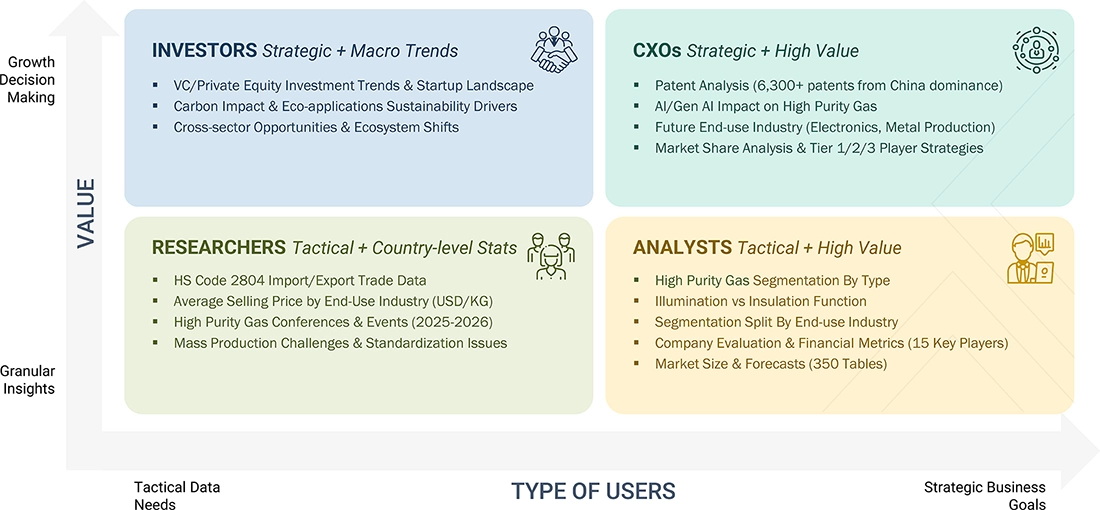
WHAT IS IN IT FOR YOU: High Purity Gas Market REPORT CONTENT GUIDE
DELIVERED CUSTOMIZATIONS
We have successfully delivered the following deep-dive customizations:
| CLIENT REQUEST | CUSTOMIZATION DELIVERED | VALUE ADDS |
|---|---|---|
| Raw Material Supplier |
|
|
| High Purity Gas Manufacturer |
|
|
| End User |
|
|
| Distributor/ Trader |
|
|
RECENT DEVELOPMENTS
- June 2025 : Linde signed a long-term deal to supply industrial gases to Blue Point Number One’s 1.4 million metric tons low-carbon ammonia plant in Ascension Parish, Louisiana, a joint venture between CF Industries, JERA, and Mitsui & Co.
- April 2025 : Linde signed an agreement with Samsung to expand supply of ultra-high-purity gases to its Pyeongtaek semiconductor complex, including construction of an eighth on-site air separation unit and hydrogen supply from existing facilities starting mid-2026.
- August 2025 : Air Products completed the first fill of NASA’s new hydrogen sphere at Kennedy Space Center, the world’s largest liquid hydrogen tank. Over 730,000 gallons were delivered to support Artemis missions, which will return humans to the Moon and establish a long-term presence there.
- July 2025 : SOL Spa has finalized three acquisitions in Europe: it has acquired 70% of the Italian medical equipment company Berman s.r.l., 100% of the German technical gases company Freyco, and 100% of the Swiss home care company CSaiR Sàrl.
Table of Contents
 Exclusive indicates content/data unique to MarketsandMarkets and not available with any competitors.
Methodology
The study involves two major activities in estimating the current market size for the high purity gas market. Exhaustive secondary research was done to collect information on the market, peer market, and parent market. The next step was to validate these findings, assumptions, and sizing with industry experts across the value chain through primary research. Both top-down and bottom-up approaches were employed to estimate the complete market size. After that, market breakdown and data triangulation were used to estimate the market size of segments and subsegments.
Secondary Research
Secondary sources referred to for this research study include financial statements of companies offering high purity gas and information from various trade, business, and professional associations. Secondary research has been used to obtain critical information about the industry’s value chain, the total pool of key players, market classification, and segmentation according to industry trends to the bottom-most level and regional markets. secondary data was collected and analyzed to arrive at the overall size of the high purity gas market, which was validated by primary respondents.
Primary Research
Extensive primary research was conducted after obtaining information regarding the high purity gas market scenario through secondary research. Several primary interviews were conducted with market experts from both the demand and supply sides across major countries of North America, Europe, Asia Pacific, the Middle East & Africa, and Latin America. Primary data was collected through questionnaires, emails, and telephonic interviews. The primary sources from the supply side included various industry experts, such as Chief X Officers (CXOs), Vice Presidents (VPs), Directors from business development, marketing, product development/innovation teams, and related key executives from high purity gas industry vendors; system integrators; component providers; distributors; and key opinion leaders.
Primary interviews were conducted to gather insights such as market statistics, data on revenue collected from the products and services, market breakdowns, market size estimations, market forecasting, and data triangulation. Primary research also helped in understanding the various trends related to type, storage & distribution and transportation, manufacturing process, function, end-use industry, and region.
Stakeholders from the demand side, such as CIOs, CTOs, CSOs, and installation teams of the customer/end users who are using high purity gas, were interviewed to understand the buyer’s perspective on the suppliers, products, component providers, and their current usage of high purity gases and future outlook of their business which will affect the overall market.

Source: Secondary Research, Interviews with Experts, MarketsandMarkets Analysis
Market Size Estimation
The research methodology used to estimate the size of the high purity gas market includes the following details. The sizing of the market was undertaken from the demand side. The market was upsized based on procurements and modernizations in high purity gases in different end-use industries at a regional level. Such procurements provide information on the demand aspects of the high purity gas industry for each application. For each application, all possible segments of the high purity gas market were integrated and mapped.
Top-Down and Bottom-Up Approach

Source: Secondary Research, Interviews with Experts, MarketsandMarkets Analysis
Data Triangulation
After arriving at the overall size from the market size estimation process explained above, the total market was split into several segments and subsegments. The data triangulation and market breakdown procedures explained below were implemented, wherever applicable, to complete the overall market engineering process and arrive at the exact statistics for various market segments and subsegments. The data was triangulated by studying various factors and trends from the demand and supply sides. Along with this, the market size was validated using both the top-down and bottom-up approaches.
Market Definition
High purity gases refer to the gases that are produced, handled, and used with extremely low levels of contaminants. These gases are typically used in applications where precision and purity are critical, such as in semiconductor manufacturing, pharmaceuticals, and scientific research. High purity/ultra high purity gases are those gases which are used for specialized applications such as manufacturing semiconductor devices and flat-panel displays. The purity of these gases ranges from 99.998% to 99.999%. They are used in various end-user segments to improve overall yield, reduce operational cost, and to optimize performance of various industrial or other operations. These gases include atmospheric gases, noble gases, carbon gases, and other gases (fluorine, chlorine, and bromine).
Stakeholders
- High purity gas manufacturers
- Government and research organizations
- National and local government organizations
- Institutional investors
- European High Purity Gases Association
- US Oil & Gas Association
Report Objectives
- To define, describe, and forecast the high purity gas market size in terms of volume and value
- To provide detailed information regarding the key factors, such as drivers, restraints, opportunities, and challenges influencing the market growth
- To analyze and project the global high purity gas market by type, by storage & distribution and transportation, by manufacturing process, by function, end-use industry, and region
- To forecast the market size concerning five main regions (along with country-level data), namely, North America, Europe, Asia Pacific, Latin America, and the Middle East & Africa, and analyze the significant region-specific trends
- To strategically analyze micromarkets with respect to individual growth trends, prospects, and contributions of the submarkets to the overall market
- To analyze the market opportunities and the competitive landscape for stakeholders and market leaders
- To assess recent market developments and competitive strategies, such as agreements, contracts, acquisitions, and new product developments/new product launches, to draw the competitive landscape
- To strategically profile the key market players and comprehensively analyze their core competencies
Geographic Analysis
- Further breakup of the Asia Pacific market into countries contributing to the rest of the regional market size
- Further breakup of the North American market into countries contributing to the rest of the regional market size
- Further breakup of the Latin American market into countries contributing to the rest of the regional market size
- Further breakup of the Middle East & African market into countries contributing to the rest of the regional market size
- Further breakup of the European market into countries contributing to the rest of the regional market size
Need a Tailored Report?
Customize this report to your needs
Get 10% FREE Customization
Customize This ReportPersonalize This Research
- Triangulate with your Own Data
- Get Data as per your Format and Definition
- Gain a Deeper Dive on a Specific Application, Geography, Customer or Competitor
- Any level of Personalization
Let Us Help You
- What are the Known and Unknown Adjacencies Impacting the High Purity Gas Market
- What will your New Revenue Sources be?
- Who will be your Top Customer; what will make them switch?
- Defend your Market Share or Win Competitors
- Get a Scorecard for Target Partners

Custom Market Research Services
We Will Customise The Research For You, In Case The Report Listed Above Does Not Meet With Your Requirements
Get 10% Free Customisation


Growth opportunities and latent adjacency in High Purity Gas Market