Argon Gas Market by End-Use Industry (Metal Manufacturing & fabrication, Chemicals), Storage, Distribution & Transportation(Cylinder & packaged gas, Merchant liquid), Mixture (Ar-CO2, Ar-O2), Function (Insulation) & Region - Global Forecast to 2020


[226 Pages Report] The increasing demand in various applications such as metal fabrication, electronics, energy, automotive, lighting, and healthcare is the major factor driving the growth of the argon gas industry. Additionally, with rapid urbanization, growth in infrastructural activities, and increasing industrialization across the globe, there is a rapidly increasing need for argon gas. The argon gas market was valued at USD 273.7 Million in 2014, and is projected to grow at a CAGR of 4.92% from 2015 to 2020. The merchant liquid/bulk segment is the fastest-growing, by storage, distribution & transportation in the argon gas market. The Asia-Pacific market is projected to grow at the highest rate. In terms of end-use industry, the metal manufacturing & fabrication sector is the fastest-growing segment, followed by the chemicals sector.
This report provides an analysis of key companies and a competitive analysis of developments recorded in the industry in the last five years. Market drivers, restraints, opportunities, and challenges have also been discussed in detail. Leading players of the market which include Praxair Inc. (U.S.), Air Liquide S.A. (France), The Linde Group (Germany), Airgas Inc. (U.S.), Matheson Tri-Gas Inc. (U.S.), Air Products and Chemicals Inc. (U.S.), and Iwatani Corporation (Japan) have been profiled to provide an insight into the competitive scenario in the market.
Scope of the report
This research categorizes the argon gas market based on end-use industry; storage, distribution & transportation; mixture; function; and region.
On the basis of end-use industry, the argon gas market has been segmented as follows:
- Metal manufacturing & fabrication
- Chemicals
- Energy
- Healthcare
- Electronics
- Food & beverage
- Others (scuba diving, automotive & transportation equipment)
On the basis of storage, distribution & transportation, the argon gas market has been segmented as follows:
- Cylinder & packaged gas
- Merchant liquid/bulk
- Tonnage
On the basis of mixture, the argon gas market has been segmented as follows:
- Argon-carbon dioxide
- Argon-oxygen
- Argon-Helium
- Argon-Hydrogen
- Others (argon-helium-carbon dioxide mixtures)
On the basis of function, the argon gas market has been segmented as follows:
- Insulation
- Illumination
- Cooling
On the basis of region, the argon gas market has been segmented as follows:
- Asia-Pacific
- Europe
- North America
- Rest of the World (RoW)
The argon gas market is projected to reach USD 362.9 Million by 2020, with a projected CAGR of 4.92% from 2015 to 2020. Growth in infrastructure, technological developments, and rapid urbanization has fueled the growth for the argon gas market. The metal manufacturing & fabrication sector is the largest end-use industry for argon gas, especially in emerging markets such as China, Brazil, and India.
The argon gas market depends on various players who provide technological solutions for manufacturing and storage, distribution, and transportation of eco-friendly argon gas. The market is dominated by key players such as Praxair Inc. (U.S.), Air Liquide S.A. (France), The Linde Group (Germany), Messer Group GmbH (Germany), Airgas Inc. (U.S.), Matheson Tri-Gas Inc. (U.S.), Air Products and Chemicals Inc. (U.S.), Advanced Specialty Gases Inc. (U.S.) and Iwatani Corporation (Japan).
The metal manufacturing & fabrication end-use industry segment is projected to grow at the highest CAGR of 5.61% from 2015 to 2020. The key players of the argon gas market implement different strategies such as expansions & investments, new product launches, agreements, partnerships, contracts, and joint ventures to gain a larger share in the market.
The argon gas market is a highly fragmented one. Major companies rely on regional and local distributors to increase their share as well as geographical presence in the market. One of the major developments observed in the argon gas market is expansions & investments. Companies are adopting inorganic growth strategies such as acquisitions to cope with the increasing demand for argon gas in emerging markets. These strategies have aided companies to create a large customer and partner base in these markets.
 Exclusive indicates content/data unique to MarketsandMarkets and not available with any competitors.
Table of Contents
1 Introduction (Page No. - 19)
1.1 Objectives of the Study
1.2 Market Definition
1.3 Study Scope
1.3.1 Periodization Considered for the Argon Gas Market
1.4 Currency Considered for the Argon Gas Market
1.5 Unit Considered for the Argon Gas Market
1.6 Stakeholders
2 Research Methodology (Page No. - 23)
2.1 Research Data
2.1.1 Secondary Data
2.1.1.1 Key Data From Secondary Sources
2.1.2 Primary Data
2.1.2.1 Key Data From Primary Sources
2.1.2.2 Breakdown of Primary Interviews
2.2 Factor Analysis
2.2.1 Introduction
2.2.2 Demand-Side Analysis
2.2.2.1 Rising Population
2.2.2.2 Increasing Income and Spending Capacity
2.2.2.3 Industrialization
2.2.3 Supply-Side Analysis
2.2.3.1 Industry Regulations
2.2.3.2 Fluctuations in Fuel Prices
2.3 Market Size Estimation
2.4 Market Breakdown and Data Triangulation
2.5 Market Share Estimation
2.6 Research Assumptions and Limitations
2.6.1 Assumptions
2.6.2 Assumptions Made for This Study
2.6.3 Limitations
3 Executive Summary (Page No. - 38)
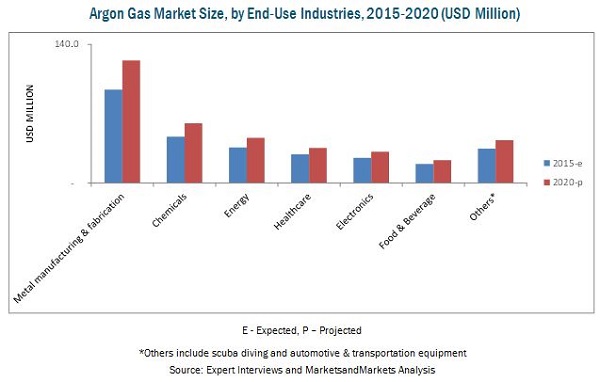
3.1 Metal Manufacturing & Fabrication is Projected to Account for the Largest Share By 2020
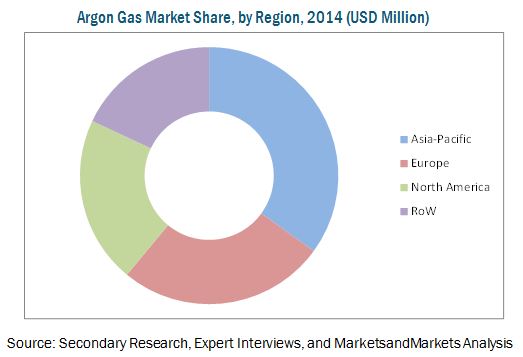
3.2 Asia-Pacific is Projected to Dominate the Global Argon Gas Market By 2020
3.3 Brazil is Projected to Have the Highest CAGR From 2015 to 2020
4 Premium Insights (Page No. - 44)
4.1 Attractive Market Opportunities in the Argon Gas Market
4.2 Argon Gas Market in the Asia-Pacific Region
4.3 Emerging vs Developed Markets for Argon Gas, 2015 to 2020
5 Market Overview (Page No. - 50)
5.1 Introduction
5.2 Market Evolution
5.3 Production Process of Argon Gas
5.3.1 Introduction
5.3.2 Cryogenic Industrial Gas Process
5.4 Market Dynamics
6 Industry Trends (Page No. - 61)
6.1 Introduction
6.2 Value Chain
6.3 Porter�s Five Forces Analysis
6.3.1 Threat of New Entrants
6.3.2 Threats of Substitutes
6.3.3 Bargaining Power of Suppliers
6.3.4 Bargaining Power of Buyers
6.3.5 Intensity of Competitive Rivalry
7 Argon Gas Market, By End-Use Industry (Page No. - 67)
7.1 Introduction
7.2 Metal Manufacturing & Fabrication
7.3 Food & Beverages
7.4 Healthcare
7.5 Energy
7.6 Chemicals
7.7 Electronics
7.8 Others
8 Argon Gas Market, By Storage, Distribution & Transportation (Page No. - 72)
8.1 Introduction
8.2 Cylinders & Packaged Gas
8.3 Merchant Liquid/Bulk
8.4 Tonnage
9 Argon Gas Market, By Mixture (Page No. - 77)
9.1 Introduction
9.2 Argon-Carbon Dioxide
9.3 Argon-Oxygen
9.4 Argon-Helium
9.5 Argon-Hydrogen
9.6 Other Mixtures
10 Argon Gas Market, By Function (Page No. - 87)
10.1 Introduction
10.2 Insulation
10.3 Illumination
10.4 Cooling
11 Argon Gas Market, By Region (Page No. - 91)
11.1 Introduction
11.2 Global Industrial Gases Data Analysis
11.3 Asia-Pacific
11.3.1 China
11.3.2 India
11.3.3 South Korea
11.3.4 Japan
11.3.5 Rest of Asia-Pacific
11.4 North America
11.4.1 U.S.
11.4.2 Canada
11.4.3 Mexico
11.5 Europe
11.5.1 Germany
11.5.2 France
11.5.3 Belgium
11.5.4 U.K.
11.5.5 Rest of Europe
11.6 Rest of the World (RoW)
11.6.1 Brazil
11.6.2 South Africa
11.6.3 Saudi Arabia
11.6.4 Other RoW Countries
12 Competitive Landscape (Page No. - 177)
12.1 Overview
12.2 Development Analysis
12.3 Competitive Situations & Trends
12.4 Key Growth Strategies, 2011�2015
12.4.1 Expansions
12.4.2 Agreements, Partnerships, Contracts & Joint Ventures, 2011-2015
12.4.3 Mergers & Acquisitions
12.4.4 New Product Launches
13 Company Profiles (Page No. - 187)
13.1 Introduction
13.2 Air Liquide S.A.
13.2.1 Business Overview
13.2.2 Products Offered
13.2.3 Recent Developments
13.2.4 MnM View
13.2.4.1 SWOT Analysis
13.3 Air Products and Chemicals, Inc.
13.3.1 Business Overview
13.3.2 Products Offered
13.3.3 Recent Developments
13.3.4 MnM View
13.3.4.1 SWOT Analysis
13.4 Iwatani Corporation
13.4.1 Business Overview
13.4.2 Products Offered
13.4.3 Recent Developments
13.5 Praxair Inc.
13.5.1 Business Overview
13.5.2 197
13.5.3 Products Offered
13.5.4 Recent Developments
13.5.5 SWOT Analysis
13.5.6 MnM View
13.6 The Linde Group
13.6.1 Business Overview
13.6.2 Products Offered
13.6.3 Recent Developments
13.6.4 SWOT Analysis
13.6.5 MnM View
13.7 Advanced Specialty Gases Inc.
13.7.1 Business Overview
13.7.2 Products Offered
13.8 Airgas Inc
13.8.1 Business Overview
13.8.2 Products Offered
13.8.3 Recent Developments
13.8.4 SWOT Analysis
13.8.5 MnM View
13.9 Messer Group
13.9.1 Business Overview
13.9.2 Products Offered
13.9.3 Recent Developments
13.10 Matheson Tri-Gas Inc.
13.10.1 Business Overview
13.10.2 Products Offered
13.10.3 Recent Developments
13.11 Iceblick Ltd.
13.11.1 Business Overview
13.11.2 Products Offered
14 Appendix (Page No. - 217)
14.1 Insights of Industry Experts
14.2 Discussion Guide
14.3 Company Developments
14.3.1 Agreements, Partnerships, Contracts & Joint Ventures
14.3.2 New Product Launches
14.3.3 Expansions
14.3.4 Mergers & Acquisitions
14.4 Introducing RT: Real-Time Market Intelligence
14.5 Available Customizations
List of Tables (161 Tables)
Table 1 Regulation for Argon Gas Storage, Distribution & Transportation
Table 2 Composition of Dry Air
Table 3 Argon Gas Market Size, By End-Use Industry, 2013�2020 (USD Million)
Table 4 Argon Gas Market Size, By End-Use Industry, 2013�2020 (Thousand Tons)
Table 5 Regulations on Transportation and Storage of Gas Cylinders
Table 6 Argon Gas Market Size, By Storage, Distribution & Transportation, 2013�2020 (USD Million)
Table 7 Argon Gas Market Size, By Storage, Distribution & Transportation, 2013�2020 (Thousand Tons)
Table 8 Argon Gas Market Size, By Mixture, 2013�2020 (USD Million)
Table 9 Argon Gas Market Size, By Mixture, 2013�2020 (Thousand Tons)
Table 10 Argon-Carbon Dioxide Market Size, By Application, 2013�2020 (USD Million)
Table 11 Argon-Carbon Dioxide Market Size, By Application, 2013�2020 (Thousand Tons)
Table 12 Argon-Oxygen Market Size, By Application, 2013�2020 (USD Million)
Table 13 Argon-Oxygen Market Size, By Application, 2013�2020 (Thousand Tons)
Table 14 Argon-Helium Market Size, By Application, 2013�2020 (USD Million)
Table 15 Argon-Helium Market Size, By Application, 2013�2020 (Thousand Tons)
Table 16 Argon-Hydrogen Market Size, By Application, 2013�2020 (USD Million)
Table 17 Argon-Hydrogen Market Size, By Application, 2013�2020 (Thousand Tons)
Table 18 Other Mixtures Market Size, By Application, 2013�2020 (USD Million)
Table 19 Other Mixtures Market Size, By Application, 2013�2020 (Thousand Tons)
Table 20 Argon Gas Market Size, By Function, 2013�2020 (USD Million)
Table 21 Argon Gas Market Size, By Function, 2013�2020 (Thousand Tons)
Table 22 Argon Gas Market Size, By Region, 2013�2020 (USD Million)
Table 23 Argon Gas Market Size, By Region, 2013�2020 (Thousand Tons)
Table 24 Asia-Pacific: Argon Gas Market Size, By Country, 2013�2020 (USD Million)
Table 25 Asia-Pacific: Argon Gas Market Size, By Country, 2013�2020 (Thousand Tons)
Table 26 Asia-Pacific: Argon Gas Market Size, By End-Use Industry, 2013�2020 (USD Million)
Table 27 Asia-Pacific: Argon Gas Market Size, By End-Use Industry, 2013�2020 (Thousand Tons)
Table 28 Asia-Pacific: Argon Gas Market Size, By Storage, Distribution & Transportation, 2013�2020 (USD Million)
Table 29 Asia-Pacific: Argon Gas Market Size, By Storage, Distribution & Transportation, 2013�2020 (Thousand Tons)
Table 30 Asia-Pacific: Argon Gas Market Size, By Mixture, 2013�2020 (USD Million)
Table 31 Asia-Pacific: Argon Gas Market Size, By Mixture, 2013�2020 (Thousand Tons)
Table 32 China: Argon Gas Market Size, By End-Use Industry, 2013�2020 (USD Million)
Table 33 China: Argon Gas Market Size, By End-Use Industry, 2013�2020 (Thousand Tons)
Table 34 China: Argon Gas Market Size, By Storage, Distribution & Transportation, 2013�2020 (USD Million)
Table 35 China: Argon Gas Market Size, By Storage, Distribution & Transportation, 2013�2020 (Thousand Tons)
Table 36 China: Argon Gas Market Size, By Mixture, 2013�2020 (USD Million)
Table 37 China: Argon Gas Market Size, By Mixture, 2013�2020 (Thousand Tons)
Table 38 India: Argon Gas Market Size, By End-Use Industry, 2013�2020 (USD Million)
Table 39 India: Argon Gas Market Size, By End-Use Industry, 2013�2020 (Thousand Tons)
Table 40 India: Argon Gas Market Size, By Storage, Distribution & Transportation, 2013�2020 (USD Million)
Table 41 India: Argon Gas Market Size, By Storage, Distribution & Transportation, 2013�2020 (Thousand Tons)
Table 42 India: Argon Gas Market Size, By Mixture, 2013�2020 (USD Million)
Table 43 India: Argon Gas Market Size, By Mixture, 2013�2020 (Thousand Tons)
Table 44 South Korea: Argon Gas Market Size, By End-Use Industry, 2013�2020 (USD Million)
Table 45 South Korea: Argon Gas Market Size, By End-Use Industry, 2013�2020 (Thousand Tons)
Table 46 South Korea: Argon Gas Market Size, By Storage, Distribution & Transportation, 2013�2020 (USD Million)
Table 47 South Korea: Argon Gas Market Size, By Storage, Distribution & Transportation, 2013�2020 (Thousand Tons)
Table 48 South Korea: Argon Gas Market Size, By Mixture, 2013�2020 (USD Million)
Table 49 South Korea: Argon Gas Market Size, By Mixture, 2013�2020 (Thousand Tons)
Table 50 Japan: Argon Gas Market Size, By End-Use Industry, 2013�2020 (USD Million)
Table 51 Japan: Argon Gas Market Size, By End-Use Industry, 2013�2020 (Thousand Tons)
Table 52 Japan: Argon Gas Market Size, By Storage, Distribution & Transportation, 2013�2020 (USD Million)
Table 53 Japan: Argon Gas Market Size, By Storage, Distribution & Transportation, 2013�2020 (Thousand Tons)
Table 54 Japan: Argon Gas Market Size, By Mixture, 2013�2020 (USD Million)
Table 55 Japan: Argon Gas Market Size, By Mixture, 2013�2020 (Thousand Tons)
Table 56 Rest of Asia-Pacific: Argon Gas Market Size, By End-Use Industry, 2013�2020 (USD Million)
Table 57 Rest of Asia-Pacific: Argon Gas Market Size, By End-Use Industry, 2013�2020 (Thousand Tons)
Table 58 Rest of Asia-Pacific: Argon Gas Market Size, By Storage, Distribution & Transportation, 2013�2020 (USD Million)
Table 59 Rest of Asia-Pacific: Argon Gas Market Size, By Storage, Distribution & Transportation, 2013�2020 (Thousand Tons)
Table 60 Rest of Asia-Pacific: By Market Size, By Mixture, 2013�2020 (USD Million)
Table 61 Rest of Asia-Pacific: By Market Size, By Mixture, 2013�2020 (Thousand Tons)
Table 62 North America: By Market Size, By Country, 2013�2020 (USD Million)
Table 63 North America: By Market Size, By Country, 2013�2020 (Thousand Tons)
Table 64 North America: By Market Size, By End-Use Industry, 2013�2020 (USD Million)
Table 65 North America: By Market Size, By End-Use Industry, 2013�2020 (Thousand Tons)
Table 66 North America: By Market Size, By Storage, Distribution & Transportation, 2013�2020 (USD Million)
Table 67 North America: By Market Size, By Storage, Distribution & Transportation, 2013�2020 (Thousand Tons)
Table 68 North America: By Market Size, By Mixture, 2013�2020 (USD Million)
Table 69 North America: By Market Size, By Mixture, 2013�2020 (Thousand Tons)
Table 70 U.S.: By Market Size, By End-Use Industry, 2013�2020 (USD Million)
Table 71 U.S.: By Market Size, By End-Use Industry, 2013�2020 (Thousand Tons)
Table 72 U.S.: By Market Size, By Storage, Distribution & Transportation, 2013�2020 (USD Million)
Table 73 U.S.: By Market Size, By Storage, Distribution & Transportation, 2013�2020 (Thousand Tons)
Table 74 U.S.: By Market Size, By Mixture, 2013�2020 (USD Million)
Table 75 U.S.: By Market Size, By Mixture, 2013�2020 (Thousand Tons)
Table 76 Canada: By Market Size, By End-Use Industry, 2013�2020 (USD Million)
Table 77 Canada: By Market Size, By End-Use Industry, 2013�2020 (Thousand Tons)
Table 78 Canada: By Market Size, By Storage, Distribution & Transportation, 2013�2020 (USD Million)
Table 79 Canada: By Market Size, By Storage, Distribution & Transportation, 2013�2020 (Thousand Tons)
Table 80 Canada: By Market Size, By Mixture, 2013�2020 (USD Million)
Table 81 Canada: By Market Size, By Mixture, 2013�2020 (Thousand Tons)
Table 82 Mexico: By Market Size, By End-Use Industry, 2013�2020 (USD Million)
Table 83 Mexico: By Market Size, By End-Use Industry, 2013�2020 (Thousand Tons)
Table 84 Mexico: By Market Size, By Storage, Distribution & Transportation, 2013�2020 (USD Million)
Table 85 Mexico: By Market Size, By Storage, Distribution & Transportation, 2013�2020 (Thousand Tons)
Table 86 Mexico: By Market Size, By Mixture, 2013�2020 (USD Million)
Table 87 Mexico: By Market Size, By Mixture, 2013�2020 (Thousand Tons)
Table 88 Europe: By Market Size, By Country, 2013�2020 (USD Million)
Table 89 Europe: By Market Size, By Country, 2013�2020 (Thousand Tons)
Table 90 Europe: By Market Size, By End-Use Industry, 2013�2020 (USD Million)
Table 91 Europe: By Market Size, By End-Use Industry, 2013�2020 (Thousand Tons)
Table 92 Europe: By Market Size, By Storage, Distribution & Transportation, 2013�2020 (USD Million)
Table 93 Europe: By Market Size, By Storage, Distribution & Transportation, 2013�2020 (Thousand Tons)
Table 94 Europe: By Market Size, By Mixture, 2013�2020 (USD Million)
Table 95 Europe: By Market Size, By Mixture, 2013�2020 (�000 Units)
Table 96 Germany: By Market Size, By End-Use Industry, 2013�2020 (USD Million)
Table 97 Germany: By Market Size, By End-Use Industry, 2013�2020 (Thousand Tons)
Table 98 Germany: By Market Size, By Storage, Distribution & Transportation, 2013�2020 (USD Million)
Table 99 Germany: By Market Size, By Storage, Distribution & Transportation, 2013�2020 (Thousand Tons)
Table 100 Germany: By Market Size, By Mixture, 2013�2020 (USD Million)
Table 101 Germany: By Market Size, By Mixture, 2013�2020 (Thousand Tons)
Table 102 France: By Market Size, By End-Use Industry, 2013�2020 (USD Million)
Table 103 France: By Market Size, By End-Use Industry, 2013�2020 (Thousand Tons)
Table 104 France: By Market Size, By Storage, Distribution & Transportation, 2013�2020 (USD Million)
Table 105 France: By Market Size, By Storage, Distribution & Transportation, 2013�2020 (Thousand Tons)
Table 106 France: By Market Size, By Mixture, 2013�2020 (USD Million)
Table 107 France: By Market Size, By Mixture, 2013�2020 (Thousand Tons)
Table 108 Belgium: By Market Size, By End-Use Industry, 2013�2020 (USD Million)
Table 109 Belgium: By Market Size, By End-Use Industry, 2013�2020 (Thousand Tons)
Table 110 Belgium: By Market Size, By Storage, Distribution & Transportation, 2013�2020 (USD Million)
Table 111 Belgium: By Market Size, By Storage, Distribution & Transportation, 2013�2020 (Thousand Tons)
Table 112 Belgium: By Market Size, By Mixture, 2013�2020 (USD Million)
Table 113 Belgium: By Market Size, By Mixture, 2013�2020 (Thousand Tons)
Table 114 U.K.: By Market Size, By End-Use Industry, 2013�2020 (USD Million)
Table 115 U.K.: By Market Size, By End-Use Industry, 2013�2020 (Thousand Tons)
Table 116 U.K.: By Market Size, By Storage, Distribution & Transportation, 2013�2020 (USD Million)
Table 117 U.K.: By Market Size, By Storage, Distribution & Transportation, 2013�2020 (Thousand Tons)
Table 118 U.K.: By Market Size, Mixture, 2013�2020 (USD Million)
Table 119 U.K.: By Market Size, By Mixture, 2013�2020 (Thousand Tons)
Table 120 Rest of Europe: By Market Size, By End-Use Industry, 2013�2020 (USD Million)
Table 121 Rest of Europe: By Market Size, By End-Use Industry, 2013�2020 (Thousand Tons)
Table 122 Rest of Europe: By Market Size, By Storage, Distribution & Transportation, 2013�2020 (USD Million)
Table 123 Rest of Europe: By Market Size, By Storage, Distribution & Transportation, 2013�2020 (Thousand Tons)
Table 124 Rest of Europe: By Market Size, By Mixture, 2013�2020 (USD Million)
Table 125 Rest of Europe: By Market Size, By Mixture, 2013�2020 (Thousand Tons)
Table 126 RoW: By Market Size, By Country, 2013�2020 (USD Million)
Table 127 RoW: By Market Size, By Country, 2013�2020 (Thousand Tons)
Table 128 RoW: By Market Size, By End-Use Industry, 2013�2020 (USD Million)
Table 129 RoW: By Market Size, By End-Use Industry, 2013�2020 (Thousand Tons)
Table 130 RoW: By Market Size, By Storage, Distribution & Transportation, 2013�2020 (USD Million)
Table 131 RoW: By Market Size, By Storage, Distribution & Transportation, 2013�2020 (Thousand Tons)
Table 132 RoW: By Market Size, By Mixture, 2013�2020 (USD Million)
Table 133 RoW: By Market Size, By Mixture, 2013�2020 (Thousand Tons)
Table 134 Brazil: By Market Size, By End-Use Industry, 2013�2020 (USD Million)
Table 135 Brazil: By Market Size, By End-Use Industry, 2013�2020 (Thousand Tons)
Table 136 Brazil: By Market Size, By Storage, Distribution & Transportation, 2013�2020 (USD Million)
Table 137 Brazil: By Market Size, By Storage, Distribution & Transportation, 2013�2020 (Thousand Tons)
Table 138 Brazil: By Market Size, By Mixture, 2013�2020 (USD Million)
Table 139 Brazil: By Market Size, By Mixture, 2013�2020 (Thousand Tons)
Table 140 South Africa: By Market Size, By End-Use Industry, 2013�2020 (USD Million)
Table 141 South Africa: By Market Size, By End-Use Industry, 2013�2020 (Thousand Tons)
Table 142 South Africa: By Market Size, By Storage, Distribution & Transportation, 2013�2020 (USD Million)
Table 143 South Africa: By Market Size, By Storage, Distribution & Transportation, 2013�2020 (Thousand Tons)
Table 144 South Africa: By Market Size, By Mixture, 2013�2020 (USD Million)
Table 145 South Africa: By Market Size, By Mixture, 2013�2020 (Thousand Tons)
Table 146 Saudia Arabia: By Market Size, By End-Use Industry, 2013�2020 (USD Million)
Table 147 Saudi Arabia: By Market Size, By End-Use Industry, 2013�2020 (Thousand Tons)
Table 148 Saudi Arabia: By Market Size, By Storage, Distribution & Transportation, 2013�2020 (USD Million)
Table 149 Saudi Arabia: By Market Size, By Storage, Distribution & Transportation, 2013�2020 (Thousand Tons)
Table 150 Saudi Arabia: By Market Size, By Mixture, 2013�2020 (USD Million)
Table 151 Saudi Arabia: By Market Size, By Mixture, 2013�2020 (Thousand Tons)
Table 152 Other RoW Countries: By Market Size, By End-Use Industry, 2013�2020 (USD Million)
Table 153 Other RoW Countries: By Market Size, By End-Use Industry, 2013�2020 (Thousand Tons)
Table 154 Other RoW Countries: By Market Size, By Storage, Distribution & Transportation, 2013�2020 (USD Million)
Table 155 Other RoW Countries: By Market Size, By Storage, Distribution & Transportation, 2013�2020 (Thousand Tons)
Table 156 Other RoW Countries: By Market Size, By Mixture, 2013�2020 (USD Million)
Table 157 Other RoW Countries: By Market Size, By Mixture, 2013�2020 (Thousand Tons)
Table 158 Expansions, 2011�2015
Table 159 Agreements, Partnerships, Contracts & Joint Ventures, 2011-2015
Table 160 Mergers and Acquisitions, 2011�2015
Table 161 New Product Launches, 2011�2015
List of Figures (56 Figures)
Figure 1 Argon Gas Market: Research Design
Figure 2 Population Growth has Increased By 3 Billion in Three Decades
Figure 3 Increase in the Total Expenditure of Middle-Class Families
Figure 4 Growth in Manufacturing & Service Sectors
Figure 5 Crude Oil Spot Prices, 2004-2014
Figure 6 Natural Gas Prices, 2004-2014
Figure 7 Market Size Estimation Methodology: Bottom-Up Approach
Figure 8 Market Size Estimation Methodology: Top-Down Approach
Figure 9 Data Triangulation Methodology
Figure 10 Argon Gas Market Snapshot (USD Million)
Figure 11 Argon Gas Market Size, By End-Use Industries, 2015 vs 2020 (USD Million)
Figure 12 Argon Gas Market Size, By Region, 2015 vs 2020 (USD Million)
Figure 13 Brazil is Projected to Be the Fastest-Growing Market for Argon Gas From 2015 to 2020
Figure 14 Argon-Carbon Dioxide Gas Mixture is Projected to Be the Leader in the Market Till 2020
Figure 15 Leading Market Players Adopted Expansions as Key Strategy From 2011 to 2015
Figure 16 Emerging Economies Offer Attractive Opportunities in the Argon Gas Market
Figure 17 Metal Manufacturing & Fabrication Captured the Largest Share in the Emerging Asia-Pacific Market in 2014
Figure 18 Country-Wise Growth Potential of Argon Gas, 2015-2020brazil Projected to Be the Fastest-Growing Country for Argon Gas, 2015-2020
Figure 19 Argon Gas Market: Region Wise Snapshot Asia-Pacific Occupied the Largest Market Share Among All Regions in 2014
Figure 20 Emerging Markets to Grow Faster Than Developed Markets, 2015-2020
Figure 21 Argon Gas Market: End-Use Industries Snapshot Metal Manufacturing & Fabrication Accounted for the Largest Share in 2014
Figure 22 Evolution of Industrial Gases Market
Figure 23 Increasing Demand From End-Use Industries is the Main Driver for the Growth of Argon Gas Market
Figure 24 Argon Gas Value Chain
Figure 25 Porter�s Five Forces Analysis
Figure 26 Metal Manufacturing & Fabrication Dominated the Argon Gas Market in 2014
Figure 27 Cylinder & Packaged Gas Segment Dominated the Argon Gas Market in 2014
Figure 28 Argon-Carbon Dioxide Mixture is Projected to Dominate the Argon Gas Market
Figure 29 Insulation Function of Argon Gas to Dominate the Market in the Forecast Period
Figure 30 Geographical Snapshot: Argon Gas Market Growth Rate, CAGR (2015-2020)
Figure 31 Global Industrial Gases Trade Data Analysis (2009-2013) USD Million)
Figure 32 Brazil Market Poised to Grow at the Highest CAGR By 2020
Figure 33 Asia-Pacific: Market Snapshot
Figure 34 North America: Market Snapshot
Figure 35 Europe: Market Snapshot
Figure 36 RoW: Market Snapshot
Figure 37 Companies Adopted Expansions as Their Key Growth Strategy During the Studied Period (2011-2015)
Figure 38 Argon Gas Market Developments, By Key Player, 2014
Figure 39 2014 is Observed to Be the Most Active Year for the Argon Gas Market
Figure 40 Expansions: the Key Growth Strategy, 2011-2015
Figure 41 Geographic Revenue Mix of Top Five Players
Figure 42 Air Liquide S.A.: Company Snapshot
Figure 43 Air Liquide S.A.: SWOT Analysis
Figure 44 Air Products and Chemicals, Inc.: Company Snapshot
Figure 45 Air Liquide S.A.: SWOT Analysis
Figure 46 Iwatani Corporation.: Company Snapshot
Figure 47 Praxair Inc.: Company Snapshot
Figure 48 SWOT Analysis: Praxair Inc.
Figure 49 The Linde Group: Company Snapshot
Figure 50 SWOT Analysis: the Linde Group
Figure 51 Advanced Speciality Gases Inc: Company Snapshot
Figure 52 Airgas Inc: Company Snapshot
Figure 53 SWOT Analysis: Airgas Inc.
Figure 54 Messer Group: Company Snapshot
Figure 55 Matheson Tri-Gas Inc.: Company Snapshot
Figure 56 Iceblick Ltd.: Company Snapshot


Growth opportunities and latent adjacency in Argon Gas Market