High-Resolution Melting Analysis Market by Product (Supermix Reagent, RT PCR Instrument, Software), Application (SNP Genotyping, Mutation Discovery, Epigenetics), Enduser (Research Laboratories, Hospital, Diagnostic Center) - Global Forecast to 2021


[143 Pages Report] The global high-resolution melting analysis market is expected to reach USD 302.1 Million by 2021 from USD 259.4 Million in 2016, at a CAGR of 3.1% during the forecast period of 2016 to 2021.
This report provides an overall understanding of the global high-resolution melting analysis market. This report segments the market on the basis of product & service, application, end user, and region. On the basis of product and service, the global market is divided into instruments, reagents & consumables, and software & services. Among these products, the reagents and consumables segment accounted for the largest share of the market in 2016.
On the basis of application, the market is segmented into SNP genotyping, mutation discovery, species identification, pathogen identification, epigenetics, and other applications (HLA compatibility typing, zygosity testing, DNA fingerprinting, DNA mapping, association (case/control) studies, allelic prevalence in a population, and identification of candidate predisposition genes). In 2016, the SNP genotyping segment accounted for the largest share of the market.
On the basis of end user, the market is segmented into research laboratories & academic institutes, hospitals & diagnostics centers, pharmaceutical & biotechnology companies, and other end users. In 2016, the research laboratories & academic institutes segment accounted for the largest share of the global market.
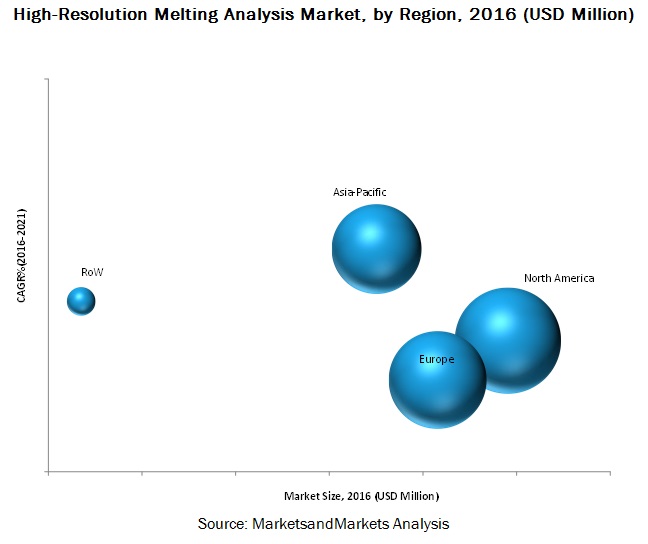
In 2016, the North American region accounted for the largest share of the global high-resolution melting analysis market, followed by Europe. The rising prevalence of infectious diseases, genetic disorders & other chronic diseases, and the large number of genotyping-based research and development projects in this region are the key growth drivers for the North American market. Asia-Pacific is expected to witness the highest growth during the forecast period, due to its large patient population, improving healthcare infrastructure, growing per capita income, expansion of key market players, and increasing awareness of personalized medicine.
Global high-resolution melting analysis industry growth is propelled by the benefits of this technology, such as its high efficacy, significant accuracy, and small cycle times. Additionally, market growth is likely to be driven by the rising prevalence of infectious diseases & genetic disorders, increasing public-private investments in the Genomics sector, funds & grants, rapid growth in the aging population, and improving healthcare infrastructure in emerging countries.
A combination of bottom-up and top-down approaches was used to calculate the market sizes and growth rates of the high-resolution melting analysis market and its subsegments. All percentage shares, splits, and breakdowns were determined using secondary sources and verified through primary sources. All possible parameters that affect the markets covered in this research study have been accounted for, viewed in extensive detail, verified through primary research, and analyzed to get the final quantitative and qualitative data. Primary interviews with key opinion leaders were also used to determine the percentage shares of each subsegment and the relative differences in growth rates.
The major players in the global market include Thermo Fisher Scientific Inc. (U.S.), F. Hofmann-La Roche Ltd. (Switzerland), Bio-Rad Laboratories (U.S.), and QIAGEN N.V. (Netherlands). Other players in the market include Agilent Technologies Inc. (U.S.), bioMérieux S.A. (France), Illumina, Inc. (U.S.), Meridian Bioscience, Inc. (U.S.), Novacyt (France), Azura Genomics (U.S.), Canon Biomedical (U.S.), and PREMIER Biosoft (U.S.), among others.
Target audience for this report:
- qPCR Manufacturing/Distribution Companies
- Research Laboratories and Academic Institutes
- Research and Development (R&D) Companies
- Pharmaceutical and Biotechnology Companies
- Healthcare Service Providers (including Hospitals and Diagnostic Centres)
- Clinical Research Organizations (CROs)
- Forensic Laboratories
- Market Research and Consulting Firms
Scope of the Report
This report categorizes the global high-resolution melting analysis market into the following segments:
High-Resolution Melting Analysis Market, by Product & Service
- Instruments
- Reagents and Consumables
- Specialized PCR Reagents
- Intercalating Dyes
- Software and Services
High-Resolution Melting Analysis Market, by Application
- SNP Genotyping
- Mutation Discovery
- Species Identification
- Pathogen Identification
- Epigenetics
- Other Applications
High-Resolution Melting Analysis Market, by End User
- Research Laboratories & Academic Institutes
- Hospitals & Diagnostic Centers
- Pharmaceutical & Biotechnology Companies
- Other End Users
High-Resolution Melting Analysis Market, by Region
-
North America
- U.S.
- Canada
-
Europe
- Germany
- U.K.
- RoE
-
Asia-Pacific
- China
- Japan
- Australia
- RoAPAC
- Rest of the World
Available Customizations
With the given market data, MarketsandMarkets offers customizations as per the company’s specific needs. The following customization options are available for the report:
Company Information
- Detailed analysis and profiling of additional market players (Up to 5)
- Further breakdown of the RoW high-resolution melting analysis market into Latin America and Africa
The global high-resolution melting analysis market is expected to reach USD 302.1 Million by 2021 from USD 259.4 Million in 2016, at a CAGR of 3.1% during the forecast period of 2016 to 2021. In this report, the global market is broadly segmented on the basis of product & service, application, end user, and region.
Rising prevalence of infectious diseases and genetic disorders; increasing public-private investments, funds, and grants for research on genetic analysis technologies; and advantages of HRM over other genotyping technologies are the major factors driving market growth.
Based on product and service, the global market is divided into instruments, reagents & consumables, and software & services. In 2016, the reagents and consumables segment accounted for the largest share of the market. Based on application, the market is segmented into SNP genotyping, mutation discovery, species identification, pathogen identification, epigenetics, and other applications (HLA compatibility typing, zygosity testing, DNA fingerprinting, DNA mapping, association (case/control) studies, allelic prevalence in a population, and identification of candidate predisposition genes). In 2016, the SNP genotyping segment accounted for the largest share of the market. On the basis of end user, the market is segmented into research laboratories & academic institutes, hospitals & diagnostics centers, pharmaceutical & biotechnology companies, and other end users. In 2016, the research laboratories & academic institutes segment accounted for the largest share of the global market.
Based on region, the global high-resolution melting analysis market is segmented into North America, Europe, Asia-Pacific, and the Rest of the World (RoW). The report maps each type of high-resolution melting analysis product in these geographic and regional segments. In 2016, North America (comprising the U.S. and Canada) accounted for the largest share of the global market, followed by Europe. The rising prevalence of infectious diseases, genetic disorders, & other chronic diseases and the large number of genotyping-based research and development projects in this region are the key growth drivers for the North American market.
The major players in the global high-resolution melting analysis market are Thermo Fisher Scientific Inc. (U.S.), F. Hofmann-La Roche Ltd. (Switzerland), Bio-Rad Laboratories (U.S.), and QIAGEN N.V. (Netherlands), Agilent Technologies Inc. (U.S.), bioMérieux S.A. (France), Illumina, Inc. (U.S.), Meridian Bioscience, Inc. (U.S.), Novacyt (France), Azura Genomics (U.S.), Canon Biomedical (U.S.), and PREMIER Biosoft (U.S.), among others.
To speak to our analyst for a discussion on the above findings, click Speak to Analyst
 Exclusive indicates content/data unique to MarketsandMarkets and not available with any competitors.
Table of Contents
1 Introduction (Page No. - 15)
1.1 Objectives of the Study
1.2 Market Definition
1.2.1 Markets Covered
1.2.2 Years Considered in the Report
1.3 Currency
1.4 Limitations
1.5 Stakeholders
2 Research Methodology (Page No. - 18)
2.1 Research Approach
2.1.1 Key Data From Secondary Sources
2.1.2 Key Data From Primary Sources
2.2 Market Size Estimation
2.3 Market Breakdown and Data Triangulation
2.4 Assumptions for the Study
3 Executive Summary (Page No. - 25)
4 Premium Insights (Page No. - 28)
4.1 High-Resolution Melting Analysis: Market Overview
4.2 Geographic Analysis: Market, By Product & Service (2016)
4.3 High-Resolution Melting Analysis Market Size, By Application, 2016 vs 2021
4.4 Geographic Snapshot of the Market
5 Market Overview (Page No. - 31)
5.1 Introduction
5.2 Market Dynamics
5.2.1 Drivers
5.2.1.1 Advantages of HRM Over Other Genotyping Technologies
5.2.1.2 Rising Prevalence of Infectious Diseases and Genetic Disorders
5.2.1.3 Increasing Public-Private Investments, Funds, and Grants
5.2.1.4 Use of HRM in Pathogen Identification
5.2.2 Restraint
5.2.2.1 Technical Limitations Associated With HRM-QPCR Analysis
5.2.3 Challenges
5.2.3.1 Expected Cost Reduction in Other Genotyping Technologies
5.2.3.2 Security Concerns Regarding Data Storage
5.3 HRM Analysis vs Other Genotyping Technologies
5.4 Value Chain Analysis
6 High-Resolution Melting Analysis Market, By Product and Service (Page No. - 39)
6.1 Introduction
6.2 Reagents and Consumables
6.2.1 Specialized Pcr Reagents
6.2.2 Intercalating Dyes
6.3 Instruments
6.4 Software and Services
7 High-Resolution Melting Analysis Market, By Application (Page No. - 45)
7.1 Introduction
7.2 SNP Genotyping
7.3 Mutation Discovery
7.4 Species Identification
7.5 Pathogen Identification
7.6 Epigenetics
7.7 Other Applications
8 High-Resolution Melting Analysis Market, By End User (Page No. - 52)
8.1 Introduction
8.2 Research Laboratories and Academic Institutes
8.3 Pharmaceutical and Biotechnology Companies
8.4 Hospitals and Diagnostic Centres
8.5 Other End Users
9 High-Resolution Melting Analysis Market, By Region (Page No. - 58)
9.1 Introduction
9.2 North America
9.2.1 U.S.
9.2.2 Canada
9.3 Europe
9.3.1 U.K.
9.3.2 Germany
9.3.3 RoE
9.4 Asia-Pacific
9.4.1 China
9.4.2 Japan
9.4.3 Australia
9.4.4 Rest of Asia-Pacific
9.5 Rest of the World
10 Competitive Landscape (Page No. - 94)
10.1 Introduction
10.2 Vendor Dive Overview
10.2.1 Vanguards
10.2.2 Innovator
10.2.3 Dynamic
10.2.4 Emerging
10.3 Analysis of the Product Portfolio of Major Companies in the HRM Market
10.4 Bussiness Strategies Adopted By Major Players in the HRM Market
*Top 20 Companies Analyzed for This Studies are – Thermo Fisher Scientific, Inc. (U.S.), F. Hoffmann-La Roche AG (Switzerland), Qiagen N.V. (The Netherlands), Bio-Rad Laboratories (U.S.), Agilent Technologies (U.S.), Illumina, Inc. (U.S.), Azura Genomics (U.S.), Biomérieux (France), Meridian Bioscience Inc. (U.S.), Novacyt Group (France), Canon Biomedical (U.S.), Premier Biosoft (U.S.), Chaibio (U.S), Techne (U.K.), Alphahelix Technologies AB (Sweden), Methyldetect (Denmark), Biofield Innovation (Italy), Biotium, Inc (U.S.), Solis Biodyne (Estonia), and It-Is Lifescience Ltd (Republic of Ireland)
11 Company Profiles (Page No. - 98)
(Introduction, Products & Services, Strategy, & Analyst Insights, Developments, MnM View)*
11.1 Introduction
11.2 Thermo Fisher Scientific, Inc.
11.3 Bio-Rad Laboratories, Inc.
11.4 F. Hoffman-La Roche Ltd.
11.5 Qiagen N.V.
11.6 Illumina, Inc.
11.7 Agilent Technologies, Inc.
11.8 Biomérieux SA
11.9 Meridian Bioscience, Inc.
11.10 Novacyt Group
11.11 Premier Biosoft
11.12 Azura Genomics
11.13 Canon Biomedical Inc.
*Details on Marketsandmarkets View, Introduction, Product & Services, Strategy, & Analyst Insights, New Developments Might Not Be Captured in Case of Unlisted Companies.
12 Appendix (Page No. - 133)
12.1 Insights of Industry Experts
12.2 Discussion Guide
12.3 Knowledge Store: Marketsandmarkets’ Subscription Portal
12.4 Introducing RT: Real-Time Market Intelligence
12.5 Available Customizations
12.6 Related Reports
12.7 Author Details
List of Tables (78 Tables)
Table 1 Cost Analysis Per Patient: HRM vs Other Genotyping Technologies
Table 2 Feature Analysis: HRM vs Other Genotyping Technologies
Table 3 High-Resolution Melting Analysis Market Size, By Product & Service, 2014–2021 (USD Million)
Table 4 Market Size for Reagents and Consumables, By Region, 2014–2021 (USD Million)
Table 5 Market Size for Reagents and Consumables, By Type, 2014–2021 (USD Million)
Table 6 Specialized Pcr Reagents Market Size, By Region, 2014–2021 (USD Million)
Table 7 Intercalating Dyes Market Size, By Region, 2014–2021 (USD Million)
Table 8 Market Size for Instruments, By Region, 2014–2021 (USD Million)
Table 9 Market Size for Software and Services, By Region, 2014–2021 (USD Million)
Table 10 High-Resolution Melting Analysis Market Size, By Application, 2014–2021 (USD Million)
Table 11 High Resolution Melting Analysis Market Size for SNP Genotyping, By Region, 2014–2021 (USD Million)
Table 12 High Resolution Melting Analysis Market Size for Mutation Discovery, By Region, 2014–2021 (USD Million)
Table 13 Market Size for Species Identification, By Region, 2014–2021 (USD Million)
Table 14 Market Size for Pathogen Identification, By Region, 2014–2021 (USD Million)
Table 15 Market Size for Epigenetics, By Region, 2014–2021 (USD Million)
Table 16 Market Size for Other Applications, By Region, 2014–2021 (USD Million)
Table 17 Market Size, By End User, 2014–2021 (USD Million)
Table 18 Market Size for Research Laboratories & Academic Institutes, By Region, 2014–2021 (USD Million)
Table 19 Market Size for Pharmaceutical & Biotechnology Companies, By Region, 2014–2021 (USD Million)
Table 20 Market Size for Hospitals & Diagnostic Centres, By Region, 2014–2021 (USD Million)
Table 21 High-Resolution Melting Analysis Market Size for Other End Users, By Region, 2014–2021 (USD Million)
Table 22 Global Market Size, By Region, 2014–2021 (USD Million)
Table 23 Global Market Size, By Country, 2014–2021 (USD Million)
Table 24 North America: Market Size, By Country, 2014–2021 (USD Million)
Table 25 North America: Market Size, By Product & Service, 2014–2021 (USD Million)
Table 26 North America: Market Size for Reagents and Consumables, By Type, 2014–2021 (USD Million)
Table 27 North America: Market Size, By Application, 2014–2021 (USD Million)
Table 28 North America: High-Resolution Melting Analysis Market Size, By End User, 2014–2021 (USD Million)
Table 29 U.S.: Market Size, By Product & Service, 2014–2021 (USD Million)
Table 30 U.S.: Market Size for Reagents and Consumables, By Type, 2014–2021 (USD Million)
Table 31 U.S.: Market Size, By Application, 2014–2021 (USD Million)
Table 32 U.S.: Market Size, By End User, 2014–2021 (USD Million)
Table 33 Canada: Market Size, By Product & Service, 2014–2021 (USD Million)
Table 34 Canada: Market Size for Reagents and Consumables, By Type, 2014–2021 (USD Million)
Table 35 Canada: Market Size, By Application, 2014–2021 (USD Million)
Table 36 Canada: Market Size, By End User, 2014–2021 (USD Million)
Table 37 Europe: Market Size, By Country, 2014–2021 (USD Million)
Table 38 Europe: Market Size, By Product & Service, 2014–2021 (USD Million)
Table 39 Europe: High-Resolution Melting Analysis Market Size for Reagents and Consumables, By Type, 2014–2021 (USD Million)
Table 40 Europe: Market Size, By Application, 2014–2021 (USD Million)
Table 41 Europe: Market Size, By End User, 2014–2021 (USD Million)
Table 42 U.K.: Market Size, By Product & Service, 2014–2021 (USD Million)
Table 43 U.K.: Market Size for Reagents and Consumables, By Type, 2014–2021 (USD Million)
Table 44 U.K.: Market Size, By Application, 2014–2021 (USD Million)
Table 45 U.K.: Market Size, By End User, 2014–2021 (USD Million)
Table 46 Germany: Market Size, By Product & Service, 2014–2021 (USD Million)
Table 47 Germany: High-Resolution Melting Analysis Market Size for Reagents and Consumables, By Type, 2014–2021 (USD Million)
Table 48 Germany: Market Size, By Application, 2014–2021 (USD Million)
Table 49 Germany: Market Size, By End User, 2014–2021 (USD Million)
Table 50 RoE: Market Size, By Product & Service, 2014–2021 (USD Million)
Table 51 RoE: Market Size for Reagents and Consumables, By Type, 2014–2021 (USD Million)
Table 52 RoE: Market Size, By Application, 2014–2021 (USD Million)
Table 53 RoE: Market Size, By End User, 2014–2021 (USD Million)
Table 54 APAC: Market Size, By Country, 2014–2021 (USD Million)
Table 55 APAC: Market Size, By Product & Service, 2014–2021 (USD Million)
Table 56 APAC: Market Size for Reagents and Consumables, By Type, 2014–2021 (USD Million)
Table 57 APAC: Market Size, By Application, 2014–2021 (USD Million)
Table 58 APAC: Market Size, By End User, 2014–2021 (USD Million)
Table 59 China: High-Resolution Melting Analysis Market Size, By Product & Service, 2014–2021 (USD Million)
Table 60 China: Market Size for Reagents and Consumables, By Type, 2014–2021 (USD Million)
Table 61 China: Market Size, By Application, 2014–2021 (USD Million)
Table 62 China: Market Size, By End User, 2014–2021 (USD Million)
Table 63 Japan: Market Size, By Product & Service, 2014–2021 (USD Million)
Table 64 Japan: Market Size for Reagents and Consumables, By Type, 2014–2021 (USD Million)
Table 65 Japan: Market Size, By Application, 2014–2021 (USD Million)
Table 66 Japan: Market Size, By End User, 2014–2021 (USD Million)
Table 67 Australia: Market Size, By Product & Service, 2014–2021 (USD Million)
Table 68 Australia: Market Size for Reagents and Consumables, By Type, 2014–2021 (USD Million)
Table 69 Australia: Market Size, By Application, 2014–2021 (USD Million)
Table 70 Australia: Market Size, By End User, 2014–2021 (USD Million)
Table 71 Rest of APAC: High-Resolution Melting Analysis Market Size, By Product & Service, 2014–2021 (USD Million)
Table 72 RoAPAC: Market Size for Reagents and Consumables, By Type, 2014–2021 (USD Million)
Table 73 RoAPAC: Market Size, By Application, 2014–2021 (USD Million)
Table 74 RoAPAC: Market Size, By End User, 2014–2021 (USD Million)
Table 75 RoW: Market Size, By Product & Service, 2014–2021 (USD Million)
Table 76 RoW: Market Size for Reagents and Consumables, By Type, 2014–2021 (USD Million)
Table 77 RoW: Market Size, By Application, 2014–2021 (USD Million)
Table 78 RoW: Market Size, By End User, 2014–2021 (USD Million)
List of Figures (57 Figures)
Figure 1 Research Design
Figure 2 Market Size Estimation Methodology: Bottom-Up Approach
Figure 3 Market Size Estimation Methodology: Top-Down Approach
Figure 4 Breakdown of Primary Interviews: By Company Type, Designation, and Region
Figure 5 Data Triangulation Methodology
Figure 6 High-Resolution Melting Analysis Market, By Product, 2016 vs 2021 (USD Million)
Figure 7 Market, By Application, 2016 vs 2021 (USD Million)
Figure 8 Market Size, By End User, 2016 vs 2021 (USD Million)
Figure 9 Geographical Snapshot of the Market
Figure 10 Emerging Economies to Offer Lucrative Growth Opportunities During the Forecast Period
Figure 11 Reagents & Consumables Segment Commanded the Largest Market Share in 2016
Figure 12 SNP Genotyping Segment Will Continue to Dominate the Market in 2021
Figure 13 China Presents Lucrative Growth Opportunities for Players in the Market
Figure 14 Market: Drivers, Restraints, and Challenges
Figure 15 HIV Prevalence, By Region (Million)
Figure 16 High-Resolution Melting Analysis vs Other Genotyping Methods
Figure 17 Value Chain Analysis: Major Value is Added to Product Price During the Manufacturing Phase
Figure 18 Reagents and Consumables Segment Dominated the Market in 2016
Figure 19 SNP Genotyping Commanded the Largest Share of the Market in 2016
Figure 20 Research Laboratories & Academic Institutes to Dominate the Market, in 2016
Figure 21 North America: Market Snapshot
Figure 22 Europe: Market Snapshot
Figure 23 Asia-Pacific: Market Snapshot
Figure 24 MnM Dive-Vendor Comparison Matrix
Figure 25 Thermo Fisher Scientific, Inc.: Company Snapshot (2016)
Figure 26 Thermo Fisher Scientific, Inc.: Product Offering Scorecard
Figure 27 Thermo Fisher Scientific, Inc.: Business Strategy Scorecard
Figure 28 Bio-Rad Laboratories: Company Snapshot (2016)
Figure 29 Bio-Rad Laboratories: Product Offering Scorecard
Figure 30 Bio-Rad Laboratories: Business Strategy Scorecard
Figure 31 F. Hoffman-La Roche Ltd.: Company Snapshot (2016)
Figure 32 F. Hoffman-La Roche Ltd: Product Offering Scorecard
Figure 33 F. Hoffman-La Roche Ltd: Business Strategy Scorecard
Figure 34 Qiagen N.V.: Company Snapshot (2015)
Figure 35 Qiagen N.V. : Product Offering Scorecard
Figure 36 Qiagen N.V.: Business Strategy Scorecard
Figure 37 Illumina, Inc.: Company Snapshot (2015)
Figure 38 Illumina, Inc.: Product Offering Scorecard
Figure 39 Illumina, Inc.: Business Strategy Scorecard
Figure 40 Agilent Technologies, Inc.: Company Snapshot (2016)
Figure 41 Agilent Technologies, Inc.: Product Offering Scorecard
Figure 42 Agilent Technologies, Inc.: Business Strategy Scorecard
Figure 43 Biomérieux SA: Company Snapshot (2015)
Figure 44 Biomérieux SA: Product Offering Scorecard
Figure 45 Biomérieux SA: Business Strategy Scorecard
Figure 46 Meridian Bioscience, Inc.: Company Snapshot (2016)
Figure 47 Meridian Bioscience, Inc.: Product Offering Scorecard
Figure 48 Meridian Bioscience, Inc.: Business Strategy Scorecard
Figure 49 Novacyt Group: Company Snapshot (2015)
Figure 50 Novacyt Group: Product Offering Scorecard
Figure 51 Novacyt Group: Business Strategy Scorecard
Figure 52 Premier Biosoft: Product Offering Scorecard
Figure 53 Premier Biosoft: Business Strategy Scorecard
Figure 54 Azura Genomics: Product Offering Scorecard
Figure 55 Azura Genomics: Business Strategy Scorecard
Figure 56 Canon Biomedical Inc.: Product Offering Scorecard
Figure 57 Canon Biomedical Inc.: Business Strategy Scorecard

 Generating Response ...


Growth opportunities and latent adjacency in High-Resolution Melting Analysis Market