High Throughput Process Development Market by Product (Consumables (Minicolumn, Mini Bioreactor), Instruments), Services, Software, Molecule Type (mAB), Technology (Affinity Chromatography), End User (Biopharmaceutical) - Global Forecast to 2021


[152 Pages Report] The global high throughput process development market is expected to reach USD 415.5 Million in 2021 from USD 162.9 Million in 2015, at a CAGR of 14.4% during the forecast period. The base year considered for the study is 2015, and the forecast for the market size is provided for the period between 2016 and 2021. In the current market scenario, there is a growing demand for high throughput process development products. Growth in the global market is mainly driven by the increasing R&D spending, technological advancements in process development, growth in the biopharmaceutical industry, and growing pressure to lower the cost of manufacturing. However, factors such as the high cost of technology and equipment in this market and lack of adequate infrastructural facilities are restraining the growth of this market to a certain extent.
Objectives of the Study
- To define, describe, and forecast the global market by product and service, technology, molecule type, end user, and region
- To provide detailed information regarding the major factors influencing market growth (drivers, restraints, and current trends)
- To analyze micromarkets with respect to individual growth trends, prospects, and contributions to the overall market
- To analyze the opportunities in the market for stakeholders and to provide details of the competitive landscape for market leaders
- To forecast the size of the market segments with respect to the four key regions (along with countries), namely, North America, Europe, Asia Pacific, and the Rest of the World
- To profile key players and comprehensively analyze their market shares and core competencies
- To track and analyze competitive developments such as product launches, agreements, partnerships, and other developments in the global market
Research Methodology
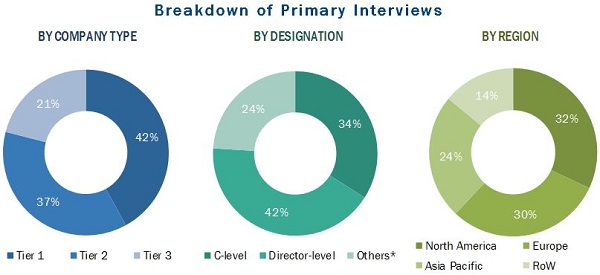
Top-down and bottom-up approaches were used to validate the size of the global high throughput process development market and estimate the size of various other dependent submarkets. Major players in the market were identified through secondary research and their market revenues were determined through primary and secondary research. Secondary research included the study of the annual and financial reports of top market players, whereas primary research included extensive interviews with key opinion leaders such as CEOs, directors, and marketing executives. The percentage splits, shares, and breakdowns of the segments were determined using secondary sources and verified through primary sources. This data is consolidated and added to detailed inputs and analysis from MarketsandMarkets and presented in this report.
To know about the assumptions considered for the study, download the pdf brochure
The high throughput process development market is highly competitive. Some of the major players in this market are Danaher (US), GE Healthcare (US), Agilent Technologies (US), Merck Millipore (Germany), and Thermo Fisher Scientific (US).
Target Audience
- Manufacturers, suppliers, and providers.
- Biopharmaceutical firms
- Contract manufacturing organizations
Scope of the Report
The research report categorizes the global market into the following segments and subsegments:
Global High Throughput Process Development Market, by Product and Service
-
Consumables
- Miniature Prepacked Columns
- Micro-well Filter Plates
- Miniature Disposable Bioreactor
- Micropipettes and Pipette Tips
- Other Consumables (Injection valves, fraction collecting tubes, and buffer solutions)
-
Instruments
- Automatic Integrated Workstation
- Automated Miniature Bioreactor System
- Services
- Software
Global High Throughput Process Development Market, by End User
- Biopharmaceutical Companies
- Contract Research Organizations
- Academic Research Institutes
Global High Throughput Process Development Market, by Technology
-
Chromatography
- Affinity Chromatography
- Ion-exchange
- Multi-modal chromatography
- Other Chromatography Technologies (size-exclusion chromatography and hydrophobic charge-induction chromatography)
- Ultraviolet-visible Spectroscopy
- Other Technologies (ELISA, chip electrophoresis, SPR, and qPCR)
Global High Throughput Process Development Market, by Molecule Type
- Monoclonal Antibodies
- Other Molecules (recombinant pro-insulin, polysaccharide vaccines, recombinant Green Fluorescent Protein (rGFP), fusion proteins, and interferon á-2a)
Global High Throughput Process Development Market, by Region
-
North America
- US
- Canada
- Europe
- Asia Pacific
- Rest of the World (RoW)
Available Customizations
With the given market data, MarketsandMarkets offers customizations as per the company’s specific needs. The following customization options are available for the report:
Company Information
- Detailed analysis and profiling of additional market players (Up to 5)
The global high throughput process development market is expected to reach USD 415.5 Million in 2021 from USD 212.1 Million in 2016, at a CAGR of 14.4% from 2016 to 2021. Growth in this market is mainly driven by the increasing R&D spending, technological advancements in process development, growth in the biopharmaceutical industry, and growing pressure to lower the cost of manufacturing. However, factors such as the high cost of technology and equipment in this market and the lack of adequate infrastructural facilities are restraining the growth of this market to a certain extent.
The market is segmented on the basis of molecule type, end user, technology, product and service, and region. Based on molecule type, the market is classified into monoclonal antibodies and others (recombinant pro-insulin, polysaccharide vaccines, recombinant Green Fluorescent Protein (rGFP), fusion proteins, and interferon á-2a). The monoclonal antibodies segment accounted for the largest share of the global market in 2016. The large share of this segment is attributed to the increasing adoption of targeted immunotherapy and rising number of US FDA-cleared therapeutic monoclonal antibodies.
Based on end user, the market is categorized into biopharmaceutical companies, contract research organizations and academic research institutes. Biopharmaceutical companies accounted for the largest share of the global high throughput process development market in 2016. The contract manufacturing organizations segment, on the other hand, is expected to be the fastest-growing end-user segment of the market during the forecast period. High R&D investments by pharmaceutical and biopharmaceutical companies to accelerate drug manufacturing and increasing pressure from regulatory authorities to lower the cost of production are the major factors driving the growth of the biopharmaceutical manufacturers end-user segment.
Based on technology, the market is categorized into chromatography, ultraviolet-visible spectroscopy, and others (ELISA, chip electrophoresis, SPR, and qPCR). The chromatography segment accounted for the largest share of the global market in 2016. The chromatography segment is further divided into ion exchange chromatography (IEC), affinity chromatography (AC), multimodal chromatography (MC), and others (hydrophobic charge induction chromatography (HCIC) and size exclusion chromatography). The affinity chromatography segment accounted for the largest share of the chromatography high throughput process development in 2016. Owing to the advantages of affinity chromatography over other chromatography such as high selectivity, high flow rate and its capacity for extensive removal of process-related impurities such as host cell proteins, DNA, and Cell Culture media component are driving the growth of the market.
Based on product and service, the market is categorized into consumables, instruments, services, and software. The consumables segment accounted for the largest share of the global high throughput process development market in 2016. The availability of a wide range of reagents and continuous product developments and innovations are expected to drive the HTPD consumables market.
Factors such as the high cost of technology and equipment in this market and the lack of adequate infrastructural facilities are restraining the growth of this market to a certain extent.
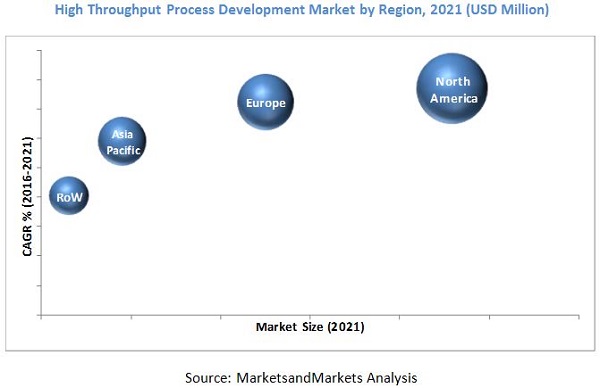
Geographically, North America (comprising the US and Canada) accounted for the largest share of the global market in 2016. Factors such as increasing R&D spending by pharmaceutical and biopharmaceutical companies, growing demand for technical tools for improving the production quality of biological materials, collective pressure towards lowering the cost of manufacturing biological materials, rising demand for reducing product development timelines, and the presence of major players in this region are driving the growth of the North American market.
Major players operating in the high throughput process development market include Danaher (US), GE Healthcare (US), Agilent Technologies (US), Merck Millipore (Germany), and Thermo Fisher Scientific (US).
To speak to our analyst for a discussion on the above findings, click Speak to Analyst
 Exclusive indicates content/data unique to MarketsandMarkets and not available with any competitors.
Table of Contents
1 Introduction (Page No. - 13)
1.1 Objectives of the Study
1.2 Market Definition
1.2.1 Markets Covered
1.2.2 Years Considered for the Study
1.3 Currency
1.4 Limitations
1.5 Stakeholders
2 Research Methodology (Page No. - 16)
2.1 Research Approach
2.1.1 Key Data From Secondary Sources
2.1.2 Key Data From Primary Sources
2.1.2.1 Key Industry Insights
2.2 Market Size Estimation
2.3 Market Breakdown and Data Triangulation
2.4 Assumptions for the Study
3 Executive Summary (Page No. - 24)
4 Premium Insights (Page No. - 29)
4.1 Global Market Snapshot: 2016 vs 2021
4.2 Global Market, By Product and Region
4.3 Global Market, By Consumable Type, 2016 vs 2021 (USD Million)
4.4 Global Market, By Region
5 Market Overview (Page No. - 33)
5.1 Introduction
5.2 Market Dynamics
5.2.1 Drivers
5.2.1.1 Increasing R&D Spending
5.2.1.2 Technological Advancements in Process Development
5.2.1.3 Growth in the Biopharmaceutical Industry
5.2.1.4 Growing Pressure to Lower the Cost of Manufacturing
5.2.2 Restraints
5.2.2.1 High Cost of Advanced Technologies and Lack of Adequate Infrastructural Facilities
5.2.3 Current Trends
5.2.3.1 Adoption of Quality By Design(QBD) Principles
6 By Product & Service (Page No. - 39)
6.1 Introduction
6.2 Consumables
6.2.1 Miniature Prepacked Columns
6.2.2 Microtiter Plates
6.2.3 Miniaturized Disposable Bioreactor
6.2.4 Micropipettes and Pipette Tips
6.2.5 Other Consumables
6.3 Instruments
6.3.1 Automated Integrated Workstation
6.3.2 Automated Miniature Bioreactor System
6.4 Services
6.5 Software
7 By Molecule Type (Page No. - 54)
7.1 Introduction
7.2 Monoclonal Antibodies
7.3 Other Molecules
8 By End User (Page No. - 59)
8.1 Introduction
8.2 Biopharmaceutical
8.3 Contract Research Organization
8.4 Academic Research Institutes
9 By Technology (Page No. - 65)
9.1 Introduction
9.2 Chromatography
9.2.1 Affinity Chromatography
9.2.2 Ion-Exchange Chromatography
9.2.3 Multimodal Chromatography
9.2.4 Other Chromatography
9.3 Ultraviolet-Visible Spectroscopy
9.4 Other Technologies
10 By Region (Page No. - 76)
10.1 Introduction
10.2 North America
10.2.1 US
10.2.2 Canada
10.3 Europe
10.4 Asia Pacific
10.5 Rest of the World (RoW)
11 Competitive Landscape (Page No. - 102)
11.1 Overview
11.2 Comparative Assessment of Key Market Players
11.3 Compettitive Situation and Trends
11.3.1 Product Launches
11.3.2 Agreements and Partnerships
11.3.3 Acquisitions
11.3.4 Expansions
11.3.5 Other Strategies
12 Company Profiles (Page No. - 109)
(Overview, Products and Services, Financials, Strategy & Development)*
12.1 Introduction
12.2 Danaher Corporation
12.3 GE Healthcare
12.4 Thermo Fisher Scientific Inc.
12.5 Merck Millipore
12.6 Agilent Technologies
12.7 Bio-Rad Laboratories
12.8 Eppendorf
12.9 Perkinelmer
12.10 Sartorius Stedim Biotech
12.11 Tecan Group
*Details on Overview, Products and Services, Financials, Strategy & Development Might Not Be Captured in Case of Unlisted Companies.
13 Appendix (Page No. - 140)
13.1 Insights of Industry Experts
13.2 Discussion Guide
13.3 Other Developments
13.4 Knowledge Store: Marketsandmarkets’ Subscription Portal
13.5 Introducing RT: Real-Time Market Intelligence
13.6 Available Customizations
13.7 Related Reports
13.8 Author Details
List of Tables (102 Tables)
Table 1 High Throughput Process Development Market Size, By Product & Service, 2014–2021 (USD Million)
Table 2 Global Market Size, By Consumables, 2014–2021 (USD Million)
Table 3 High Throughput Process Development Consumables Market Size, By Region, 2014–2021 (USD Million)
Table 4 North America: High Throughput Process Development Consumables Market Size, By Country, 2014–2021 (USD Million)
Table 5 High Throughput Process Development Miniature Prepacked Columns Market Size, By Region, 2014–2021 (USD Million)
Table 6 North America: Market Size, By Country, 2014–2021 (USD Million)
Table 7 High Throughput Process Development Micro-Well Filter Plates Market Size, By Region, 2014–2021 (USD Million)
Table 8 North America: Market Size, By Country, 2014–2021 (USD Million)
Table 9 High Throughput Process Development Disposable Bioreactor Market Size, By Region, 2014–2021 (USD Million)
Table 10 North America: High Throughput Process Development Micropipettes and Pipette Tips Market Size, By Country, 2014–2021 (USD Million)
Table 11 High Throughput Process Development Micropipettes and Pipette Tips Market Size, By Region, 2014–2021 (USD Million)
Table 12 North America: Market Size, By Country, 2014–2021 (USD Million)
Table 13 High Throughput Process Development Other Consumables Size, By Region, 2014–2021 (USD Million)
Table 14 North America: High Throughput Process Development Micropipettes and Pipette Tips Market Size, By Country, 2014–2021 (USD Million)
Table 15 High Throughput Process Development Market Size, By Instrument Types, 2014–2021 (USD Million)
Table 16 High Throughput Process Development Instruments Market Size, By Region, 2014–2021 (USD Million)
Table 17 North America: Market Size, By Country, 2014–2021 (USD Million)
Table 18 High Throughput Process Development Automated Integrated Workstation Market Size, By Region, 2014–2021 (USD Million)
Table 19 North America: Market Size, By Country, 2014–2021 (USD Million)
Table 20 High Throughput Process Development Automated Miniature Bioreactor System Market Size, By Region, 2014–2021 (USD Million)
Table 21 North America: Market Size, By Country, 2014–2021 (USD Million)
Table 22 High Throughput Process Development Services Market Size, By Region, 2014–2021 (USD Million)
Table 23 North America: Market Size, By Country, 2014–2021 (USD Million)
Table 24 High Throughput Process Development Software Market Size, By Region, 2014–2021 (USD Million)
Table 25 North America: Size, By Country, 2014–2021 (USD Million)
Table 26 High Throughput Process Development Market Size, By Molecule Type, 2014–2021 (USD Million)
Table 27 Global Market Size for Monoclonal Antibodies, By Region, 2014–2021 (USD Million)
Table 28 North America: Market Size for Monoclonal Antibodies, By Country, 2014–2021 (USD Million)
Table 29 Global Market Size for Other Molecules, By Region, 2014-2021 (USD Million)
Table 30 North America: Market Size for Other Molecules, By Country, 2014–2021 (USD Million)
Table 31 Global Market Size, By Molecule Type, 2014–2021 (USD Million)
Table 32 High Throughput Process Development Market Size for Biopharmaceutical, By Region, 2014–2021 (USD Million)
Table 33 North America: Market Size for Biopharmaceutical, By Country, 2014–2021 (USD Million)
Table 34 Global Market Size for Contract Research Organization, By Region, 2014-2021 (USD Million)
Table 35 North America: Market Size for Contract Research Organization, By Country, 2014–2021 (USD Million)
Table 36 Global Market Size for Academia Research Institutes, By Region, 2014-2021 (USD Million)
Table 37 North America: Market Size for Academic Research Institutes, By Country, 2014–2021 (USD Million)
Table 38 Market Size, By Technology, 2014–2021 (USD Million)
Table 39 Global Market Size for Chromatography, By Type, 2014–2021 (USD Million)
Table 40 Global Market Size for Chromatography, By Region, 2014–2021 (USD Million)
Table 41 North America: Market Size for Chromatography, By Country, 2014–2021 (USD Million)
Table 42 Global Market Size for Affinity Chromatography, By Region, 2014–2021 (USD Million)
Table 43 North America: Market Size for Affinity Chromatography, By Country, 2014–2021 (USD Million)
Table 44 High Throughput Process Development Market Size for Ion-Exchange Chromatography, By Region, 2014–2021 (USD Million)
Table 45 North America: Market Size for Ion-Exchange Chromatography, By Country, 2014–2021 (USD Million)
Table 46 Global Market Size for Multimodal Chromatography, By Region, 2014–2021 (USD Million)
Table 47 North America: Market Size for Multimodal Chromatography, By Country, 2014–2021 (USD Million)
Table 48 Global Market Size for Other Chromatography, By Region, 2014–2021 (USD Million)
Table 49 North America: Market Size for Other Chromatography, By Country, 2014–2021 (USD Million)
Table 50 Market Size for Ultraviolet–Visible Spectroscopy, By Region, 2014-2021 (USD Million)
Table 51 North America: Market Size for Ultraviolet–Visible Spectroscopy, By Country, 2014–2021 (USD Million)
Table 52 Global Market Size for Other Technologies, By Region, 2014-2021 (USD Million)
Table 53 North America: Market Size for Other Technologies, By Country, 2014–2021 (USD Million)
Table 54 Global Market Size, By Region, 2014–2021 (USD Million)
Table 55 North America: High Throughput Process Development Market Size, By Country, 2014–2021 (USD Million)
Table 56 North America: Market Size, By Product & Service, 2014–2021 (USD Million)
Table 57 North America: Market Size, By Consumables Type, 2014–2021 (USD Million)
Table 58 North America: Market Size, By Instruments Type, 2014–2021 (USD Million)
Table 59 North America: Market Size, By End User, 2014–2021 (USD Million)
Table 60 North America: Market Size, By Molecule Type, 2014–2021 (USD Million)
Table 61 North America: Market Size, By Technology, 2014–2021 (USD Million)
Table 62 North America: Market Size, By Chromatography Type, 2014–2021 (USD Million)
Table 63 US: Market Size, By Product & Service, 2014–2021 (USD Million)
Table 64 US: Market Size, By Consumables Type, 2014–2021 (USD Million)
Table 65 US: Market Size, By Instruments Type, 2014–2021 (USD Million)
Table 66 US: Market Size, By End User, 2014–2021 (USD Million)
Table 67 US: Market Size, By Molecule Type, 2014–2021 (USD Million)
Table 68 US: Market Size, By Technology, 2014–2021 (USD Million)
Table 69 US: Market Size, By Chromatography Type, 2014–2021 (USD Million)
Table 70 Canada: High Throughput Process Development Market Size, By Product & Service, 2014–2021 (USD Million)
Table 71 Canada: Market Size, By Consumables Type, 2014–2021 (USD Million)
Table 72 Canada: Market Size, By Instruments Type, 2014–2021 (USD Million)
Table 73 Canada: Market Size, By End User, 2014–2021 (USD Million)
Table 74 Canada: Market Size, By Molecule Type, 2014–2021 (USD Million)
Table 75 Canada: Market Size, By Technology, 2014–2021 (USD Million)
Table 76 Canada: Market Size, By Chromatography Type, 2014–2021 (USD Million)
Table 77 Europe: High Throughput Process Development Market Size, By Product & Service, 2014–2021 (USD Million)
Table 78 Europe: Market Size, By Consumables Type, 2014–2021 (USD Million)
Table 79 Europe: Market Size, By Instruments Type, 2014–2021 (USD Million)
Table 80 Europe: Market Size, By End User, 2014–2021 (USD Million)
Table 81 Europe: Market Size, By Molecule Type, 2014–2021 (USD Million)
Table 82 Europe: Market Size, By Technology, 2014–2021 (USD Million)
Table 83 Europe: Market Size, By Chromatography Type, 2014–2021 (USD Million)
Table 84 Asia Pacific: Market Size, By Product & Service, 2014–2021 (USD Million)
Table 85 Asia Pacific: Market Size, By Consumables Type, 2014–2021 (USD Million)
Table 86 Asia Pacific: Market Size, By Instruments Type, 2014–2021 (USD Million)
Table 87 Asia Pacific: Market Size, By End User, 2014–2021 (USD Million)
Table 88 Asia Pacific: Market Size, By Molecule Type, 2014–2021 (USD Million)
Table 89 Asia Pacific: Market Size, By Technology, 2014–2021 (USD Million)
Table 90 Asia Pacific: Market Size, By Chromatography Type, 2014–2021 (USD Million)
Table 91 RoW: High Throughput Process Development Market Size, By Product & Service, 2014–2021 (USD Million)
Table 92 RoW: Market Size, By Consumables Type, 2014–2021 (USD Million)
Table 93 RoW: Market Size, By Instruments Type, 2014–2021 (USD Million)
Table 94 RoW: Market Size, By End User, 2014–2021 (USD Million)
Table 95 RoW: Market Size, By Molecule Type, 2014–2021 (USD Million)
Table 96 RoW: Market Size, By Technology, 2014–2021 (USD Million)
Table 97 RoW: Market Size, By Chromatography Type, 2014–2021 (USD Million)
Table 98 Product Launches, 2014–2016
Table 99 Agreements and Partnerships, 2014–2016
Table 100 Acquisitions, 2014–2016
Table 101 Expansions, 2014–2016
Table 102 Other Strategies, 2014–2016
List of Figures (35 Figures)
Figure 1 Research Design
Figure 2 Breakdown of Primary Interviews: By Company Type, Designation, and Region
Figure 3 High Throughput Process Development Market: Top-Down Approach
Figure 4 Global Market: Bottom-Up Approach
Figure 5 Market Data Triangulation Methodology
Figure 6 Global Market, By Molecule Type, 2016 vs 2021
Figure 7 Global Market, By End User, 2016 vs 2021
Figure 8 Global Market, By Technology, 2016 vs 2021
Figure 9 Global Market, By Product and Service, 2016 vs 2021
Figure 10 Geographical Snapshot of the High Throughput Process Development Market
Figure 11 Increasing Demand for Biopharmaceuticals is an Important Growth Driver
Figure 12 Miniature Prepacked Column Segment Dominated the Global Market, By Consumable Type, in 2016
Figure 13 North America to Grow at the Highest Rate During the Forecast Period
Figure 14 High-Throughput Process Development Market: Drivers and Restraints
Figure 15 Pharmaceutical R&D Expenditure, By Region/Country, 2000 vs 2010 vs 2014
Figure 16 Consumables Segment to Dominate the Market During the Forecast Period
Figure 17 Monoclonal Antibodies Commanded the Largest Share of the Global Market in 2016
Figure 18 Biopharmaceutical Commanded the Largest Share of the Global Market in 2016
Figure 19 Chromatography Commanded the Largest Share of the Global Market in 2016
Figure 20 High Throughput Process Development Market Size, By Region, 2016 vs 2021 (USD Million)
Figure 21 North America: Market Snapshot
Figure 22 Europe: Market Snapshot
Figure 23 Companies Majorly Pursued the Strategy of Product Launches to Enhance Their Market Presence
Figure 24 Battle for Market Share: Product Launches—Key Growth Strategy Adopted By Market Players
Figure 25 Geographic Revenue Mix of the Prominent Players in the Global Market
Figure 26 Danaher: Company Snapshot (2015)
Figure 27 GE Healthcare: Company Snapshot (2015)
Figure 28 Thermo Fisher Scientific Inc.: Company Snapshot (2015)
Figure 29 Merck Millipore: Company Snapshot (2015)
Figure 30 Agilent Technologies: Company Snapshot (2016)
Figure 31 Bio-Rad Laboratories: Company Snapshot (2015)
Figure 32 Eppendorf: Company Snapshot (2015)
Figure 33 Perkinelmer: Company Snapshot (2015)
Figure 34 Sartorius Stedim Biotech: Company Snapshot (2015)
Figure 35 Tecan Group : Company Snapshot (2015)

 Generating Response ...


Growth opportunities and latent adjacency in High Throughput Process Development Market