Hydrogel Market by Raw Material Type (Natural, Synthetic, Hybrid), Composition (Polyacrylate, Polyacrylamide, Silicon), Form (Amorphous, Semi-crystalline, Crystalline), Application (Contact Lens, Personal Care & Hygiene), Region - Global Forecast to 2022


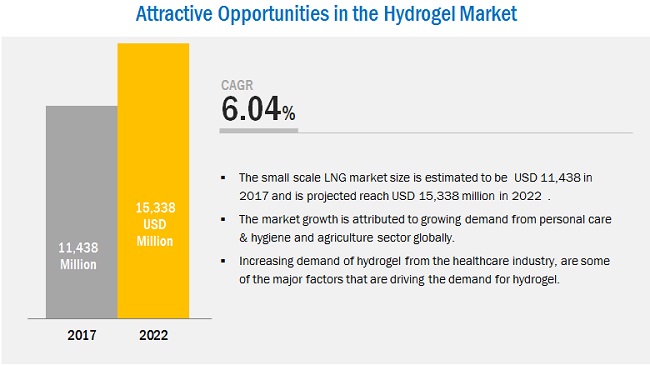
[133 Pages Report] Hydrogel Market size was valued at USD 10.87 Billion in 2016 and is projected to reach USD 15.33 Billion by 2022, at a CAGR of 6.04% from 2017 to 2022. The base year considered for the study is 2016 and the forecast period is from 2017 to 2022.
The report aims at estimating the market size and future growth potential of the hydrogel market across different segments, such as raw material type, composition, form, application, and region. It also provides detailed information regarding major factors influencing the growth of the market (drivers, restraints, opportunities, and industry-specific challenges). The report further aims to study individual growth trends, future prospects, and contribution of various segments to the overall market. The study also analyzes opportunities in the market for stakeholders and provides details of a competitive landscape for market leaders. It strategically profiles key players and comprehensively analyzes their core competencies.
The research methodology used to estimate and forecast the size of the hydrogel market began with capturing data on key vendor revenues through secondary research. Vendor offerings were taken into consideration to determine the market segmentation. The bottom-up procedure was employed to arrive at the overall size of the hydrogel market by estimating the revenue of key players. After arriving at the overall market size, the total market was split into several segments and subsegments, which were then verified through primary research by conducting extensive interviews with key personnel, such as CEOs, VPs, directors, and executives. Data triangulation and market breakdown procedures were employed to complete the overall market engineering process and arrive at the exact statistics for all segments and subsegments. The breakdown of profiles of primary participants is depicted in the figure below:
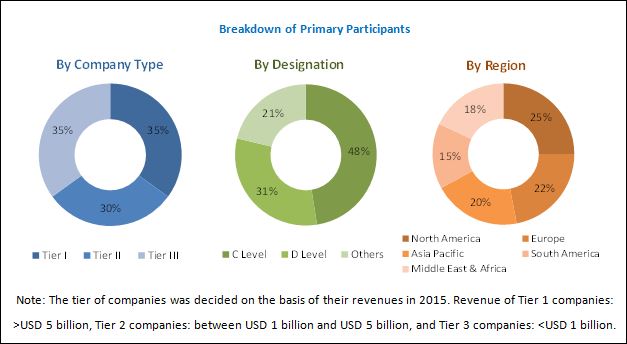
To know about the assumptions considered for the study, download the pdf brochure
The market ecosystem includes various stakeholders involved in the supply chain of the hydrogel industry starting from the procurement of raw materials, research & development, and manufacturing. Post this, the marketing and sales of products take place, which is possible if an efficient distribution channel is developed. Finally, end products are made available to potential consumers. The market for hydrogel is led by major players in the healthcare and chemicals industries. Johnson & Johnson (US), Cardinal Health (US), the 3M Company (US), Coloplast (Denmark), B. Braun Melsungen (Germany), Smith & Nephew (UK), Derma Sciences (US), Royal DSM (Netherlands), Dow Corning Corporation (US), Paul Hartmann (Germany), Momentive Performance Materials (US), Ocular Therapeutix (US), ConvaTec (UK), Ashland (US), Evonik Industries (Germany), Cosmo Bio USA (US), MPM Medical (US), Molnlycke Health Care (Sweden), Hollister (US), Medline Industries (US), Gentell (US), and Alliqua Biomedical (US) are leading manufacturers of hydrogels.
Target Audience:
- Raw Material Suppliers
- Logistics Partners
- Machinery Suppliers
- Regulatory Bodies
- Market Research and Consulting Firms
Scope of the Report:
The hydrogel market has been segmented into the following submarkets:
By Raw Material Type:
- Natural
- Synthetic
- Hybrid
By Composition:
- Polyacrylate
- Polyacrylamide
- Silicon
- Others (Agar and PVP)
By Form:
- Amorphous
- Crystalline
- Semi-crystalline
By Application:
- Wound Care
- Contact Lens
- Drug Delivery
- Agriculture
- Personal Care & Hygiene
- Others (Tissue Engineering, Dental, and Research & Forensic)
By Region:
- North America
- Europe
- Asia Pacific
- Middle East & Africa
- South America
Available Customizations
With the given market data, MarketsandMarkets offers customizations according to client-specific needs. The following customization options are available for the report:
Product Analysis
- Product Matrix, which offers a detailed comparison of product portfolio of each company
Geographic Analysis
- Further analysis of the hydrogel market for additional countries
Company Information
- Detailed analysis and profiling of additional market players
The hydrogel market is estimated to be USD 11.43 Billion in 2017 and is projected to reach USD 15.33 Billion by 2022, at a CAGR of 6.04% between 2017 and 2022. The increase in consumption of personal care & hygiene products is one of the most significant factors driving the growth of the hydrogel market during the forecast period. In addition, the rise in disposable income of consumers and increase in the applicability of hydrogels in the healthcare industry are other factors influencing the growth of the hydrogel market.
The hydrogel market has been segmented on the basis of raw material type, form, composition, application, and region. Based on composition, the polyacrylate segment is projected to grow at the highest CAGR during the forecast period. The growth of the polyacrylate segment can be attributed to its superior properties, such as high water retention ability and flexibility.
Based on application, the agriculture segment of the hydrogel market is projected to grow at the highest CAGR from 2017 to 2022, as the use of hydrogels helps prevent soil erosion and enhances crop yield.
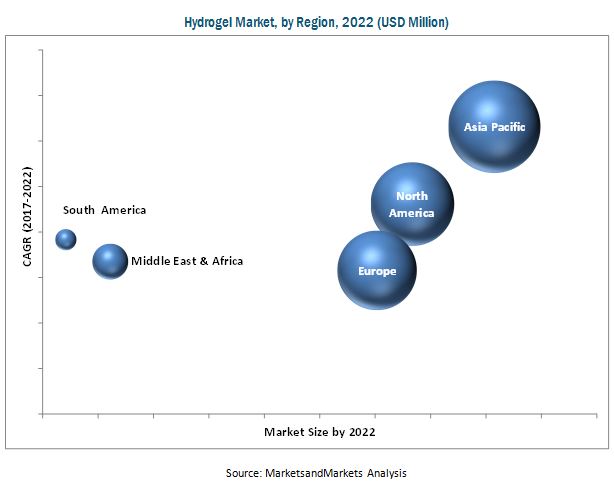
Asia Pacific accounted for the largest share of the hydrogel market in 2016. This market in the Asia Pacific region is projected to grow at the highest CAGR from 2017 to 2022. The growth of hydrogel market in emerging countries such as China, India, Brazil, and South Africa can be attributed to the increase in consumption of hygiene products and rise in the production of commercial hydrogel contact lenses.
The poor response of hydrogels in external environment acts as a restraint to the growth of the hydrogel market. Hydrogels are polymeric networks that swell quickly by absorbing large quantities of water or other biological fluids and de-swell in response to the changing environmental conditions. This process of de-swelling makes hydrogels too fragile and hampers their physical strength. Moreover, the response properties and elastic properties of hydrogels are altered with the changing environmental conditions. Furthermore, lack of awareness regarding hydrogels among end users is another factor restraining the growth of the market.
The hydrogel market is led by major players in the healthcare and chemicals industries. Johnson & Johnson (US), Cardinal Health (US), The 3M Company (US), Coloplast (Denmark), B. Braun Melsungen (Germany), Smith & Nephew (UK), Derma Sciences (US), Royal DSM (Netherlands), Dow Corning Corporation (US), Paul Hartmann (Germany), Momentive Performance Materials (US), Ocular Therapeutix (US), ConvaTec (UK), Ashland (US), Evonik Industries (Germany), Cosmo Bio USA (US), MPM Medical (US), Molnlycke Health Care (Sweden), Hollister (US), Medline Industries (US), Gentell (US), and Alliqua Biomedical (US) are key players operating in the hydrogel market. These players have adopted various strategies to expand their global presence and increase their market share. Mergers & acquisitions, expansions, and new product launches are some of the key strategies adopted by leading players to strengthen their position in the hydrogel market.
To speak to our analyst for a discussion on the above findings, click Speak to Analyst
 Exclusive indicates content/data unique to MarketsandMarkets and not available with any competitors.
Table of Contents
1 Introduction (Page No. - 14)
1.1 Objectives of the Study
1.2 Market Definition
1.3 Market Scope
1.3.1 Years Considered for the Study
1.4 Currency
1.5 Limitations
1.6 Stakeholders
2 Research Methodology (Page No. - 18)
2.1 Research Data
2.1.1 Secondary Data
2.1.1.1 Key Data From Secondary Sources
2.1.2 Primary Data
2.1.2.1 Key Data From Primary Sources
2.1.2.2 Breakdown of Primary Interviews
2.2 Market Size Estimation
2.3 Data Triangulation
2.4 Assumptions
3 Executive Summary (Page No. - 25)
4 Premium Insights (Page No. - 29)
4.1 Significant Opportunities in Hydrogel Market
4.3 Hydrogel Market Size, By Composition and Region
4.4 Hydrogel Market Size, By Application
4.5 Asia-Pacific Hydrogel Market, By Composition and Country
4.6 Hydrogel Market Attractiveness
5 Market Overview (Page No. - 33)
5.1 Introduction
5.2 Evolution of Hydrogel
5.3 Market Dynamics
5.3.1 Drivers
5.3.1.1 Growing Popularity of Contact Lenses Over Spectacles
5.3.1.2 Rising Demand for Hydrogel Products in Emerging Economies
5.3.2 Restraints
5.3.2.1 Hydrogel Responds Quickly to External Environment
5.3.3 Opportunities
5.3.3.1 Rising Awareness Regarding Healthcare and Personal Hygiene Creates High Value Opportunities
5.3.4 Challenges
5.3.4.1 Complex Process and High Production Cost
5.4 Porter�s Five Forces Analysis
5.4.1 Threat of New Entrants
5.4.2 Bargaining Power of Suppliers
5.4.3 Threat of Substitutes
5.4.4 Bargaining Power of Buyers
5.4.5 Intensity of Competitive Rivalry
6 Industry Trends (Page No. - 40)
6.1 Macroeconomic Overview and Trends
7 Hydrogel Market, By Form and Raw Material (Page No. - 44)
7.1 Introduction
7.2 By Form
7.2.1 Amorphous
7.2.2 Semi-Crystalline
7.2.3 Crystalline
7.3 By Raw Material
7.3.1 Natural
7.3.2 Synthetic
7.3.3 Hybrid
8 Hydrogel Market, By Composition (Page No. - 46)
8.1 Introduction
8.2 Polyacrylate
8.3 Polyacrylamide
8.4 Silicone
8.5 Others
9 Hydrogel Market, By Application (Page No. - 50)
9.1 Introduction
9.2 Contact Lenses
9.3 Wound Care
9.4 Personal Care & Hygiene
9.5 Drug Delivery
9.6 Agriculture
9.7 Others
10 Hydrogel Market, By Region (Page No. - 55)
10.1 Introduction
10.2 North America
10.2.1 U.S.
10.2.2 Canada
10.2.3 Mexico
10.3 Asia-Pacific
10.3.1 China
10.3.2 India
10.3.3 Japan
10.3.4 South Korea
10.3.5 Indonesia
10.3.6 Rest of Asia-Pacific
10.4 Europe
10.4.1 U.K.
10.4.2 Germany
10.4.3 France
10.4.4 Spain
10.4.5 Italy
10.4.6 Russia
10.4.7 Turkey
10.4.8 Rest of Europe
10.5 Middle East & Africa
10.5.1 UAE
10.5.2 South Africa
10.5.3 Saudi Arabia
10.5.4 Rest of Middle East & Africa
10.6 South America
10.6.1 Brazil
10.6.2 Argentina
10.6.3 Rest of South America
11 Competitive Landscape (Page No. - 91)
11.1 Introduction
11.2 Market Ranking of Key Players
12 Company Profiles (Page No. - 93)
(Business Overview, Products Offered, Scorecard of Product Offering, Scorecard of Business Strategy, and New Product Launch)
12.1 Cardinal Health
12.2 Smith & Nephew
12.3 3M
12.4 Johnson & Johnson
12.5 Coloplast
12.6 B. Braun Melsungen
12.7 Derma Sciences
12.8 Medtronic
12.9 Royal DSM
12.10 DOW Corning
12.11 Momentive Performance Materials
12.12 Paul Hartmann
12.13 Other Key Players
12.13.1 Bsn Medical
12.13.2 Gentell
12.13.3 Molnlycke Health Care
12.13.4 Mpm Medical
12.13.5 Hollister
12.13.6 Conva Tec
12.13.7 Ocular Therapeutix
12.13.8 Medline Industries
12.13.9 Ashland
12.13.10 Evonik Industries
12.13.11 Cosmo Bio
12.13.12 Alliqua Biomedical
12.13.13 Procyon Corporation
(Overview, Financial*, Products & Services, Strategy, and Developments)
13 Appendix (Page No. - 126)
13.1 Discussion Guide
13.2 Knowledge Store: Marketsandmarkets� Subscription Portal
13.3 Introducing RT: Real-Time Market Intelligence
13.4 Available Customizations
13.5 Related Reports
13.6 Author Details
List of Tables (80 Tables)
Table 1 Trend of Growth in World GDP Per Capita, USD Million (2016�2022)
Table 2 Household Disposable Income, Net Annual Growth Rate (%), 2010�2015
Table 3 Trends of Healthcare Industry, By Expenditure (2012-2016)
Table 4 Healthcare Expenditure (Percentage of GDP), 2011�2014
Table 5 Hydrogel Market Size, By Composition, 2015�2022 (USD Billion)
Table 6 Polyacrylate: Hydrogel Market Size, By Region, 2015�2022 (USD Million)
Table 7 Polyacrylamide: Hydrogel Market Size, By Region, 2015�2022 (USD Million)
Table 8 Silicone: Hydrogel Market Size, By Region, 2015�2022 (USD Million)
Table 9 Others: Hydrogel Market Size, By Region, 2015�2022 (USD Million)
Table 10 Hydrogel Market Size, By Application, 2015�2022 (USD Million)
Table 11 Hydrogel Market Size in Contact Lenses Application, By Region, 2015�2022 (USD Million)
Table 12 Hydrogel Market Size in Wound Care Application, By Region, 2015�2022 (USD Million)
Table 13 Hydrogel Market Size in Personal Care & Hygiene Application, By Region, 2015�2022 (USD Million)
Table 14 Hydrogel Market Size in Drug Delivery Application, By Region, 2015�2022 (USD Million)
Table 15 Hydrogel Market Size in Agriculture Application, By Region, 2015�2022 (USD Million)
Table 16 Hydrogel Market Size in Other Applications, By Region, 2015�2022 (USD Million)
Table 17 Hydrogel Market Size, By Region, 2014�2021 (USD Million)
Table 18 North America: Hydrogel Market Size, By Country, 2015�2022 (USD Million)
Table 19 North America: Hydrogel Market Size, By Application, 2015�2022 (USD Million)
Table 20 North America: Hydrogel Market Size, By Composition, 2015�2022 (USD Million)
Table 21 U.S.: By Market Size, By Application, 2015�2022 (USD Million)
Table 22 U.S.: By Market, By Composition, 2015�2022 (USD Million)
Table 23 Canada: By Market Size, By Application, 2015�2022 (USD Million)
Table 24 Canada: By Market Size, By Composition, 2015�2022 (USD Million)
Table 25 Mexico: By Market Size, By Application, 2015�2022 (USD Million)
Table 26 Mexico: By Market Size, By Composition, 2015�2022 (USD Million)
Table 27 Asia-Pacific: By Market Size, By Country, 2015�2022 (USD Million)
Table 28 Asia-Pacific: By Market Size, By Application, 2015�2022 (USD Million)
Table 29 Asia-Pacific: By Market Size, By Composition, 2015�2022 (USD Million)
Table 30 China: By Market Size, By Application, 2015�2022 (USD Million)
Table 31 China: By Market, By Composition, 2015�2022 (USD Million)
Table 32 India: By Market Size, By Application, 2015�2022 (USD Million)
Table 33 India: By Market Size, By Composition, 2015�2022 (USD Million)
Table 34 Japan: By Market Size, By Application, 2015�2022 (USD Million)
Table 35 Japan: By Market Size, By Composition, 2015�2022 (USD Million)
Table 36 South Korea: By Market Size, By Application, 2015�2022 (USD Million)
Table 37 South Korea: By Market Size, By Composition, 2015�2022 (USD Million)
Table 38 Indonesia: By Market Size, By Application, 2015�2022 (USD Million)
Table 39 Indonesia: By Market Size, By Composition, 2015�2022 (USD Million)
Table 40 Rest of Asia-Pacific: By Market Size, By Application, 2015�2022 (USD Million)
Table 41 Rest of Asia-Pacific: By Market Size, By Composition, 2015�2022 (USD Million)
Table 42 Europe: By Market Size, By Country, 2015�2022 (USD Million)
Table 43 Europe: By Market Size, By Application, 2015�2022 (USD Million)
Table 44 Europe: By Market Size, By Composition, 2015�2022 (USD Million)
Table 45 U.K.: By Market Size, By Application, 2015�2022 (USD Million)
Table 46 U.K.: By Market, By Composition, 2015�2022 (USD Million)
Table 47 Germany: By Market Size, By Application, 2015�2022 (USD Million)
Table 48 Germany: By Market Size, By Composition, 2015�2022 (USD Million)
Table 49 France: By Market Size, By Application, 2015�2022 (USD Million)
Table 50 France: By Market Size, By Composition, 2015�2022 (USD Million)
Table 51 Spain: By Market Size, By Application, 2015�2022 (USD Million)
Table 52 Spain: By Market Size, By Composition, 2015�2022 (USD Million)
Table 53 Italy: By Market Size, By Application, 2015�2022 (USD Million)
Table 54 Italy: By Market Size, By Composition, 2015�2022 (USD Million)
Table 55 Russia: By Market Size, By Application, 2015�2022 (USD Million)
Table 56 Russia: By Market Size, By Composition, 2015�2022 (USD Million)
Table 57 Turkey: By Market Size, By Application, 2015�2022 (USD Million)
Table 58 Turkey: By Market Size, By Composition, 2015�2022 (USD Million)
Table 59 Rest of Europe: By Market Size, By Application, 2015�2022 (USD Million)
Table 60 Rest of Europe: By Market Size, By Composition, 2015�2022 (USD Million)
Table 61 Middle East & Africa: By Market Size, By Country, 2015�2022 (USD Million)
Table 62 Middle East & Africa: By Market Size, By Application, 2015�2022 (USD Million)
Table 63 Middle East & Africa: By Market Size, By Composition, 2015�2022 (USD Million)
Table 64 UAE: By Market Size, By Type, 2015�2022 (USD Million)
Table 65 UAE: By Market Size, By Composition, 2015�2022 (USD Million)
Table 66 South Africa: Hydrogel Market Size, By Application, 2015�2022 (USD Million)
Table 67 South Africa: Hydrogel Market Size, By Composition, 2015�2022 (USD Million)
Table 68 Saudi Arabia: Hydrogel Market Size, By Application, 2015�2022 (USD Million)
Table 69 Saudi Arabia: Hydrogel Market Size, By Composition, 2015�2022 (USD Million)
Table 70 Rest of Middle East & Africa: Hydrogel Market Size, By Application, 2015�2022 (USD Million)
Table 71 Rest of Middle East & Africa: Hydrogel Market Size, By Composition, 2015�2022 (USD Million)
Table 72 South America: Hydrogel Market Size, By Country, 2015�2022 (USD Million)
Table 73 South America: Hydrogel Market Size, By Application, 2015�2022 (USD Million)
Table 74 South America: Hydrogel Market Size, By Composition, 2015�2022 (USD Million)
Table 75 Brazil: Hydrogel Market Size, By Application, 2015�2022 (USD Million)
Table 76 Brazil: Hydrogel Market Size, By Composition, 2015�2022 (USD Million)
Table 77 Argentina: Hydrogel Market Size, By Application, 2015�2022 (USD Million)
Table 78 Argentina: Hydrogel Market Size, By Composition, 2015�2022 (USD Million)
Table 79 Rest of South America: Hydrogel Market Size, By Application, 2015�2022 (USD Million)
Table 80 Rest of South America: Hydrogel Market Size, By Composition, 2015�2022 (USD Million)
List of Figures (31 Figures)
Figure 1 Hydrogel Market: Research Design
Figure 2 Hydrogel Market Size Estimation Methodology: Bottom-Up Approach
Figure 3 Hydrogel Market Size Estimation Methodology: Top-Down Approach
Figure 4 Global Hydrogel Market: Data Triangulation Methodology
Figure 5 Personal Care & Hygiene to Remain the Largest Application of Hydrogel Between 2017 and 2022
Figure 6 Polyacrylate Segment to Register Fastest Growth During Forecast Period
Figure 7 Asia-Pacific Was the Largest Market for Hydrogel in 2016
Figure 8 Emerging Economies to Offer Attractive Opportunities During Forecast Period
Figure 9 Polyacrylate Segment to Lead Overall Market in 2017
Figure 10 Personal Care & Hygiene to Account for Largest Market Share During Forecast Period
Figure 11 Polyacrylate Hydrogel to Capture Largest Share in Asia-Pacific Market in 2017
Figure 12 Hydrogel Market in India to Register the Highest CAGR
Figure 13 Hydrogel has Evolved Significantly Since Its Inception
Figure 14 Rising Demand for Hydrogel Products in Emerging Economies to Drive the Market
Figure 15 Porter�s Five Forces Analysis
Figure 16 Polyacrylate to Account for Largest Market Share During Forecast Period
Figure 17 Personal Care & Hygiene to Be the Largest Application of Hydrogel During Forecast Period
Figure 18 Regional Snapshot: Hydrogel Market in India to Register A High CAGR
Figure 19 Asia-Pacific Hydrogel Market Snapshot
Figure 20 Cardinal Health: Company Snapshot
Figure 21 Smith & Nephew: Company Snapshot
Figure 22 3M: Company Snapshot
Figure 23 Johnson & Johnson: Company Snapshot
Figure 24 Coloplast: Company Snapshot
Figure 25 B. Braun Melsungen: Company Snapshot
Figure 26 Derma Sciences: Company Snapshot
Figure 27 Medtronic: Company Snapshot
Figure 28 Royal DSM: Company Snapshot
Figure 29 DOW Corning: Company Snapshot
Figure 30 Momentive Performance Materials: Company Snapshot
Figure 31 Paul Hartmann: Company Snapshot


Growth opportunities and latent adjacency in Hydrogel Market