Hydrographic Equipment Market by Application (Hydrographic charting, Offshore oil and gas, Coastal engineering, Port and harbor management], by product ( Sonar, GPS/DGPS, Echosounder, Profiler, Tide gauge) & by Region (Africa, The Asia-Pacific, Americas, Europe, The Middle East) - Forecasts & Analysis to 2014 - 2020


The report provides market analysis of the global hydrographic equipment market over the next six years. It contains the analysis of drivers, challenges, opportunities, and restraints that affect the industry. It also discusses the industry, market, and technology trends that currently prevail in the market. It provides a market size of the global market over the next six years, and talks about the market share by different sub-sectors for each region. It talks of the leading competitors in the global hydrographic equipment market.Apart from a general overview of the companies; it also provides details on their financial positions, key products, unique selling points, and key developments.
The global hydrographic equipment market is expected to reach $2,934.18 million by 2020. The report segments the market and lists the drivers such as demand for accurate and precise nautical charts and exploration for new areas for oil and gas reservesto boost the global market. The report provides information of the major players in this market, which are restricted to a few manufacturers, of which Kongsberg maritime, AS is the leader that captures13.62% of the global hydrographic equipment market share in 2014. It also defines the challenges that exist in the market such as up to date information of navigational areas.
Markets Covered
This global hydrographic equipment market research report categorizes the global market on the basis of application, product, region, and country. The report also provides a detailed analysis of the revenues that are expected to be incurred during the forecast period, market size, and analyzes trends in each of the regions, on the basis of hydrographic applications.
On the basis of application: application areas of hydrographic equipment market have been categorized into hydrographic charting, offshore oil and gas, coastal engineering, and port and harbor management.
On the basis of region:regional analysiscovers Americas, which includes North America, Central America, and South America, Asia-Pacific , Africa and the Middle East.
On the basis of country: country analysis covers the U.S., U.K, Australia, Brazil , Canada, Denmark, India, Liberia, the Netherlands, Norway, Russia, Singapore, and United Arab Emirates.
Hydrography deals with the measurement and description of the bodily features of oceans, seas, coastal areas, lakes and rivers. Hydrography also predicts the changes in these physical features over time. The primary objective of hydrography is safety of navigation and other marine activities such as offshore oil and gas, security and defense, scientific research, port and harbor management and environmental protection.
This report describes the market trends, drivers, and challenges of the market and forecasts the market from 2014 to 2020, based on the application of the hydrographic equipment and on the region. This report covers geographies such as the Americas, Europe, APAC, Africa, and the Middle East.
In the hydrographic equipment market, hydrographic charting contributes the largest percentage share, followed by offshore oil and gas, coastal engineering, and port and harbor management. In regional analysis, Asia-Pacific is the market leader, followed by Europe, and Americas.
The major players in this market are Kongsberg Maritime AS, Teledyne Marine, Raytheon Company and Atlas ElectronikGmbh.
Hydrographic Equipment Market 2014-2020
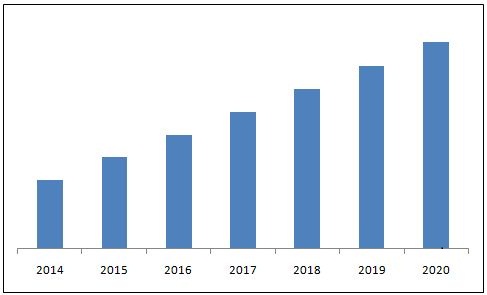
Source: MarketsandMarkets Analysis
The overall hydrographic equipment market is increasing with a CAGR of 2.73% from 2014 to 2020. The major applications for the market are hydrographic charting and offshore oil and gas. Sound and acoustic products such as sonar and side scan sonars and positioning systems are the major shareholders in the market while the Echosounder has the highest growth potential, followed by profilers and tide gauges.
 Exclusive indicates content/data unique to MarketsandMarkets and not available with any competitors.
Table Of Contents
1 Introduction (Page No. - 16)
1.1 Objectives
1.2 Report Description
1.3 Markets Covered
1.4 Stakeholders
1.5 Research Methodology
2 Executive Summary (Page No. - 26)
3 Market Overview (Page No. - 28)
3.1 Market Definition
3.2 Overview
3.3 Market Dynamics
3.3.1 Drivers
3.3.1.1 Exploration of New Areas For Oil and Gas Reserves
3.3.1.2 Ramp-Up For The Replacement Equipment Market
3.3.1.3 Demand For Accurate and Precise Nautical Charts
3.3.1.4 Boost in Maritime Commerce
3.3.1.5 Coastal Zone Management and Development
3.3.2 Restraints
3.3.2.1 Cost
3.3.2.2 International Regulations
3.3.3 Challenges
3.3.3.1 Updated Information of Navigational Areas
3.3.4 Opportunities
3.3.4.1 Global Focus on Development of Blue Economy
3.3.4.2 Uncontested Sectors
4 Technology Trends (Page No. - 37)
4.1 Mems-Based Inertial Systems For Hydrography
4.2 Usv: A New Tool in The Hydrographic Equipment Market
4.3 Synthetic Aperture Sonar
5 Global Hydrographic Equipment Market (Page No. - 40)
5.1 Global Hydrographic Equipment Market
5.1.1 Revenue Analysis
5.1.2 Revenue Analysis, By Application
6 Regional Analysis (Page No. - 46)
6.1 Africa: Revenue Forecast (2014-2020)
6.2 Americas:Revenue Forecast (2014-2020)
6.3 APAC:Revenue Forecast (2014-2020)
6.4 Europe: Revenue Forecast (2014-2020)
6.5 The Middle East: Revenue Forecast (2014-2020)
7 Country Analysis (Page No. - 68)
7.1.1 The U.S.: Revenue Forecast (2014-2020)
7.1.2 U.K.:Revenue Forecast (2014-2020)
7.1.3 Australia�Revenue Forecast
7.1.4 Brazil�Revenue Forecast
7.1.5 Canada�Revenue Forecast
7.1.6 Denmark�Revenue Forecast
7.1.7 India�Revenue Forecast
7.1.8 Liberia�Revenue Forecast
7.1.9 The Netherlands�Revenue Forecast
7.1.10 Norway�Revenue Forecast
7.1.11 Russia�Revenue Forecast
7.1.12 Singapore�Revenue Forecast
7.1.13 UAE�Revenue Forecast
8 Competitive Landscape (Page No. - 112)
8.1 Market Share Analysis, By Company
8.2 Market Share Analysis, By Region
9 Company Profiles (Page No. - 116)
9.1 Kongsberg Maritime As
9.1.1 Overview
9.1.2 Products& Services
9.1.3 Strategy & Insights
9.1.4 Developments
9.1.5 MNM View
9.2 Fugro
9.2.1 Overview
9.2.2 Products and Services
9.2.3 Strategy & Insights
9.2.4 Developments
9.2.5 MNM View
9.3 Raytheon Company
9.3.1 Overview
9.3.2 Products & Services
9.3.3 Strategy & Insights
9.3.4 Developments
9.3.5 MNM View
9.4 Thales
9.4.1 Overview
9.4.2 Products & Services
9.4.3 Strategies & Insights
9.4.4 Developments
9.4.5 MNM View
9.5 Teledyne Reson A/S
9.5.1 Overview
9.5.2 Products & Services
9.5.3 Strategies & Insights
9.5.4 Developments
9.5.5 MNM View
9.6 Atlas Elektronik Gmbh
9.6.1 Overview
9.6.2 Products& Services
9.6.3 Strategy& Insights
9.6.4 Developments
9.7 Ohmex
9.7.1 Overview
9.7.2 Products & Services
9.7.3 Strategies & Insights
9.7.4 Developments
9.8 Seafloor Systems, Inc.
9.8.1 Overview
9.8.2 Products & Services
9.8.3 Strategies& Insight
9.8.4 Developments
9.9 Iic Technologies
9.9.1 Overview
9.9.2 Products & Services
9.9.3 Strategy & Insights
9.9.4 Developments
9.10 Teledyne Odom Hydrographic, Inc.
9.10.1 Overview
9.10.2 Products & Services
9.10.3 Startegy & Insights
9.10.4 Developments
Appendix (Page No. - 155)
Summary Heading
List of Tables (57 Tables)
Table 1 Hydrographic Equipment Market Size, 2014�2020 ($Million)
Table 2 Market Size, By Application, 2014�2020 ($Million)
Table 3 Market Size, By Product, 2014�2020 ($Million)
Table 4 Africa: Hydrographic Equipment Market Size, 2014�2020 ($Million)
Table 5 Africa: Market Size, By Application, 2014�2020 ($Million)
Table 6 Africa: Market Size, By Product, 2014�2020 ($Million)
Table 7 Americas: Hydrographic Equipment Market Size, 2014�2020 ($Million)
Table 8 Americas: Market Size, By Application, 2014�2020 ($Million)
Table 9 Americas: Market Size, By Product, 2014�2020 ($Million)
Table 10 APAC: Hydographic Equipment Market Size, 2014�2020 ($Million)
Table 11 APAC: Market Size, By Application, 2014�2020 ($Million)
Table 12 APAC: Market Size, By Product, 2014�2020 ($Million)
Table 13 Europe: Hydrographic Equipment Market Size, 2014�2020 ($Million)
Table 14 Europe: Market Size, By Application, 2014�2020 ($Million)
Table 15 Europe: Market Size, By Product, 2014�2020 ($Million)
Table 16 The Middle East: Hydrographic Equipment Market Size, 2014�2020 ($Million)
Table 17 The Middle East: Hydrographic Equipment Market Size, By Application, 2014�2020 ($Million)
Table 18 The Middle East: Hydrographic Equipment Market Size, By Product, 2014�2020 ($Million)
Table 19 U.S.: Hydrographic Equipment Market Size, 2014�2020 ($Million)
Table 20 U.S.: Market Value, , By Application, 2014�2020 ($Million)
Table 21 U.S.: Market Size, By Product, 2014�2020 ($Million)
Table 22 U.K.: Hydrographic Equipment Market Size, 2014�2020 ($Million)
Table 23 U.K.: Market Size, By Application, 2014�2020 ($Million)
Table 24 U.K.: Market Size, By Product, 2014�2020 ($Million)
Table 25 Australia: Hydrographic Equipment Market Size, 2014�2020 ($Million)
Table 26 Australia: Market Value, By Application, 2014-2020 ($Million)
Table 27 Australia: Market Size, By Product, 2014�2020 ($Million)
Table 28 Brazil: Hydrographic Equipment Market Size, 2014�2020 ($Million)
Table 29 Brazil: Market Size, By Application, 2014�2020 ($Million)
Table 30 Brazil: Market Size, By Product, 2014�2020 ($Million)
Table 31 Canada: Hydrographic Equipment Market Size, 2014-2020 ($Million)
Table 32 Canada: Market Size, By Application, 2014�2020 ($Million)
Table 33 Canada: Market Size, By Product, 2014�2020 ($Million)
Table 34 Denmark: Hydrographic Equipment Market Size, 2014�2020 ($Million)
Table 35 Denmark: Market Size, By Application, 2014�2020 ($Million)
Table 36 Denmark: Market Size, By Product, 2014�2020 ($Million)
Table 37India: Hydrographic Equipment Market Size, 2014�2020 ($Million)
Table 38 India: Market Size, By Application, 2014�2020 ($Million)
Table 39 India: Market Size, By Product, 2014�2020 ($Million)
Table 40 Liberia: Hydrographic Equipment Market Size, 2014�2020 ($Million)
Table 41 Liberia: Market Size, By Application, 2014�2020 ($Million)
Table 42 Liberia: Market Size, By Product, 2014�2020 ($Million)
Table 43 The Netherlands: Hydrographic Equipment Market Size, 2014�2020 ($Million)
Table 44 Netherlands: Market Size, By Application, 2014�2020 ($Million)
Table 45 The Netherlands: Hydrographic Equipment Market Size, By Product, 2014�2020 ($Million)
Table 46 Norway: Hydrographic Equipment Market Size, 2014�2020 ($Million)
Table 47 Norway: Market Size, By Application, 2014�2020 ($Million)
Table 48 Norway: Market Size, By Product, 2014�2020 ($Million)
Table 49 Russia: Hydrographic Equipment Market Size, 2014�2020 ($Million)
Table 40 Russia: Market Size, By Application, 2014�2020 ($Million)
Table 51 Russia: Market Size, By Product, 2014�2020 ($Million)
Table 52 Singapore: Hydrographic Equipment Market Size, 2014�2020 ($Million)
Table 53 Singapore: Market Size, By Application, 2014�2020 ($Million)
Table 54 Singapore: Market Size, By Product, 2014�2020 ($Million)
Table 55 UAE: Hydrographic Equipment Market Size, 2014�2020 ($Million)
Table 56 UAE: Market Size, By Application, 2014�2020 ($Million)
Table 57 UAE: Market Size, By Product, 2014�2020 ($Million)
List of Figures (12 Figures)
Figure 1 Global Hydrographic Equipment Market: Markets Covered
Figure 2 Research Methodology
Figure 3 Market Size Estimation Methodology
Figure 4 Global Hydrographic Equipment Market: Data Triangulation
Figure 5 Global Market: Assumptions and Description
Figure 6 Africa: Market Share, 2014�2020 (%)
Figure 7 Americas: Market Share, 2014�2020 (%)
Figure 8 APAC: Marketshare, 2014�2020 (%)
Figure 9 Europe: Market Share, 2014�2020 (%)
Figure 10 The Middle East: Market Share, 2014�2020 (%)
Figure 11 Market Share Analysis, By Company
Figure 12 Market Share Analysis, By Region


Growth opportunities and latent adjacency in Hydrographic Equipment Market