Hydrographic Survey Equipment Market by Type (Sensing System, Positioning System, Subsea Sensor, Unmanned Vehicle, Software), Application (Port & Harbor, Oil & Gas, Cable, Charting), Depth, Platform, End User, and Region - Global Forecast to 2022


[196 Pages Report] The hydrographic survey equipment market is projected to grow from USD 2.07 Billion in 2016 to USD 2.74 Billion by 2022, at a CAGR of 5.39% from 2017 to 2022 during the forecast period. The base year considered for the study is 2016 and the forecast period is from 2017 to 2022.
Objectives of the Study:
The report analyzes the hydrographic survey equipment market based on type (sensing systems, positioning systems, subsea sensors, software, unmanned vehicles, and others), depth (shallow water, deep water), platform (surface vehicles, UUVs & USVs, and aircraft), application (charting application, offshore oil & gas survey, port & harbor management, cable/pipeline route survey, hydrographic/bathymetric survey, and others), end user (commercial, research, defense), and region (North America, Europe, Asia Pacific, Latin America and Middle East and Africa).
The report provides in-depth market intelligence regarding the hydrographic survey equipment market and major factors, including drivers, restraints, opportunities, and challenges that are expected to influence the growth of the market. It also provides an analysis of micromarkets with respect to individual growth trends, growth prospects, and their contribution to the overall market.
The report also covers competitive developments such as contracts, new product launches and developments, and research & development activities in the hydrographic survey equipment market, in addition to business and corporate strategies adopted by key market players.
The hydrographic survey equipment market is estimated at USD 2.11 Billion in 2017 and is projected to reach USD 2.74 Billion by 2022, at a CAGR of 5.39% from 2017 to 2022. Various factors, such as rising maritime trade, increase in demand for accurate nautical charts, and coastal zone management & development are expected to drive the hydrographic survey equipment market.
Among types, the unmanned vehicles segment is estimated to account for the largest share in the hydrographic survey equipment market in 2017. Growth in the unmanned vehicles segment is attributed to the increased demand for unmanned vehicles from the commercial sector, owing to their application for deep water exploration and production activities, drilling support and pipeline inspection, and hydrographic surveys.
Among depths, the shallow water segment is estimated to account for the largest share in the hydrographic survey equipment market in 2017. The shallow water basins in North America, Europe, Asia Pacific, and the Middle East are expected to play a key role in driving the hydrographic survey equipment market.
Among applications, the offshore oil & gas survey segment is estimated to account for the largest share in the hydrographic survey equipment market in 2017. Increasing investments in offshore oil & gas exploration activities by emerging economies, such as India, China, South Korea, and Brazil is driving the hydrographic survey equipment market.
Among end users, the commercial segment is projected to be the fastest-growing market during the forecast period in the hydrographic survey equipment market. Increase in dredging operations, pipeline & cable laying, oil & gas exploration, offshore surveys, and drilling activities by commercial companies is expected to drive this segment.
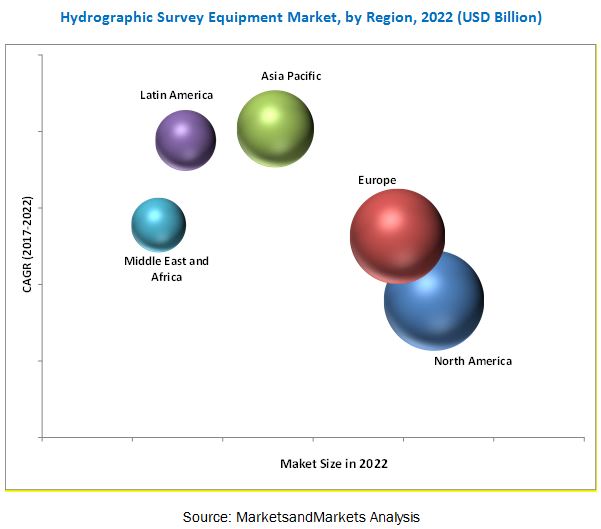
North America is estimated to account for the largest share in the hydrographic survey equipment market in 2017, which includes the US and Canada. The US is leading the market for hydrographic survey equipment in North America. Factors responsible for the leading position of North America are the extensive use of hydrographic survey equipment in dredging, subsea research activities, and oil and gas exploration in the region.
However, factors including the high costs associated with carrying out hydrographic surveys and lack of technical expertise in undertaking hydrographic surveys is expected to restrain the growth of the hydrographic survey equipment market in the near future. Issues related to the management of the high volume of survey data is a key challenge in the growth of the hydrographic survey equipment market.
The types of hydrographic survey equipment offered by various companies in the market have been listed in this report. The recent developments section of the report lists the latest and important developments by companies in the hydrographic survey equipment market between 2014 and 2017. The major players in the hydrographic survey equipment market are Kongsberg Maritime (Norway), Teledyne Technologies (US), INNOMAR Technologie GmbH (Germany), Edgetech (US), Sonardyne International (UK), iXblue SaS (France), and SyQwest Inc. (UK), among others. New product launches and contracts accounted for a major share of all the growth strategies adopted by leading players in the hydrographic survey equipment market.
To speak to our analyst for a discussion on the above findings, click Speak to Analyst
 Exclusive indicates content/data unique to MarketsandMarkets and not available with any competitors.
Table of Contents
1 Introduction (Page No. - 19)
1.1 Objectives of the Study
1.2 Market Definition
1.3 Study Scope
1.3.1 Markets Covered
1.3.2 Regional Scope
1.3.3 Years Considered for the Study
1.4 Currency
1.5 Study Limitations
1.6 Market Stakeholders
2 Research Methodology (Page No. - 23)
2.1 Research Data
2.1.1 Secondary Data
2.1.1.1 Key Data From Secondary Sources
2.1.2 Primary Data
2.1.2.1 Key Data From Primary Sources
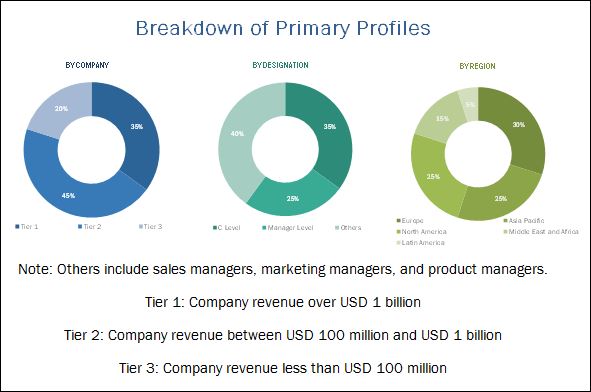
2.1.2.2 Breakdown of Primaries
2.2 Factor Analysis
2.3 Market Size Estimation
2.3.1 Bottom-Up Approach
2.3.2 Top-Down Approach
2.4 Market Breakdown & Data Triangulation
2.5 Research Assumptions
3 Executive Summary (Page No. - 32)
4 Premium Insights (Page No. - 36)
4.1 Attractive Market Opportunities in the Hydrographic Survey Equipment Market
4.2 Hydrographic Survey Equipment Market, By Type
4.3 Market, By Depth
4.4 Market, By Platform
4.5 Hydrographic Survey Equipment Market, By Application
4.6 Market, By Region
5 Market Overview (Page No. - 39)
5.1 Introduction
5.2 Market Segmentation
5.3 Market Dynamics
5.3.1 Drivers
5.3.1.1 Rise in Offshore Renewable Wind Energy Projects
5.3.1.2 Rise in Maritime Commerce and Transport
5.3.1.3 Increase in the Use of AUV and ROV
5.3.2 Restraints
5.3.2.1 High Investment Cost and Seasonal Demand Affecting Sales of Hydrographic Survey Equipment
5.3.2.2 Lack of Skilled Professional to Operate Hydrographic Survey Equipment
5.3.3 Opportunities
5.3.3.1 Technological Advancements in Hydrographic Survey Equipment
5.3.3.2 Rise in Offshore Oil and Gas Exploration Expenditure
5.3.4 Challenges
5.3.4.1 Fluctuations in the Oil & Gas Industry
5.4 Hydrographic Survey Service Industry
5.4.1 Revenue of the Top Companies in the Hydrographic Survey Services Market
5.4.2 Major Contracts in Hydrography Survey Service Industry, 2017
6 Industry Trends (Page No. - 47)
6.1 Introduction
6.2 Industry Trends
6.2.1 Shift From 2D Data to 3D and 4D Data
6.2.2 Lasers/Lidar Technology in Surveying
6.2.3 Data-Centricity in Surveying
6.2.4 USVS & UUVS: A New Tool in the Hydrographic Survey Equipment Market
6.3 Technology Trends
6.3.1 Mems-Based Inertial Systems for Hydrography
6.3.2 Synthetic Aperture Sonar
6.3.3 Interferometric Sonar
6.3.4 Tidal Constituent and Residual Interpolation (TCARI)
6.4 Strategic Benchmarking
6.4.1 Technology Integration & Product Enhancement
6.5 Key Trend Analysis
6.6 Innovation & Patent Registrations
6.7 Hydrographic Survey Equipment Regulatory Bodies, By Region
7 Hydrographic Survey Equipment Market, By Type (Page No. - 56)
7.1 Introduction
7.2 Sensing Systems
7.2.1 Bathymetric Systems
7.2.1.1 Single Beam Echo Sounders (SBES)
7.2.1.2 Multi-Beam Echo Sounders (MBES)
7.2.1.3 Interferometric Sonars
7.2.2 Side-Scan Sonars
7.2.3 Sub-Bottom Profilers
7.2.4 Synthetic Aperture Sonars (SAS)
7.3 Positioning Systems
7.3.1 Inertial Navigation Systems (INS)
7.3.2 Acoustic Positioning Systems (LBL, SBL, and USBL)
7.3.3 Satellite-Based Positioning Systems
7.3.4 Land-Based Positioning Systems
7.4 Subsea Sensors
7.4.1 Motion Reference Units
7.4.2 Tide Gauges & Wave Recorders
7.4.3 Magnetometers
7.4.4 Current Meters
7.4.5 Profilers (Sound Velocity and Ctd Systems)
7.5 Software
7.5.1 Data Acquisition Software
7.5.2 Data Processing Software
7.5.3 Database Management Software
7.6 Unmanned Vehicles
7.6.1 Unmanned Underwater Vehicles (UUVS)
7.6.1.1 Autonomous Underwater Vehicles (AUVs)
7.6.1.2 Remotely Operated Vehicles (ROVs)
7.6.2 Unmanned Surface Vehicles (USVS)
7.7 Others
8 Hydrographic Survey Equipment Market, By Depth (Page No. - 69)
8.1 Introduction
8.2 Shallow Water
8.3 Deep Water
9 Global Hydrographic Survey Payloads Market, By Platform (Page No. - 73)
9.1 Introduction
9.2 Surface Vessels
9.3 USVS & UUVS
9.4 Aircraft
10 Hydrographic Survey Equipment Market, By Application (Page No. - 77)
10.1 Introduction
10.2 Hydrographic/Bathymetry Survey
10.3 Port & Harbor Management
10.4 Offshore Oil & Gas Survey
10.5 Cable/Pipeline Route Survey
10.6 Charting Application
10.7 Others
11 Hydrographic Survey Equipment Market, By End User (Page No. - 84)
11.1 Introduction
11.2 Commercial
11.3 Research
11.4 Defense
12 Regional Analysis (Page No. - 88)
12.1 Introduction
12.2 North America
12.2.1 By Type
12.2.2 By Depth
12.2.3 By Platform
12.2.4 By Application
12.2.5 By End User
12.2.6 By Country
12.2.6.1 Us
12.2.6.1.1 By Type
12.2.6.1.2 By Application
12.2.6.2 Canada
12.2.6.2.1 By Type
12.2.6.2.2 By Application
12.3 Europe
12.3.1 By Type
12.3.2 By Depth
12.3.3 By Platform
12.3.4 By Application
12.3.5 By End User
12.3.6 By Country
12.3.6.1 UK
12.3.6.1.1 By Type
12.3.6.1.2 By Application
12.3.6.2 Norway
12.3.6.2.1 By Type
12.3.6.2.2 By Application
12.3.6.3 Netherlands
12.3.6.3.1 By Type
12.3.6.3.2 By Application
12.3.6.4 Russia
12.3.6.4.1 By Type
12.3.6.4.2 By Application
12.3.6.5 Rest of Europe
12.3.6.5.1 By Type
12.3.6.5.2 By Application
12.4 Asia Pacific
12.4.1 By Type
12.4.2 By Depth
12.4.3 By Platform
12.4.4 By Application
12.4.5 By End User
12.4.6 By Country
12.4.6.1 China
12.4.6.1.1 By Type
12.4.6.1.2 By Application
12.4.6.2 India
12.4.6.2.1 By Type
12.4.6.2.2 By Application
12.4.6.3 Malaysia
12.4.6.3.1 By Type
12.4.6.3.2 By Application
12.4.6.4 Rest of Asia Pacific
12.4.6.4.1 By Type
12.4.6.4.2 By Application
12.5 Latin America
12.5.1 By Type
12.5.2 By Depth
12.5.3 By Platform
12.5.4 By Application
12.5.5 By End User
12.5.6 By Country
12.5.6.1 Brazil
12.5.6.1.1 By Type
12.5.6.1.2 By Application
12.5.6.2 Mexico
12.5.6.2.1 By Type
12.5.6.2.2 By Application
12.5.6.3 Rest of Latin America
12.5.6.3.1 By Type
12.5.6.3.2 By Application
12.6 Middle East and Africa
12.6.1 By Type
12.6.2 By Depth
12.6.3 By Platform
12.6.4 By Application
12.6.5 By End User
12.6.6 By Country
12.6.6.1 Saudi Arabia
12.6.6.1.1 By Type
12.6.6.1.2 By Application
12.6.6.2 UAE
12.6.6.2.1 By Type
12.6.6.2.2 By Application
12.6.6.3 Nigeria
12.6.6.3.1 By Type
12.6.6.3.2 By Application
12.6.6.4 Rest of Middle East and Africa
12.6.6.4.1 By Type
12.6.6.4.2 By Application
13 Competitive Landscape (Page No. - 138)
13.1 Introduction
13.1.1 Dynamic Differentiator
13.1.2 Innovators
13.1.3 Visionary Leader
13.1.4 Emerging Countries
13.2 Competitive Benchmarking
13.2.1 Strength of Product Portfolio
13.2.2 Business Strategy Excellence
14 Company Profiles (Page No. - 142)
(Overview, Products and Services, Financials, Strategy & Development)*
14.1 Kongsberg Gruppen Asa
14.2 Teledyne Technologies Inc.
14.3 Innomar Technologie GmbH
14.4 Edgetech
14.5 Sonardyne International Ltd.
14.6 Mitcham Industries Inc.
14.7 Tritech International Ltd
14.8 Ixblue SAS
14.9 Syqwest Inc.
14.10 Sonartech/Sonarbeam
14.11 Valeport Ltd.
14.12 Xylem, Inc.
14.13 Chesapeake Technology Corp.
14.14 Saab AB
14.15 Environmental Systems Research Institute, Inc. (ESRI)
*Details on Overview, Products and Services, Financials, Strategy & Development Might Not Be Captured in Case of Unlisted Companies
15 Appendix (Page No. - 188)
15.1 Discussion Guide
15.2 Knowledge Store: Marketsandmarkets’ Subscription Portal
15.3 Introducing RT: Real-Time Market Intelligence
15.4 Available Customizations
15.5 Related Reports
15.6 Author Details
List of Tables (102 Tables)
Table 1 2D vs 3D/4D Data
Table 2 Lasers/Lidar Technology Products
Table 3 Usv/Uuv Products
Table 4 Key Trend Analysis in the Hydrographic Survey Equipments Market, 2017
Table 5 Important Innovation & Patent Registrations, 2011-2017
Table 6 Hydrographic Survey Equipments Market, By Type, 2015-2022 (USD Million)
Table 7 Sensing Systems Segment, By Subsegment, 2015–2022 (USD Million)
Table 8 Positioning Systems Segment, By Subsegment, 2015–2022 (USD Million)
Table 9 Subsea Sensors Segment, By Subsegment, 2015–2022 (USD Million)
Table 10 Software Segment, By Region, 2015–2022 (USD Million)
Table 11 Data Acquisition Software List
Table 12 Data Processing Software List
Table 13 Database Management Software List
Table 14 Unmanned Vehicles Segment, By Subsegment, 2015–2022 (USD Million)
Table 15 Unmanned Underwater Vehicles (UUVS) Subsegment, By Type, 2015–2022 (USD Million)
Table 16 Unmanned Surface Vehicles (USVS) Subsegment, By Region, 2015–2022 (USD Million)
Table 17 Others Segment, By Region, 2015–2022 (USD Million)
Table 18 Hydrographic Survey Equipments Market, By Depth, 2015-2022 (USD Million)
Table 19 Shallow Water Segment, By Region, 2015–2022 (USD Million)
Table 20 Deep Water Segment, By Region, 2015–2022 (USD Million)
Table 21 Global Hydrographic Survey Payloads Market , By Platform, 2015-2022 (USD Million)
Table 22 Surface Vessels Segment, By Region, 2015–2022 (USD Million)
Table 23 UUVS & USVS Segment, By Region, 2015–2022 (USD Million)
Table 24 Aircraft Segment, By Region, 2015–2022 (USD Million)
Table 25 Hydrographic Survey Equipments Market Size, By Application, 2015-2022 (USD Million)
Table 26 Hydrographic/Bathymetry Survey Segment, By Region, 2015–2022 (USD Million)
Table 27 Port & Harbor Management Segment, By Region, 2015–2022 (USD Million)
Table 28 Offshore Oil & Gas Survey Segment, By Region, 2015–2022 (USD Million)
Table 29 Cable/Pipeline Route Survey Segment, By Region, 2015–2022 (USD Million)
Table 30 Charting Application Segment, By Region, 2015–2022 (USD Million)
Table 31 Others Segment, By Region, 2015–2022 (USD Million)
Table 32 Hydrographic Survey Equipments Market, By End User, 2015-2022 (USD Million)
Table 33 Commercial Segment, By Region, 2015–2022 (USD Million)
Table 34 Research Segment, By Region, 2015–2022 (USD Million)
Table 35 Defense Segment, By Region, 2015–2022 (USD Million)
Table 36 Market Size, By Region, 2015-2022 (USD Million)
Table 37 North America: Hydrographic Survey Equipments Market Size, By Type, 2015-2022 (USD Million)
Table 38 North America Market Size, By Depth, 2015-2022 (USD Million)
Table 39 North America Market Size, By Platform, 2015-2022 (USD Million)
Table 40 North America Market Size, By Application, 2015-2022 (USD Million)
Table 41 North America Market Size, By End User, 2015-2022 (USD Million)
Table 42 North America Market Size, By Country, 2015-2022 (USD Million)
Table 43 US Hydrographic Survey Equipments Market Size, By Type, 2015-2022 (USD Million)
Table 44 US Market Size, By Application, 2015-2022 (USD Million)
Table 45 Canada Market Size, By Type, 2015-2022 (USD Million)
Table 46 Canada Market Size, By Application, 2015-2022 (USD Million)
Table 47 Europe Hydrographic Survey Equipments Market Size, By Type, 2015-2022 (USD Million)
Table 48 Europe Market Size, By Depth, 2015-2022 (USD Million)
Table 49 Europe Market Size, By Platform, 2015-2022 (USD Million)
Table 50 Europe Market Size, By Application, 2015-2022 (USD Million)
Table 51 Europe Hydrographic Survey Equipments Market Size, By End User, 2015-2022 (USD Million)
Table 52 Europe Market Size, By Country, 2015-2022 (USD Million)
Table 53 UK Market Size, By Type, 2015-2022 (USD Million)
Table 54 UK Market Size, By Application, 2015-2022 (USD Million)
Table 55 Norway Market Size, By Type, 2015-2022 (USD Million)
Table 56 Norway Hydrographic Survey Equipments Market Size, By Application, 2015-2022 (USD Million)
Table 57 Netherlands Market Size, By Type, 2015-2022 (USD Million)
Table 58 Netherlands Market Size, By Application, 2015-2022 (USD Million)
Table 59 Russia Hydrographic Survey Equipments Market Size, By Type, 2015-2022 (USD Million)
Table 60 Russia Market Size, By Application, 2015-2022 (USD Million)
Table 61 Rest of Europe Market Size, By Type, 2015-2022 (USD Million)
Table 62 Rest of Europe Market Size, By Application, 2015-2022 (USD Million)
Table 63 Asia Pacific Market Size, By Type, 2015-2022 (USD Million)
Table 64 Asia Pacific Market Size, By Depth, 2015-2022 (USD Million)
Table 65 Asia Pacific Market Size, By Platform, 2015-2022 (USD Million)
Table 66 Asia Pacific Hydrographic Survey Equipments Market Size, By Application, 2015-2022 (USD Million)
Table 67 Asia Pacific Market Size, By End User, 2015-2022 (USD Million)
Table 68 Asia Pacific Market Size, By Country, 2015-2022 (USD Million)
Table 69 China Market Size, By Type, 2015-2022 (USD Million)
Table 70 China Market Size, By Application, 2015-2022 (USD Million)
Table 71 India Market Size, By Type, 2015-2022 (USD Million)
Table 72 India Market Size, By Application, 2015-2022 (USD Million)
Table 73 Malaysia Hydrographic Survey Equipments Market Size, By Type, 2015-2022 (USD Million)
Table 74 Malaysia Market Size, By Application, 2015-2022 (USD Million)
Table 75 Rest of Asia Pacific Hydrographic Survey Equipments Market Size, By Type, 2015-2022 (USD Million)
Table 76 Rest of Asia Pacific Market Size, By Application, 2015-2022 (USD Million)
Table 77 Latin America Market Size, By Type, 2015-2022 (USD Million)
Table 78 Latin America Market Size, By Depth, 2015-2022 (USD Million)
Table 79 Latin America Market Size, By Platform, 2015-2022 (USD Million)
Table 80 Latin America Market Size, By Application, 2015-2022 (USD Million)
Table 81 Latin America Market Size, By End User, 2015-2022 (USD Million)
Table 82 Latin America Market Size, By Country, 2015-2022 (USD Million)
Table 83 Brazil Hydrographic Survey Equipment Market Size, By Type, 2015-2022 (USD Million)
Table 84 Brazil Market Size, By Application, 2015-2022 (USD Million)
Table 85 Mexico Hydrographic Survey Equipment Market Size, By Type, 2015-2022 (USD Million)
Table 86 Mexico Market Size, By Application, 2015-2022 (USD Million)
Table 87 Rest of Latin America Market Size, By Type, 2015-2022 (USD Million)
Table 88 Rest of Latin America Market Size, By Application, 2015-2022 (USD Million)
Table 89 Middle East and Africa Hydrographic Survey Equipment Market Size, By Type, 2015-2022 (USD Million)
Table 90 Middle East and Africa Market Size, By Depth, 2015-2022 (USD Million)
Table 91 Middle East and Africa Market Size, By Platform, 2015-2022 (USD Million)
Table 92 Middle East and Africa Hydrographic Survey Equipment Market Size, By Application, 2015-2022 (USD Million)
Table 93 Middle East and Africa Market Size, By End User, 2015-2022 (USD Million)
Table 94 Middle East and Africa Market Size, By Country, 2015-2022 (USD Million)
Table 95 Saudi Arabia Hydrographic Survey Equipment Market Size, By Type, 2015-2022 (USD Million)
Table 96 Saudi Arabia Market Size, By Application, 2015-2022 (USD Million)
Table 97 UAE Market Size, By Type, 2015-2022 (USD Million)
Table 98 UAE Market Size, By Application, 2015-2022 (USD Million)
Table 99 Nigeria Market Size, By Type, 2015-2022 (USD Million)
Table 100 Nigeria Market Size, By Application, 2015-2022 (USD Million)
Table 101 Rest of Middle East and Africa Market Size, By Type, 2015-2022 (USD Million)
Table 102 Rest of Middle East and Africa Market Size, By Application, 2015-2022 (USD Million)
List of Figures (48 Figures)
Figure 1 Global Hydrographic Survey Equipment: Markets Covered
Figure 2 Years Considered for the Study
Figure 3 Research Process Flow
Figure 4 Hydrographic Survey Equipment Market: Research Design
Figure 5 Breakdown of Primary Interviews: By Company Type, Designation, and Region
Figure 6 Market Size Estimation Methodology: Bottom-Up Approach
Figure 7 Market Size Estimation Methodology: Top-Down Approach
Figure 8 Data Triangulation
Figure 9 Assumptions of the Research Study
Figure 10 Regional Analysis: Global Hydrographic Survey Equipment Market
Figure 11 The Unmanned Vehicles Segment is Expected to Witness the Highest Growth During Forecast Period
Figure 12 The Unmanned Underwater Vehicles (UUVS) Subsegment of the Unmanned Vehicles Segment is Projected to Grow at A Higher CAGR During the Forecast Period
Figure 13 The Offshore Oil & Gas Survey Segment is Expected to Be the Largest Application Segment in 2017 of the Hydrographic Survey Equipment Market During the Forecast Period
Figure 14 The Shallow Water Segment is Expected to Be A Larger Segment of the Hydrographic Survey Equipment Market During the Forecast Period
Figure 15 Increasing Investments in Offshore Oil & Gas Exploration Activities is Expected to Drive the Demand for Hydrographic Survey Equipment During the Forecast Period
Figure 16 Based on Type, the Unmanned Vehicles Segment is Projected to Be the Largest Segment of the Market During Forecast Period
Figure 17 Based on Depth, the Shallow Water Segment is Expected to Be A Larger Segment of the Hydrographic Survey Equipment Market During Forecast Period
Figure 18 The UUVS & USVS Segment is Projected to Be the Fastest-Growing Platform Segment of the Hydrography Survey Equipment Market During the Forecast Period
Figure 19 The Offshore Oil & Gas Survey Segment is Projected to Be the Largest Application Segment of the Hydrographic Survey Equipment Market During Forecast Period
Figure 20 North America is Estimated to Be the Largest Market for Hydrographic Survey Equipment Market in 2017
Figure 21 Market, By Type
Figure 22 Market, By Application
Figure 23 Market, By Platform
Figure 24 Market, By End User
Figure 25 Market: Drivers, Restraints, Opportunities, and Challenges
Figure 26 Global Annual Cumulative Installed Capacity in Offshore Wind Energy, 2012-2016, (Mw)
Figure 27 Development in Maritime Trade, By Cargo Transported, 2012-2015
Figure 28 Industry Trends in Hydrography Survey Equipment Market
Figure 29 Technology Trends in Hydrographic Survey Equipment Market
Figure 30 Strategic Benchmarking: Kongsberg Gruppen has Adopted Both Organic and Inorganic Growth Strategies
Figure 31 Unmanned Vehicles Type Segment is Projected to Grow at the Highest CAGR During the Forecast Period
Figure 32 Deep Water Segment is Projected to Grow at the Highest CAGR During the Forecast Period
Figure 33 UUVS & USVS Platform Segment is Projected to Grow at the Highest CAGR During the Forecast Period
Figure 34 Offshore Oil & Gas Survey Segment is Projected to Grow at the Highest CAGR During the Forecast Period
Figure 35 Commercial End User Segment is Projected to Grow at the Highest CAGR During the Forecast Period
Figure 36 North America is Estimated to Account for the Largest Share of the Hydrographic Survey Equipment Market in 2017
Figure 37 North America Hydrographic Survey Equipment Market Snapshot
Figure 38 Europe Market Snapshot
Figure 39 Asia Pacific Market Snapshot
Figure 40 Latin America Market Snapshot
Figure 41 Middle East and Africa Market Snapshot
Figure 42 Hydrographic Survey Equipment Market (Global) Competitive Leadership Mapping, 2017
Figure 43 Strength of Product Portfolio
Figure 44 Business Strategy Excellence
Figure 45 Kongsberg Gruppen Asa: Company Snapshot
Figure 46 Teledyne Technologies Inc.: Company Snapshot
Figure 47 Xylem Inc.: Company Snapshot
Figure 48 Saab AB: Company Snapshot
Market size estimation for various segments and subsegments of the hydrographic survey equipment market was arrived at by referring to varied secondary sources, such as Hoovers, Bloomberg Businessweek, Factiva, annual reports, and publications, among others. Furthermore, market triangulation was performed with the help of statistical techniques using econometric tools. All percentage shares, splits, and breakdowns were determined using secondary sources and verified through primary sources. All possible parameters that affect the market have been accounted for, viewed in extensive detail, verified through primary research, and analyzed to acquire the final quantitative and qualitative data. This data was consolidated with detailed inputs and analysis from MarketsandMarkets, and presented in this report.
To know about the assumptions considered for the study, download the pdf brochure
The hydrographic survey equipment market ecosystem comprises manufacturers such as Kongsberg Maritime (Norway), Teledyne Technologies (US), INNOMAR Technologie GmbH (Germany), Edgetech (US), Sonardyne International (UK), iXblue SaS (France), and SyQwest Inc. (UK), among others.
Key Target Audience
- Survey Equipment Suppliers
- Survey Equipment Manufacturers
- Survey Training Bodies
- Technology Support Providers
- Regulatory Bodies
- Software/Hardware/Service and Solution Providers
- Hydrographic Survey Companies
- Original Equipment Manufacturers (OEMs)
Scope of the Report
This research report categorizes the hydrographic survey equipment market into the following segments and subsegments:
-
Hydrographic Survey Equipment Market, By Type
- Sensing Systems
- Positioning Systems
- Subsea Sensors
- Software
- Unmanned Vehicles
- Others
-
Hydrographic Survey Equipment Market, By Depth
- Shallow Water
- Deep Water
-
Hydrographic Survey Equipment Market, By Platform
- Surface Vehicles
- UUVs & USVs
- Aircraft
-
Hydrographic Survey Equipment Market, By Application
- Charting Application
- Offshore Oil & Gas Survey
- Port & Harbor Management
- Cable/Pipeline Route Survey
- Hydrographic/Bathymetric Survey
- Others
-
Hydrographic Survey Equipment Market, By End User
- Commercial
- Research
- Defense
-
Hydrographic Survey Equipment Market, by Region
- North America
- Europe
- Asia Pacific
- Latin America
- Middle East and Africa
Customizations available for the report:
Along with the given market data, MarketsandMarkets offers customizations as per the specific needs of the company. The following customization options are available for the report:
-
Company Information
- Detailed analysis and profiles of additional market players (up to five)


Growth opportunities and latent adjacency in Hydrographic Survey Equipment Market
I would like to have an idea of the market demand for hydrographic survey equipment in Africa, especially Nigeria.
Which companies provide Ultra Deep Water Hydrograph survey equipment with Multi-beam Echo sounder, water depth: 11,000 Meters. Can you provide details of top companies in this domain along with a combined pricing list ?