Industrial Vehicles Market

Industrial Vehicles Market by Vehicle Type (Forklifts, Aisle Trucks, Tow Tractors, Container Handlers), Drive Type (ICE, Battery-operated, Gas-powered), Application, Capacity, Level of Autonomy, & Region - Global Forecast to 2030

Report Code: AT 4611 Apr, 2024, by marketsandmarkets.com

[366 Pages Report] The global industrial vehicles market size is projected to grow from USD 49.2 billion in 2024 to USD 64.3 billion by 2030, at a CAGR of 4.6%. The rapid growth of the e-commerce industry is driving substantial expansion in the global industrial vehicles market, prompting the need for effective material handling solutions. With the continuous rise of online retail, there is a growing requirement for warehouses and distribution centers equipped with industrial vehicles like forklifts and automated guided vehicles (AGVs) to optimize operations. Moreover, heightened attention to workplace safety standards is fueling the adoption of industrial vehicles, aimed at reducing accidents and boosting productivity within industrial environments.

Industrial Vehicles Market

To know about the assumptions considered for the study, Request for Free Sample Report

Industrial Vehicles Market Opportunities

To know about the assumptions considered for the study, download the pdf brochure

Industrial Vehicles Market:

Driver: E-commerce expansion and warehousing dynamics

The e-commerce sector is experiencing remarkable growth, fueled by the widespread adoption of smartphones and internet connectivity. Major players like Amazon and eBay are driving this expansion, offering consumers unparalleled convenience and choice in their shopping experiences. Factors such as easy purchasing, diverse product options, and flexible return policies are enticing consumers to shift towards online shopping, leading to a surge in both Business-to-Consumer (B2C) and Business-to-Business (B2B) transactions across various industries like pharmaceuticals, household goods, and food. As a result, the demand for warehousing facilities is increasing to accommodate the storage and distribution of goods purchased online, driving the growth of the warehousing sector. This, in turn, is expected to boost the demand for industrial vehicles used in logistics and transportation operations as e-commerce businesses seek to optimize their supply chain networks and enhance operational efficiency. Amazon (US) dominates the warehouse segment with over 1,500 warehouses across the UK, France, Germany, Italy, Canada, and the US, out of around 17,000 warehouses considered. Amazon surpasses its closest competitor, Walmart (US), by approximately 80% in warehouse count. Target (US) also holds a significant presence in this market. As more consumers turn to online channels for their shopping needs, there will be a consequent increase in the demand for industrial vehicles to support logistics and transportation operations, reflecting the evolving dynamics of the market.

Restraint: High maintenance and repair costs for industrial vehicles

High maintenance and repair costs in industrial vehicles like forklifts reach trucks, tow tractors, boom lifts, scissor lifts, and others pose a significant market restraint within the industrial vehicles industry. These vehicles are essential for various material handling and lifting tasks in warehouses, construction sites, and manufacturing facilities. However, their complex machinery and heavy usage often lead to frequent maintenance requirements and occasional repairs, resulting in substantial expenses for owners. Skilled technicians are typically needed to diagnose issues and repair, adding to the overall cost. Additionally, downtime during maintenance and repair activities can disrupt operations, impacting productivity and profitability for businesses reliant on these vehicles. The high cost of maintenance and repairs may deter potential buyers from investing in industrial vehicles or prompt them to explore alternative solutions, thereby limiting market growth. Consequently, finding cost-effective maintenance solutions and strategies to minimize repair needs are crucial for addressing this market restraint and fostering industry growth.

Opportunity: Emergence of rental and leasing in the industrial vehicles sector

The industrial vehicles market is witnessing a promising growth trajectory, propelled mainly by the increasing emphasis on rental and leasing services. Leading players such as United Rentals (US) and Big Rentz (US) are at the forefront of this trend. New projects often require industrial vehicles at various locations according to project dynamics, so the flexibility provided by rental and leasing options becomes crucial. Instead of making substantial upfront investments in vehicle purchases, businesses opt for the agility and cost-effectiveness of rental and leasing arrangements. This preference is particularly evident when specialized equipment or short-term usage is needed, making renting or leasing vehicles tailored to specific project needs more financially prudent. Consequently, the growing inclination towards leasing and renting industrial vehicles is anticipated to persist, driven by the demand for flexibility and cost-efficiency in an ever-changing industrial environment.

Challenge: Cost-competitive workforce in emerging markets

Adopting automated technologies across industries faces limitations in countries like India, Mexico, and Nigeria, where labor wages are low. Due to abundant cheap labor, automating industrial facilities may not be economically viable. For instance, the average daily wage of a semiskilled worker in countries like Indonesia and Vietnam is around USD 9 and USD 10, respectively. Similarly, countries like Bangladesh and Mexico also boast low average daily wages, contributing to the reluctance of companies in these emerging economies to invest in automated industrial vehicles like AGVs and electric forklifts. Instead, many manufacturing operations in these countries rely on manual labor and semiautomatic machines, as this approach remains profitable. Consequently, despite advancements in automation, the prevalence of automated technologies in manufacturing facilities in emerging economies remains comparatively lower than in developed countries.

Industrial Vehicles Market: Ecosystem

The industrial vehicles market ecosystem encompasses a diverse array of players, each contributing to developing and delivering cutting-edge solutions. Key participants include industrial vehicle manufacturers, dealers, distributors, and part and component manufacturers. Within this ecosystem, industrial vehicle manufacturers play a central role in designing and producing a wide range of vehicles tailored to specific industrial applications. Dealers and distributors ensure these vehicles' efficient distribution and servicing, connecting manufacturers with end-users across various industries. Additionally, part and component manufacturers supply essential elements such as engines, transmissions, tires, and hydraulic systems, which are essential for the operation and maintenance of industrial vehicles. Collaboration among these stakeholders is vital for driving innovation and meeting the evolving needs of industrial customers. Through strategic partnerships and cooperation, the industrial vehicles market ecosystem strives to deliver reliable, efficient, and cost-effective solutions to enhance productivity and safety in industrial operations. Prominent companies in this market include Toyota Industries Corporation (Japan), KION Group AG (Germany), Mitsubishi Logisnext Co., Ltd. (Japan), Jungheinrich AG (Germany), and Crown Equipment Corporation (US), among others.

Top Companies in Industrial Vehicles Market

The forklift segment is estimated to exhibit the largest growth in the global industrial vehicles market.

The forklift segment holds the largest share in the industrial vehicles market. Despite the rising demand for Internal Combustion Engine (ICE)-operated forklifts, there is a projected significant reduction in the production volume of ICE-operated forklifts in the future due to factors such as the increasing demand for battery-operated forklifts and concerns related to the high-cost and emission levels of ICE forklifts. Factors such as the growth of industrial manufacturing, the rising demand for electric forklifts across various end-use industries, and the introduction of safety and environmental regulations are expected to support the forklift segment in the industrial vehicles market in the coming years.

Industrial vehicle manufacturers consistently focus on new product development and expansion to enhance their respective portfolios. For instance, in May 2023, Linde Material Handling introduced the new X35X50 electric forklift trucks, featuring front-wheel drive and powered by dual permanent magnet-assisted synchronous reluctance motors (SRM+). Similarly, in July 2021, Hangcha Group Co., Ltd. (China) launched its new XH series 2.0t-3.5t electric forklift truck, equipped with high-voltage lithium-ion batteries, delivering superior performance in terms of productivity, efficiency, reduced noise, and zero emission levels.

The warehousing segment is expected to have significant growth in the industrial vehicles market during the forecast period.

Warehousing, a crucial process for storing goods intended for future sale or distribution, enables manufacturers, distributors, and retailers to hold goods while securely monitoring inventory levels. Key material handling equipment in warehouses includes forklifts and conveyors. The demand for industrial vehicles has increased, driven by their numerous advantages, including enhanced efficiency, high accuracy, and reduced resource wastage. Notably, industrial vehicles such as forklifts, tow tractors, and aisle trucks play essential roles in warehouse material handling tasks, including loading and unloading products, pallet movement, and overall goods transportation. These vehicles facilitate swift and safe product movement in confined warehouse spaces, reducing manual material handling-related injuries.

Several factors contribute to the growth of the warehousing segment, including the thriving e-commerce industry and the increasing demand for more efficient and reliable large-order handling methods. Additionally, the trend toward more significant product differentiation and a reduction in pallet sizes is expected to fuel the demand for industrial vehicles in warehouse applications throughout the forecast period. The substantial global expansion in the e-commerce sector is set to drive demand for logistics and warehousing, particularly in the industrial and manufacturing segments. For instance, in November 2023, KION Group AG announced the introduction of 24-volt Fuel Cell Systems for its warehouse trucks, with a production capacity of up to 5,000 fuel cell systems per year at the Hamburg plant. Furthermore, in June 2023, Mitsubishi Logisnext Co., Ltd. and Jungheinrich AG formed a new joint venture named Rocrich AGV Solutions (US), which will offer AGV products from Rocla (Mitsubishi Logisnext Co., Ltd.) and Jungheinrich AG, along with warehouse solutions and production facilities in North America. This surge in demand for warehousing is anticipated to propel the demand for industrial vehicles in the global market.

The chemical segment is expected to have significant growth in the industrial vehicles market during the forecast period.

Industrial vehicles play a crucial role in the chemical industry, where they are extensively utilized for various material handling tasks. These tasks include the movement of heavy drums and containers, loading and unloading raw materials, and transporting finished products. Given the unique material handling requirements of the chemical industry, mainly due to the hazardous nature of the chemicals involved, industrial vehicles like forklifts are well-suited for these applications. They are instrumental in handling drums and containers containing hazardous materials such as acids, alkalis, and solvents. Operators of industrial forklifts undergo specialized training to handle these materials safely, and they are mandated to use personal protective equipment (PPE) such as gloves, goggles, and respirators. Routine operations in the chemical industry entail working with various hazardous chemical compounds, exposing workers in chemical plants to potentially harmful environments. This affects their work efficiency and poses challenges in maintaining maximum production efficiency.

Consequently, companies need to conduct thorough assessments of storage areas and handling practices to prevent accidents. The deployment of non/semi-autonomous and fully autonomous industrial vehicles in chemical manufacturing can significantly enhance work effectiveness and safety. By implementing these vehicles; companies can ensure the safety of employees working with hazardous raw materials, thereby improving the productivity and efficiency of warehousing operations. The demand for chemical end products is on the rise, with China and India anticipated to be the world's largest producers of chemicals during the forecast period. The chemical industry operates under stringent regulations, necessitating standardized systems in warehouses and manufacturing plants to comply with Good Manufacturing Practices (GMP) standards. Industrial vehicles are instrumental in enabling the chemical industry to perform specific functions, such as ensuring specialized storage areas for herbs, narcotics, and hazardous chemicals, minimizing lead time, eliminating errors, ensuring a reliable supply of various chemicals, and facilitating the sorting and control of products that have expired in accordance with GMP standards. Companies such as Jungheinrich AG, Hyster Yale Materials Handling Inc, Hangcha Group Co Ltd, Noblelift Intelligent Equipment Co Ltd, and Konecranes offer a range of industrial vehicles tailored for use in the chemical industry.

"The Asia Pacific industrial vehicles market is projected the largest growth by 2030."

Asia Pacific is estimated to be the largest industrial vehicles market by 2030. The industrial vehicles market is expanding rapidly across Asia Pacific, with individual countries such as China, Japan, India, South Korea, and the rest of the Asia Pacific countries playing a vital role. The region is prominent as a leading producer of industrial vehicles and home to some of the world's fastest-developing economies like China and India. This has fueled a steady rise in industrial vehicle production volumes, with OEMs meeting domestic and international demand. Major manufacturers are expanding their regional presence, catering to the country's rapid material handling equipment market growth. China is poised to lead the industrial vehicles market in Asia Pacific, followed by Japan, driven by factors such as high labor costs, the imperative for enhanced production efficiency, and government incentives for industrial infrastructure development.

Moreover, population growth, increasing GDP, and rising per capita income foster additional opportunities for industrial vehicles across the Asia Pacific. Major industrial vehicle manufacturers, such as Toyota Industries Corporation (Japan), Mitsubishi Logisnext Co., Ltd. (Japan), Anhui Heli Co., Ltd. (China), and more are increasing their presence in the region to cater to the increasing demand. For instance, Cargotec Corporation (Finland) announced in December 2023 that its Kalmar brand is set to start producing electric reach stackers and essential forklift truck range at the company's Shanghai Plant in China. The region's strategic initiatives to enhance industrial efficiency, coupled with substantial investments from major manufacturers, underscore its pivotal role in driving the remarkable growth trajectory of the industrial vehicles market within the Asia Pacific region.

Asia Pacific Industrial Vehicles Market Size, and Share

Key Market Players

The global industrial vehicles market is dominated by major players such as Toyota Industries Corporation (Japan), KION Group AG (Germany), Mitsubishi Logisnext Co., Ltd. (Japan), Jungheinrich AG (Germany), Crown Equipment Corporation (US), and Hyster-Yale Materials Handling, Inc. (US), among others.

Get online access to the report on the World's First Market Intelligence Cloud

  • Easy to Download Historical Data & Forecast Numbers
  • Company Analysis Dashboard for high growth potential opportunities
  • Research Analyst Access for customization & queries
  • Competitor Analysis with Interactive dashboard
  • Latest News, Updates & Trend analysis
Request Sample

Scope of the Report

Report Metric

Details

Market size available for years

2019–2030

Base year considered

2023

Forecast period

2024-2030

Forecast units

Value (USD Thousand)

Segments Covered

Vehicle type & capacity, Drive type, Application, Level of autonomy, Aerial work platforms market (by Type)

Geographies covered

Asia Pacific, Europe, North America, and Rest of the World

Companies Covered

Toyota Industries Corporation (Japan), KION Group AG (Germany), Mitsubishi Logisnext Co., Ltd. (Japan), Jungheinrich AG (Germany), and Crown Equipment Corporation (US).
More than 30 major players are covered under the report.

This research report categorizes the industrial vehicles market based on Vehicle type & capacity, Drive type, Application, Level of autonomy, Aerial work platforms market (by Type), and region

Industrial Vehicles Market, By Vehicle Type & Capacity:
  • Forklifts
    • <5 ton
    • 5-10 ton
    • 11-36 ton
    • >36 ton
  • Aisle Trucks
    • <1 ton
    • 1-2 ton
    • >2 ton
  • Tow Tractors
    • <5 ton
    • 5-10 ton
    • 11-30 ton
    • >30 ton
  • Container Handlers
    • <30 ton
    • 30-40 ton
    • >40 ton
  • Automated Guided Vehicles
  • Personnel Carriers
Industrial Vehicles Market, By Drive Type:
  • Internal Combustion Engine Industrial Vehicles
  • Battery-operated Industrial Vehicles
  • Gas-powered Industrial Vehicles
Industrial Vehicles Market, By Application:
  • Manufacturing
    • Chemical
    • Food & Beverages
    • Mining
    • Automotive
    • Metals & Heavy Machinery
    • Others
  • Warehousing
  • Freight & Logistics
  • Others
Industrial Vehicles Market, By Level of Autonomy:
  • Non/Semi-autonomous
  • Autonomous
Aerial Work Platforms Market, By Type:
  • Scissor Lifts
    • Scissor Lifts by Drive Type
  • Boom Lifts
    • Articulating AWP
    • Telescopic AWP
    • Boom Lifts by Drive Type
Industrial Vehicles Market, By Region
  • Asia Pacific
  • Europe
  • North America
  • Rest of the World

Recent Developments

  • In March 2024, EP Equipment (China) announced that Boendgen Baustoffe (Germany) purchased the EFL electric forklift series to upgrade its fleet.
  • In January 2024, Hyster-Yale Materials Handling, Inc. (US) launched the J32-40UTTL Li-Ion forklift truck. The new electric truck has a load-carrying capacity of 1.4 to 1.8 tons.
  • In December 2023, Konecranes (Finland) announced that it had supplied 7 Konecranes SMV 16-1200 C (16 ton) forklifts to Eldorado Brasil (Brazil) along with two gantry cranes in Q3 of 2023.
  • In September 2023, Marvell announced the plans for a new R&D center in Pune, India. This upcoming establishment is expected to double the current workforce capacity.
  • In November 2023, KION Group AG announced the launch of 24-volt Fuel Cell Systems for its warehouse trucks. The company added that up to 5,000 fuel cell systems can be produced yearly at the Hamburg plant. The company has invested around USD 11.9 Million in this project.
  • In September 2023, Toyota Material Handling Japan (TMHJ), a segment of Toyota Industries Corporation, introduced a new fuel cell lift truck (FC lift truck).

Frequently Asked Questions (FAQ):

To speak to our analyst for a discussion on the above findings, click Speak to Analyst

TABLE OF CONTENTS
 
1 INTRODUCTION (Page No. - 40)
    1.1 STUDY OBJECTIVES 
    1.2 MARKET DEFINITION 
           TABLE 1 INDUSTRIAL VEHICLES MARKET DEFINITION, BY VEHICLE TYPE
           TABLE 2 INDUSTRIAL VEHICLES MARKET DEFINITION, BY DRIVE TYPE
           TABLE 3 AERIAL WORK PLATFORM MARKET DEFINITION, BY TYPE
           1.2.1 INCLUSIONS AND EXCLUSIONS
                    TABLE 4 INCLUSIONS AND EXCLUSIONS
    1.3 STUDY SCOPE 
           1.3.1 MARKETS COVERED
                    FIGURE 1 INDUSTRIAL VEHICLES MARKET SEGMENTATION
           1.3.2 REGIONS COVERED
           1.3.3 YEARS CONSIDERED
    1.4 CURRENCY CONSIDERED 
           TABLE 5 CURRENCY EXCHANGE RATES
    1.5 UNIT CONSIDERED 
    1.6 STAKEHOLDERS 
    1.7 SUMMARY OF CHANGES 
 
2 RESEARCH METHODOLOGY (Page No. - 46)
    2.1 RESEARCH DATA 
           FIGURE 2 RESEARCH DESIGN
           FIGURE 3 RESEARCH DESIGN MODEL
           2.1.1 SECONDARY DATA
                    2.1.1.1 Secondary sources for industrial vehicles
                    2.1.1.2 Secondary sources for lifting platforms
                    2.1.1.3 Key data from secondary sources
           2.1.2 PRIMARY DATA
                    FIGURE 4 BREAKDOWN OF PRIMARY INTERVIEWS
                    2.1.2.1 Primary participants
    2.2 MARKET SIZE ESTIMATION 
           FIGURE 5 RESEARCH METHODOLOGY: HYPOTHESIS BUILDING
           2.2.1 BOTTOM-UP APPROACH
                    FIGURE 6 BOTTOM-UP APPROACH
           2.2.2 TOP-DOWN APPROACH
                    FIGURE 7 TOP-DOWN APPROACH
                    FIGURE 8 MARKET ESTIMATION NOTES
                    FIGURE 9 RESEARCH DESIGN AND METHODOLOGY (DEMAND-SIDE)
                    FIGURE 10 MARKET SIZE ESTIMATION METHODOLOGY: BOTTOM-UP (SUPPLY-SIDE) — COLLECTIVE MARKET SHARE OF MAJOR PLAYERS
    2.3 RECESSION IMPACT ANALYSIS 
    2.4 DATA TRIANGULATION 
           FIGURE 11 DATA TRIANGULATION
    2.5 FACTOR ANALYSIS 
           FIGURE 12 FACTORS IMPACTING INDUSTRIAL VEHICLES MARKET
           2.5.1 REGIONAL ECONOMY IMPACT ANALYSIS
                    FIGURE 13 DEMAND- AND SUPPLY-SIDE FACTOR ANALYSIS
    2.6 RESEARCH ASSUMPTIONS 
    2.7 RESEARCH LIMITATIONS 
 
3 EXECUTIVE SUMMARY (Page No. - 62)
    FIGURE 14 INDUSTRIAL VEHICLES MARKET OVERVIEW 
    FIGURE 15 INDUSTRIAL VEHICLES MARKET, BY REGION, 2024–2030 
    FIGURE 16 INDUSTRIAL VEHICLES MARKET, BY DRIVE TYPE, 2024–2030 
 
4 PREMIUM INSIGHTS (Page No. - 66)
    4.1 ATTRACTIVE GROWTH OPPORTUNITIES FOR PLAYERS IN INDUSTRIAL VEHICLES MARKET 
           FIGURE 17 RISING EMPHASIS ON OPTIMIZING LOGISTICS AND WAREHOUSING TO DRIVE MARKET
    4.2 INDUSTRIAL VEHICLES MARKET, BY REGION 
           FIGURE 18 ASIA PACIFIC TO BE LARGEST MARKET FOR INDUSTRIAL VEHICLES DURING FORECAST PERIOD
    4.3 INDUSTRIAL VEHICLES MARKET, BY VEHICLE TYPE 
           FIGURE 19 AISLE TRUCKS TO BE FASTEST-GROWING SEGMENT DURING FORECAST PERIOD
    4.4 INDUSTRIAL VEHICLES MARKET, BY DRIVE TYPE 
           FIGURE 20 BATTERY-OPERATED SEGMENT TO HOLD LARGEST MARKET SHARE DURING FORECAST PERIOD
    4.5 INDUSTRIAL VEHICLES MARKET, BY APPLICATION 
           FIGURE 21 WAREHOUSING SEGMENT TO REGISTER HIGHEST CAGR DURING FORECAST PERIOD
    4.6 AERIAL WORK PLATFORM MARKET, BY TYPE 
           FIGURE 22 BOOM LIFTS SEGMENT TO SECURE LEADING MARKET POSITION DURING FORECAST PERIOD
 
5 MARKET OVERVIEW (Page No. - 70)
    5.1 INTRODUCTION 
    5.2 MARKET DYNAMICS 
           FIGURE 23 INDUSTRIAL VEHICLES MARKET: DRIVERS, RESTRAINTS, OPPORTUNITIES, AND CHALLENGES
           5.2.1 DRIVERS
                    5.2.1.1 E-commerce expansion and warehousing dynamics
                               FIGURE 24 US: QUARTERLY E-COMMERCE RETAIL SALES, 2022–2023
                               FIGURE 25 TOP 10 WAREHOUSING SOLUTION PROVIDERS IN US, BASED ON LAND AREA, 2023
                    5.2.1.2 Impact of warehouse automation and Industry 4.0
                               FIGURE 26 KEY TECHNOLOGIES OF WAREHOUSE AUTOMATION
                               FIGURE 27 AGV AND AMR CHARACTERISTICS IN WAREHOUSE OPERATIONS
                    5.2.1.3 Role of JIT inventory management in industrial logistics
                               FIGURE 28 BENEFITS OF JIT LOGISTICS
                    5.2.1.4 Growing infrastructure developments
                    5.2.1.5 Industrial vehicles as catalysts for enhancing workplace safety
           5.2.2 RESTRAINTS
                    5.2.2.1 Financial implications of automation in forklifts and AGVs
                               TABLE 6 AVERAGE SELLING PRICE OF MANUALLY-OPERATED MATERIAL LIFTS AND AUTONOMOUS FORKLIFTS
                               TABLE 7 AVERAGE SELLING PRICE OF FORKLIFTS VS. AGVS
                    5.2.2.2 High maintenance and repair costs of industrial vehicles
                               TABLE 8 FORKLIFT MAINTENANCE CHECKLISTS RECOMMENDED BY OSHA
                               TABLE 9 AVERAGE COST OF IC FORKLIFT REPLACEMENT AND REPAIRS
                               FIGURE 29 AVERAGE FORKLIFT PART COSTS PER SERVICE INTERVAL
           5.2.3 OPPORTUNITIES
                    5.2.3.1 Emergence of rental and leasing in industrial vehicles sector
                               TABLE 10 AVERAGE COST OF FORKLIFT RENTALS IN US
                    5.2.3.2 Rise of battery-powered industrial vehicles
                               TABLE 11 OEMS AND THEIR KEY ELECTRIC INDUSTRIAL VEHICLE MODELS
                    5.2.3.3 Emerging applications in non-traditional industries
                    5.2.3.4 Technological advancements in autonomous industrial vehicles
                               FIGURE 30 VARIOUS SENSORS USED IN ADVANCED FORKLIFTS
           5.2.4 CHALLENGES
                    5.2.4.1 Workplace safety concerns and government regulations
                               FIGURE 31 FORKLIFT FATALITIES, BY INDUSTRY
                               FIGURE 32 FORKLIFT ACCIDENT STATISTICS
                               FIGURE 33 EMISSION TIER SLABS FOR OFF-ROAD MOBILE MACHINERY AND FORKLIFTS
                    5.2.4.2 Cost-competitive workforce in emerging markets
                               TABLE 12 IMPACT ANALYSIS OF MARKET DYNAMICS
    5.3 PRICING ANALYSIS 
           5.3.1 AVERAGE SELLING PRICE TRENDS, BY VEHICLE TYPE, 2021–2023
                    TABLE 13 AVERAGE SELLING PRICE TRENDS OF KEY PLAYERS, BY VEHICLE TYPE, 2021–2023 (USD)
                    FIGURE 34 AVERAGE SELLING PRICE TRENDS, BY VEHICLE TYPE, 2021–2023 (USD)
           5.3.2 AVERAGE SELLING PRICE TRENDS, BY REGION, 2023
                    TABLE 14 AVERAGE SELLING PRICE TRENDS, BY REGION, 2023 (USD)
                    FIGURE 35 AVERAGE SELLING PRICE TRENDS, BY REGION, 2023 (USD)
    5.4 TOTAL COST OF OWNERSHIP COMPARISON OF ELECTRIC AND ICE FORKLIFTS 
           TABLE 15 PRICES OF EV AND ICE FORKLIFT MODELS IN US (2023)
           FIGURE 36 5-YEAR TOTAL COST OF OWNERSHIP BREAKDOWN
    5.5 BILL OF MATERIALS COMPARISON OF ICE AND ELECTRIC FORKLIFTS 
    5.6 ECOSYSTEM ANALYSIS 
           FIGURE 37 INDUSTRIAL VEHICLES MARKET: ECOSYSTEM ANALYSIS
           TABLE 16 INDUSTRIAL VEHICLES MARKET: ROLE OF COMPANIES IN ECOSYSTEM
    5.7 VALUE CHAIN ANALYSIS 
           FIGURE 38 INDUSTRIAL VEHICLES MARKET: VALUE CHAIN ANALYSIS
    5.8 CASE STUDIES 
           5.8.1 MITSUBISHI FORKLIFT ENHANCES SAFETY AT KELLOGG’S MANCHESTER SITE
           5.8.2 DEMATIC’S AUTONOMOUS FORKLIFT REDUCES DELIVERY TIME AT L’ORÉAL
           5.8.3 THYSSENKRUPP EMPLOYS JUNGHEINRICH AG FOR FLEXIBLE AUTOMATION
           5.8.4 JUNGHEINRICH AG AUTOMATES COKO-WERK GMBH & CO. KG WAREHOUSE
           5.8.5 TOYOTA DELIVERS SUSTAINABLE AGV SOLUTIONS TO PANASONIC ENERGY
           5.8.6 LARGE TOYOTA AGV FLEET HELPS FUTURE-PROOF ALBERT HEIJN’S DISTRIBUTION CENTERS
           5.8.7 TOYOTA’S AUTOMATED FORKLIFTS SUPPORT ELM.LEBLANC’S INDUSTRY 4.0 JOURNEY
           5.8.8 HUBTEX PARTNERS WITH INTIS FOR INDUCTIVE CHARGING SYSTEM FOR AGVS
           5.8.9 PORTS AMERICA REPLACES OLDER CONTAINER HANDLERS WITH HYSTER-YALE’S LIFT TRUCKS
           5.8.10 BEIJER BYGGMATERIAL AB TRANSFORMS ITS FLEET OF DIESEL FORKLIFT TRUCKS TO ELECTRIC FORKLIFT TRUCKS
    5.9 INVESTMENT AND FUNDING SCENARIO 
           FIGURE 39 INVESTMENT AND FUNDING, 2022–2024
           TABLE 17 LIST OF FUNDING, 2022–2024
    5.10 PATENT ANALYSIS 
           5.10.1 INTRODUCTION
                    FIGURE 40 PATENT PUBLICATION TRENDS, 2014–2023
           5.10.2 LEGAL STATUS OF PATENTS
                    FIGURE 41 LEGAL STATUS OF PATENTS FILED FOR INDUSTRIAL VEHICLES, 2014–2023
           5.10.3 TOP PATENT APPLICANTS
                    FIGURE 42 INDUSTRIAL VEHICLE PATENTS, BY OEM (2014–2023)
                    TABLE 18 INDUSTRIAL VEHICLES MARKET: KEY PATENTS
    5.11 TECHNOLOGY ANALYSIS 
           5.11.1 KEY TECHNOLOGIES
                    5.11.1.1 IoT for automated material handling
                               FIGURE 43 IOT-ENABLED WAREHOUSE AND LOGISTICS SYSTEMS
                    5.11.1.2 Smart braking technology for forklifts
           5.11.2 COMPLIMENTARY TECHNOLOGIES
                    5.11.2.1 Collaborative robots
                               FIGURE 44 FEATURES OF AUTONOMOUS MOBILE ROBOTS
                    5.11.2.2 Sustainable forklift technology
                               FIGURE 45 HYDROGEN FUEL CELLS VS. LEAD-ACID BATTERIES
                               FIGURE 46 ADVANTAGES OF HYDROGEN FUEL CELLS
           5.11.3 ADJACENT TECHNOLOGIES
                    5.11.3.1 5G connectivity for automated warehouses
                    5.11.3.2 AI
                               FIGURE 47 BENEFITS OF AI FOR FORKLIFTS IN WAREHOUSES
    5.12 INDUSTRIAL VEHICLE OFFERINGS BY KEY PLAYERS 
    5.13 TRADE ANALYSIS 
           5.13.1 IMPORT/EXPORT SCENARIO (HS CODE 842710)
                    TABLE 19 IMPORT DATA FOR HS CODE 842710, BY COUNTRY, 2020–2022 (USD MILLION)
                    TABLE 20 EXPORT DATA FOR HS CODE 842710, BY COUNTRY, 2020–2022 (USD MILLION)
           5.13.2 IMPORT/EXPORT SCENARIO (HS CODE 8427)
                    TABLE 21 IMPORT DATA FOR HS CODE 8427, BY COUNTRY, 2020–2022 (USD MILLION)
                    TABLE 22 EXPORT DATA FOR HS CODE 8427, BY COUNTRY, 2020–2022 (USD MILLION)
    5.14 REGULATORY LANDSCAPE 
           5.14.1 SAFETY STANDARDS FOR INDUSTRIAL VEHICLES
                    TABLE 23 SAFETY STANDARDS FOR INDUSTRIAL VEHICLES
                    TABLE 24 REGULATORY BODIES, GOVERNMENT AGENCIES, AND OTHER ORGANIZATIONS
    5.15 KEY CONFERENCES AND EVENTS 
                    TABLE 25 KEY CONFERENCES AND EVENTS, 2024–2025
    5.16 KEY STAKEHOLDERS AND BUYING CRITERIA 
           5.16.1 KEY STAKEHOLDERS IN BUYING PROCESS
                    FIGURE 48 INFLUENCE OF STAKEHOLDERS ON BUYING PROCESS FOR TOP FOUR VEHICLE TYPES
                    TABLE 26 INFLUENCE OF STAKEHOLDERS ON BUYING PROCESS FOR TOP FOUR VEHICLE TYPES (%)
           5.16.2 BUYING CRITERIA
                    FIGURE 49 KEY BUYING CRITERIA FOR TOP FOUR VEHICLE TYPES
                    TABLE 27 KEY BUYING CRITERIA FOR TOP FOUR VEHICLE TYPES
    5.17 TRENDS AND DISRUPTIONS IMPACTING CUSTOMER BUSINESS 
                    FIGURE 50 TRENDS AND DISRUPTIONS IMPACTING CUSTOMER BUSINESS
 
6 INDUSTRIAL VEHICLES MARKET, BY VEHICLE TYPE & CAPACITY (Page No. - 121)
    6.1 INTRODUCTION 
           FIGURE 51 AISLE TRUCKS SEGMENT TO DOMINATE MARKET IN TERMS OF VALUE FROM 2024 TO 2030
           TABLE 28 INDUSTRIAL VEHICLES MARKET, BY VEHICLE TYPE, 2019–2023 (USD MILLION)
           TABLE 29 INDUSTRIAL VEHICLES MARKET, BY VEHICLE TYPE, 2024–2030 (USD MILLION)
           TABLE 30 INDUSTRIAL VEHICLES MARKET, BY VEHICLE TYPE, 2019–2023 (THOUSAND UNITS)
           TABLE 31 INDUSTRIAL VEHICLES MARKET, BY VEHICLE TYPE, 2024–2030 (THOUSAND UNITS)
           6.1.1 OPERATIONAL DATA
                    TABLE 32 INDUSTRIAL VEHICLE MODELS OFFERED BY COMPANIES, BY VEHICLE TYPE
    6.2 FORKLIFTS 
           6.2.1 GROWING ADOPTION OF HUB-AND-SPOKE MODEL TO DRIVE MARKET
                    TABLE 33 FORKLIFTS MARKET, BY REGION, 2019–2023 (USD MILLION)
                    TABLE 34 FORKLIFTS MARKET, BY REGION, 2024–2030 (USD MILLION)
                    TABLE 35 FORKLIFTS MARKET, BY REGION, 2019–2023 (THOUSAND UNITS)
                    TABLE 36 FORKLIFTS MARKET, BY REGION, 2024–2030 (THOUSAND UNITS)
           6.2.2 FORKLIFTS MARKET, BY CAPACITY
                    TABLE 37 FORKLIFTS MARKET, BY CAPACITY, 2019–2023 (USD MILLION)
                    TABLE 38 FORKLIFTS MARKET, BY CAPACITY, 2024–2030 (USD MILLION)
                    TABLE 39 FORKLIFTS MARKET, BY CAPACITY, 2019–2023 (THOUSAND UNITS)
                    TABLE 40 FORKLIFTS MARKET, BY CAPACITY, 2024–2030 (THOUSAND UNITS)
           6.2.3 <5 TONS
           6.2.4 5–10 TONS
           6.2.5 11–36 TONS
           6.2.6 >36 TONS
    6.3 AISLE TRUCKS 
           6.3.1 INCREASING DEMAND FOR SPACE OPTIMIZATION IN WAREHOUSES TO DRIVE MARKET
                    TABLE 41 AISLE TRUCKS MARKET, BY REGION, 2019–2023 (USD MILLION)
                    TABLE 42 AISLE TRUCKS MARKET, BY REGION, 2024–2030 (USD MILLION)
                    TABLE 43 AISLE TRUCKS MARKET, BY REGION, 2019–2023 (THOUSAND UNITS)
                    TABLE 44 AISLE TRUCKS MARKET, BY REGION, 2024–2030 (THOUSAND UNITS)
           6.3.2 AISLE TRUCKS MARKET, BY CAPACITY
                    TABLE 45 AISLE TRUCKS MARKET, BY CAPACITY, 2019–2023 (USD MILLION)
                    TABLE 46 AISLE TRUCKS MARKET, BY CAPACITY, 2024–2030 (USD MILLION)
                    TABLE 47 AISLE TRUCKS MARKET, BY CAPACITY, 2019–2023 (THOUSAND UNITS)
                    TABLE 48 AISLE TRUCKS MARKET, BY CAPACITY, 2024–2030 (THOUSAND UNITS)
           6.3.3 <1 TON
           6.3.4 1–2 TONS
           6.3.5 >2 TONS
    6.4 TOW TRACTORS 
           6.4.1 RISING DEMAND FOR EFFICIENT MATERIAL HANDLING TO DRIVE MARKET
                    TABLE 49 TOW TRACTORS MARKET, BY REGION, 2019–2023 (USD MILLION)
                    TABLE 50 TOW TRACTORS MARKET, BY REGION, 2024–2030 (USD MILLION)
                    TABLE 51 TOW TRACTORS MARKET, BY REGION, 2019–2023 (THOUSAND UNITS)
                    TABLE 52 TOW TRACTORS MARKET, BY REGION, 2024–2030 (THOUSAND UNITS)
           6.4.2 TOW TRACTORS MARKET, BY CAPACITY
                    TABLE 53 TOW TRACTORS MARKET, BY CAPACITY, 2019–2023(USD MILLION)
                    TABLE 54 TOW TRACTORS MARKET, BY CAPACITY, 2024–2030 (USD MILLION)
                    TABLE 55 TOW TRACTORS MARKET, BY CAPACITY, 2019–2023 (THOUSAND UNITS)
                    TABLE 56 TOW TRACTORS MARKET, BY CAPACITY, 2024–2030 (THOUSAND UNITS)
           6.4.3 <5 TONS
           6.4.4 5–10 TONS
           6.4.5 11–30 TONS
           6.4.6 >30 TONS
    6.5 CONTAINER HANDLERS 
           6.5.1 INCREASING INFRASTRUCTURE PROJECTS AND STEADY GROWTH IN MARINE SECTOR TO DRIVE MARKET
                    TABLE 57 CONTAINER HANDLERS MARKET, BY REGION, 2019–2023 (USD MILLION)
                    TABLE 58 CONTAINER HANDLERS MARKET, BY REGION, 2024–2030 (USD MILLION)
                    TABLE 59 CONTAINER HANDLERS MARKET, BY REGION, 2019–2023 (THOUSAND UNITS)
                    TABLE 60 CONTAINER HANDLERS MARKET, BY REGION, 2024–2030 (THOUSAND UNITS)
           6.5.2 CONTAINER HANDLERS MARKET, BY CAPACITY
                    TABLE 61 CONTAINER HANDLERS MARKET, BY CAPACITY, 2019–2023 (USD MILLION)
                    TABLE 62 CONTAINER HANDLERS MARKET, BY CAPACITY, 2024–2030 (USD MILLION)
                    TABLE 63 CONTAINER HANDLERS MARKET, BY CAPACITY, 2019–2023 (THOUSAND UNITS)
                    TABLE 64 CONTAINER HANDLERS MARKET, BY CAPACITY, 2024–2030 (THOUSAND UNITS)
           6.5.3 <30 TONS
           6.5.4 30–40 TONS
           6.5.5 >40 TONS
    6.6 AUTOMATED GUIDED VEHICLES 
           6.6.1 GROWING NEED FOR AUTOMATION IN MATERIAL HANDLING PROCESSES TO DRIVE MARKET
                    6.6.1.1 Availability of cost-effective labor restricting adoption of AGVs in emerging economies
                    6.6.1.2 Technical challenges related to sensing elements
                    6.6.1.3 High installation, maintenance, and switching costs associated with AGVs
    6.7 PERSONNEL CARRIERS 
           6.7.1 RISING LEVELS OF INDUSTRIALIZATION WORLDWIDE TO DRIVE MARKET
    6.8 KEY PRIMARY INSIGHTS 
 
7 INDUSTRIAL VEHICLES MARKET, BY DRIVE TYPE (Page No. - 144)
    7.1 INTRODUCTION 
           TABLE 65 LPG FORKLIFTS VS. BATTERY-OPERATED FORKLIFTS
           FIGURE 52 BATTERY-OPERATED SEGMENT TO REGISTER HIGHEST CAGR FROM 2024 TO 2030
           TABLE 66 INDUSTRIAL VEHICLES MARKET, BY DRIVE TYPE, 2019–2023 (USD MILLION)
           TABLE 67 INDUSTRIAL VEHICLES MARKET, BY DRIVE TYPE, 2024–2030 (USD MILLION)
           TABLE 68 INDUSTRIAL VEHICLES MARKET, BY DRIVE TYPE, 2019–2023 (THOUSAND UNITS)
           TABLE 69 INDUSTRIAL VEHICLES MARKET, BY DRIVE TYPE, 2024–2030 (THOUSAND UNITS)
           7.1.1 OPERATIONAL DATA
                    TABLE 70 INDUSTRIAL VEHICLES OFFERED BY COMPANIES, BY DRIVE TYPE
    7.2 ICE INDUSTRIAL VEHICLES 
           7.2.1 INCREASING DEMAND FROM WAREHOUSING AND TRANSPORTATION SECTORS TO DRIVE MARKET
                    TABLE 71 EMISSION STANDARDS
                    FIGURE 53 KEY DIFFERENCE BETWEEN ICE FORKLIFTS AND ELECTRIC FORKLIFTS
                    TABLE 72 ICE INDUSTRIAL VEHICLES MARKET, BY VEHICLE TYPE, 2019–2023 (USD MILLION)
                    TABLE 73 ICE INDUSTRIAL VEHICLES MARKET, BY VEHICLE TYPE, 2024–2030 (USD MILLION)
                    TABLE 74 ICE INDUSTRIAL VEHICLES MARKET, BY VEHICLE TYPE, 2019–2023 (THOUSAND UNITS)
                    TABLE 75 ICE INDUSTRIAL VEHICLES MARKET, BY VEHICLE TYPE, 2024–2030 (THOUSAND UNITS)
    7.3 BATTERY-OPERATED INDUSTRIAL VEHICLES 
           7.3.1 GROWING ENVIRONMENTAL AWARENESS TO DRIVE DEMAND
                    FIGURE 54 CO2 EMISSION REDUCTION BY TOYOTA INDUSTRIES CORPORATION
                    FIGURE 55 KEY BENEFITS OF ELECTRIC FORKLIFTS
                    TABLE 76 LIFECYCLE COST COMPARISON: ELECTRIC LIFT TRUCKS VS. ICE LIFT TRUCKS
                    TABLE 77 BATTERY-OPERATED INDUSTRIAL VEHICLES MARKET, BY VEHICLE TYPE, 2019–2023 (USD MILLION)
                    TABLE 78 BATTERY-OPERATED INDUSTRIAL VEHICLES MARKET, BY VEHICLE TYPE, 2024–2030 (USD MILLION)
                    TABLE 79 BATTERY-OPERATED INDUSTRIAL VEHICLES MARKET, BY VEHICLE TYPE, 2019–2023 (THOUSAND UNITS)
                    TABLE 80 BATTERY-OPERATED INDUSTRIAL VEHICLES MARKET, BY VEHICLE TYPE, 2024–2030 (THOUSAND UNITS)
    7.4 GAS-POWERED INDUSTRIAL VEHICLES 
           7.4.1 ABILITY TO OPERATE IN DIVERSE ENVIRONMENTS INDEPENDENTLY OF CHARGING INFRASTRUCTURE TO BOOST DEMAND
                    TABLE 81 GAS-POWERED INDUSTRIAL VEHICLES MARKET, BY VEHICLE TYPE, 2019–2023 (USD MILLION)
                    TABLE 82 GAS-POWERED INDUSTRIAL VEHICLES MARKET, BY VEHICLE TYPE, 2024–2030 (USD MILLION)
                    TABLE 83 GAS-POWERED INDUSTRIAL VEHICLES MARKET, BY VEHICLE TYPE, 2019–2023 (THOUSAND UNITS)
                    TABLE 84 GAS-POWERED INDUSTRIAL VEHICLES MARKET, BY VEHICLE TYPE, 2024–2030 (THOUSAND UNITS)
    7.5 KEY PRIMARY INSIGHTS 
 
8 INDUSTRIAL VEHICLES MARKET, BY APPLICATION (Page No. - 158)
    8.1 INTRODUCTION 
           FIGURE 56 MANUFACTURING SEGMENT TO LEAD MARKET FROM 2024 TO 2030
           TABLE 85 INDUSTRIAL VEHICLES MARKET, BY APPLICATION, 2019–2023 (USD MILLION)
           TABLE 86 INDUSTRIAL VEHICLES MARKET, BY APPLICATION, 2024–2030 (USD MILLION)
           TABLE 87 INDUSTRIAL VEHICLES MARKET, BY APPLICATION, 2019–2023 (THOUSAND UNITS)
           TABLE 88 INDUSTRIAL VEHICLES MARKET, BY APPLICATION, 2024–2030 (THOUSAND UNITS)
           8.1.1 OPERATIONAL DATA
                    TABLE 89 INDUSTRIAL VEHICLES AND THEIR APPLICATIONS
    8.2 MANUFACTURING 
           8.2.1 INCREASING ADOPTION OF INDUSTRIAL VEHICLES IN END-USE SECTORS TO DRIVE SEGMENT
                    TABLE 90 MANUFACTURING: INDUSTRIAL VEHICLES MARKET, BY REGION, 2019–2023 (USD MILLION)
                    TABLE 91 MANUFACTURING: INDUSTRIAL VEHICLES MARKET, BY REGION, 2024–2030 (USD MILLION)
                    TABLE 92 MANUFACTURING: INDUSTRIAL VEHICLES MARKET, BY REGION, 2019–2023 (THOUSAND UNITS)
                    TABLE 93 MANUFACTURING: INDUSTRIAL VEHICLES MARKET, BY REGION, 2024–2030 (THOUSAND UNITS)
           8.2.2 AUTOMOTIVE
           8.2.3 METALS & HEAVY MACHINERY
           8.2.4 CHEMICAL
           8.2.5 HEALTHCARE
           8.2.6 FOOD & BEVERAGES
           8.2.7 OTHERS
    8.3 WAREHOUSING 
           8.3.1 EXPANSION OF E-COMMERCE SECTOR TO DRIVE SEGMENT
                    FIGURE 57 CHINA: ONLINE RETAIL SALES (2019–2023)
                    TABLE 94 WAREHOUSING: INDUSTRIAL VEHICLES MARKET, BY REGION, 2019–2023 (USD MILLION)
                    TABLE 95 WAREHOUSING: INDUSTRIAL VEHICLES MARKET, BY REGION, 2024–2030 (USD MILLION)
                    TABLE 96 WAREHOUSING: INDUSTRIAL VEHICLES MARKET, BY REGION, 2019–2023 (THOUSAND UNITS)
                    TABLE 97 WAREHOUSING: INDUSTRIAL VEHICLES MARKET, BY REGION, 2024–2030 (THOUSAND UNITS)
    8.4 FREIGHT & LOGISTICS 
           8.4.1 CONSUMER SHIFT TOWARD ONLINE SHOPPING TO DRIVE SEGMENT
                    TABLE 98 FREIGHT & LOGISTICS: INDUSTRIAL VEHICLES MARKET, BY REGION, 2019–2023 (USD MILLION)
                    TABLE 99 FREIGHT & LOGISTICS: INDUSTRIAL VEHICLES MARKET, BY REGION, 2024–2030 (USD MILLION)
                    TABLE 100 FREIGHT & LOGISTICS: INDUSTRIAL VEHICLES MARKET, BY REGION, 2019–2023 (THOUSAND UNITS)
                    TABLE 101 FREIGHT & LOGISTICS: INDUSTRIAL VEHICLES MARKET, BY REGION, 2024–2030 (THOUSAND UNITS)
    8.5 OTHERS 
           TABLE 102 OTHERS: INDUSTRIAL VEHICLES MARKET, BY REGION, 2019–2023 (USD MILLION)
           TABLE 103 OTHERS: INDUSTRIAL VEHICLES MARKET, BY REGION, 2024–2030 (USD MILLION)
           TABLE 104 OTHERS: INDUSTRIAL VEHICLES MARKET, BY REGION, 2019–2023 (THOUSAND UNITS)
           TABLE 105 OTHERS: INDUSTRIAL VEHICLES MARKET, BY REGION, 2024–2030 (THOUSAND UNITS)
    8.6 KEY PRIMARY INSIGHTS 
 
9 INDUSTRIAL VEHICLES MARKET, BY LEVEL OF AUTONOMY (Page No. - 174)
    9.1 INTRODUCTION 
    9.2 NON/SEMI-AUTONOMOUS 
    9.3 AUTONOMOUS 
           FIGURE 58 COST BREAKDOWN OF NON-AUTONOMOUS VS. AUTONOMOUS FORKLIFTS
    9.4 KEY PRIMARY INSIGHTS 
 
10 AERIAL WORK PLATFORM MARKET, BY TYPE (Page No. - 177)
     10.1 INTRODUCTION 
               FIGURE 59 BOOM LIFTS SEGMENT TO LEAD MARKET FROM 2024 TO 2030
               TABLE 106 AERIAL WORK PLATFORM MARKET, BY TYPE, 2019–2023 (USD MILLION)
               TABLE 107 AERIAL WORK PLATFORM MARKET, BY TYPE, 2024–2030 (USD MILLION)
               TABLE 108 AERIAL WORK PLATFORM MARKET, BY TYPE, 2019–2023 (UNITS)
               TABLE 109 AERIAL WORK PLATFORM MARKET, BY TYPE, 2024–2030 (UNITS)
               TABLE 110 AERIAL WORK PLATFORM MARKET, BY DRIVE TYPE, 2019–2023 (USD MILLION)
               TABLE 111 AERIAL WORK PLATFORM MARKET, BY DRIVE TYPE, 2024–2030 (USD MILLION)
               TABLE 112 AERIAL WORK PLATFORM MARKET, BY DRIVE TYPE, 2019–2023 (UNITS)
               TABLE 113 AERIAL WORK PLATFORM MARKET, BY DRIVE TYPE, 2024–2030 (UNITS)
             10.1.1 OPERATIONAL DATA
                       TABLE 114 AERIAL LIFT PLATFORMS OFFERED BY COMPANIES
     10.2 BOOM LIFTS 
             10.2.1 GOVERNMENT SUPPORT AND FOREIGN INVESTMENTS TO DRIVE MARKET
                       TABLE 115 BOOM LIFTS MARKET, BY REGION, 2019–2023 (USD MILLION)
                       TABLE 116 BOOM LIFTS MARKET, BY REGION, 2024–2030 (USD MILLION)
                       TABLE 117 BOOM LIFTS MARKET, BY REGION, 2019–2023 (UNITS)
                       TABLE 118 BOOM LIFTS MARKET, BY REGION, 2024–2030 (UNITS)
                       TABLE 119 BOOM LIFTS MARKET, BY DRIVE TYPE, 2019–2023 (USD MILLION)
                       TABLE 120 BOOM LIFTS MARKET, BY DRIVE TYPE, 2024–2030 (USD MILLION)
                       TABLE 121 BOOM LIFTS MARKET, BY DRIVE TYPE, 2019–2023 (UNITS)
                       TABLE 122 BOOM LIFTS MARKET, BY DRIVE TYPE, 2024–2030 (UNITS)
     10.3 SCISSOR LIFTS 
             10.3.1 GROWING LOGISTICS SECTOR TO DRIVE MARKET
                       TABLE 123 SCISSOR LIFTS MARKET, BY REGION, 2019–2023 (USD MILLION)
                       TABLE 124 SCISSOR LIFTS MARKET, BY REGION, 2024–2030 (USD MILLION)
                       TABLE 125 SCISSOR LIFTS MARKET, BY REGION, 2019–2023 (UNITS)
                       TABLE 126 SCISSOR LIFTS MARKET, BY REGION, 2024–2030 (UNITS)
                       TABLE 127 SCISSOR LIFTS MARKET, BY DRIVE TYPE, 2019–2023 (USD MILLION)
                       TABLE 128 SCISSOR LIFTS MARKET, BY DRIVE TYPE, 2024–2030 (USD MILLION)
                       TABLE 129 SCISSOR LIFTS MARKET, BY DRIVE TYPE, 2019–2023 (UNITS)
                       TABLE 130 SCISSOR LIFTS MARKET, BY DRIVE TYPE, 2024–2030 (UNITS)
     10.4 KEY PRIMARY INSIGHTS 
 
11 INDUSTRIAL VEHICLES MARKET, BY REGION (Page No. - 189)
     11.1 INTRODUCTION 
               FIGURE 60 INDUSTRIAL VEHICLES MARKET, BY REGION, 2024 VS. 2030 (USD MILLION)
               TABLE 131 INDUSTRIAL VEHICLES MARKET, BY REGION, 2019–2023 (USD MILLION)
               TABLE 132 INDUSTRIAL VEHICLES MARKET, BY REGION, 2024–2030 (USD MILLION)
               TABLE 133 INDUSTRIAL VEHICLES MARKET, BY REGION, 2019–2023 (THOUSAND UNITS)
               TABLE 134 INDUSTRIAL VEHICLES MARKET, BY REGION, 2024–2030 (THOUSAND UNITS)
     11.2 ASIA PACIFIC 
             11.2.1 ASIA PACIFIC: RECESSION IMPACT
                       FIGURE 61 ASIA PACIFIC: INDUSTRIAL VEHICLES MARKET SNAPSHOT
                       TABLE 135 ASIA PACIFIC: INDUSTRIAL VEHICLES MARKET, BY COUNTRY, 2019–2023 (USD MILLION)
                       TABLE 136 ASIA PACIFIC: INDUSTRIAL VEHICLES MARKET, BY COUNTRY, 2024–2030 (USD MILLION)
                       TABLE 137 ASIA PACIFIC: INDUSTRIAL VEHICLES MARKET, BY COUNTRY, 2019–2023 (THOUSAND UNITS)
                       TABLE 138 ASIA PACIFIC: INDUSTRIAL VEHICLES MARKET, BY COUNTRY, 2024–2030 (THOUSAND UNITS)
             11.2.2 CHINA
                       11.2.2.1 Increasing industrialization and infrastructure development to drive market
                                   TABLE 139 CHINA: INDUSTRIAL VEHICLES MARKET, BY VEHICLE TYPE, 2019–2023 (USD MILLION)
                                   TABLE 140 CHINA: INDUSTRIAL VEHICLES MARKET, BY VEHICLE TYPE, 2024–2030 (USD MILLION)
                                   TABLE 141 CHINA: INDUSTRIAL VEHICLES MARKET, BY VEHICLE TYPE, 2019–2023 (THOUSAND UNITS)
                                   TABLE 142 CHINA: INDUSTRIAL VEHICLES MARKET, BY VEHICLE TYPE, 2024–2030 (THOUSAND UNITS)
             11.2.3 INDIA
                       11.2.3.1 Persistent growth of e-commerce sector to drive market
                                   TABLE 143 INDIA: INDUSTRIAL VEHICLES MARKET, BY VEHICLE TYPE, 2019–2023 (USD MILLION)
                                   TABLE 144 INDIA: INDUSTRIAL VEHICLES MARKET, BY VEHICLE TYPE, 2024–2030 (USD MILLION)
                                   TABLE 145 INDIA: INDUSTRIAL VEHICLES MARKET, BY VEHICLE TYPE, 2019–2023 (THOUSAND UNITS)
                                   TABLE 146 INDIA: INDUSTRIAL VEHICLES MARKET, BY VEHICLE TYPE, 2024–2030 (THOUSAND UNITS)
                                   11.2.4 JAPAN
                       11.2.4.1 Advancements in electric and autonomous industrial vehicles to drive market
                                   TABLE 147 JAPAN: INDUSTRIAL VEHICLES MARKET, BY VEHICLE TYPE, 2019–2023 (USD MILLION)
                                   TABLE 148 JAPAN: INDUSTRIAL VEHICLES MARKET, BY VEHICLE TYPE, 2024–2030 (USD MILLION)
                                   TABLE 149 JAPAN: INDUSTRIAL VEHICLES MARKET, BY VEHICLE TYPE, 2019–2023 (THOUSAND UNITS)
                                   TABLE 150 JAPAN: INDUSTRIAL VEHICLES MARKET, BY VEHICLE TYPE, 2024–2030 (THOUSAND UNITS)
             11.2.5 SOUTH KOREA
                       11.2.5.1 Surging industrialization to drive market
                                   TABLE 151 SOUTH KOREA: INDUSTRIAL VEHICLES MARKET, BY VEHICLE TYPE, 2019–2023 (USD MILLION)
                                   TABLE 152 SOUTH KOREA: INDUSTRIAL VEHICLES MARKET, BY VEHICLE TYPE, 2024–2030 (USD MILLION)
                                   TABLE 153 SOUTH KOREA: INDUSTRIAL VEHICLES MARKET, BY VEHICLE TYPE, 2019–2023 (THOUSAND UNITS)
                                   TABLE 154 SOUTH KOREA: INDUSTRIAL VEHICLES MARKET, BY VEHICLE TYPE, 2024–2030 (THOUSAND UNITS)
             11.2.6 REST OF ASIA PACIFIC
                       TABLE 155 REST OF ASIA PACIFIC: INDUSTRIAL VEHICLES MARKET, BY VEHICLE TYPE, 2019–2023 (USD MILLION)
                       TABLE 156 REST OF ASIA PACIFIC: INDUSTRIAL VEHICLES MARKET, BY VEHICLE TYPE, 2024–2030 (USD MILLION)
                       TABLE 157 REST OF ASIA PACIFIC: INDUSTRIAL VEHICLES MARKET, BY VEHICLE TYPE, 2019–2023 (THOUSAND UNITS)
                       TABLE 158 REST OF ASIA PACIFIC: INDUSTRIAL VEHICLES MARKET, BY VEHICLE TYPE, 2024–2030 (THOUSAND UNITS)
     11.3 EUROPE 
             11.3.1 EUROPE: RECESSION IMPACT
                       FIGURE 62 EUROPE: INDUSTRIAL VEHICLES MARKET SNAPSHOT
                       TABLE 159 EUROPE: INDUSTRIAL VEHICLES MARKET, BY COUNTRY, 2019–2023 (USD MILLION)
                       TABLE 160 EUROPE: INDUSTRIAL VEHICLES MARKET, BY COUNTRY, 2024–2030 (USD MILLION)
                       TABLE 161 EUROPE: INDUSTRIAL VEHICLES MARKET, BY COUNTRY, 2019–2023 (THOUSAND UNITS)
                       TABLE 162 EUROPE: INDUSTRIAL VEHICLES MARKET, BY COUNTRY, 2024–2030 (THOUSAND UNITS)
             11.3.2 GERMANY
                       11.3.2.1 Expansion of e-commerce industry to drive market
                                   TABLE 163 GERMANY: INDUSTRIAL VEHICLES MARKET, BY VEHICLE TYPE, 2019–2023 (USD MILLION)
                                   TABLE 164 GERMANY: INDUSTRIAL VEHICLES MARKET, BY VEHICLE TYPE, 2024–2030 (USD MILLION)
                                   TABLE 165 GERMANY: INDUSTRIAL VEHICLES MARKET, BY VEHICLE TYPE, 2019–2023 (THOUSAND UNITS)
                                   TABLE 166 GERMANY: INDUSTRIAL VEHICLES MARKET, BY VEHICLE TYPE, 2024–2030 (THOUSAND UNITS)
             11.3.3 UK
                       11.3.3.1 Increasing innovation in material handling equipment to drive market
                                   TABLE 167 UK: INDUSTRIAL VEHICLES MARKET, BY VEHICLE TYPE, 2019–2023 (USD MILLION)
                                   TABLE 168 UK: INDUSTRIAL VEHICLES MARKET, BY VEHICLE TYPE, 2024–2030 (USD MILLION)
                                   TABLE 169 UK: INDUSTRIAL VEHICLES MARKET, BY VEHICLE TYPE, 2019–2023 (THOUSAND UNITS)
                                   TABLE 170 UK: INDUSTRIAL VEHICLES MARKET, BY VEHICLE TYPE, 2024–2030 (THOUSAND UNITS)
             11.3.4 FRANCE
                       11.3.4.1 Accelerating automation to drive market
                                   TABLE 171 FRANCE: INDUSTRIAL VEHICLES MARKET, BY VEHICLE TYPE, 2019–2023 (USD MILLION)
                                   TABLE 172 FRANCE: INDUSTRIAL VEHICLES MARKET, BY VEHICLE TYPE, 2024–2030 (USD MILLION)
                                   TABLE 173 FRANCE: INDUSTRIAL VEHICLES MARKET, BY VEHICLE TYPE, 2019–2023 (THOUSAND UNITS)
                                   TABLE 174 FRANCE: INDUSTRIAL VEHICLES MARKET, BY COUNTRY, 2024–2030 (THOUSAND UNITS)
             11.3.5 ITALY
                       11.3.5.1 Growing e-commerce sector to drive market
                                   TABLE 175 ITALY: INDUSTRIAL VEHICLES MARKET, BY VEHICLE TYPE, 2019–2023 (USD MILLION)
                                   TABLE 176 ITALY: INDUSTRIAL VEHICLES MARKET, BY VEHICLE TYPE, 2024–2030 (USD MILLION)
                                   TABLE 177 ITALY: INDUSTRIAL VEHICLES MARKET, BY VEHICLE TYPE, 2019–2023 (THOUSAND UNITS)
                                   TABLE 178 ITALY: INDUSTRIAL VEHICLES MARKET, BY VEHICLE TYPE, 2024–2030 (THOUSAND UNITS)
             11.3.6 SPAIN
                       11.3.6.1 Rising activities in logistics and warehousing sectors to drive market
                                   TABLE 179 SPAIN: INDUSTRIAL VEHICLES MARKET, BY VEHICLE TYPE, 2019–2023 (USD MILLION)
                                   TABLE 180 SPAIN: INDUSTRIAL VEHICLES MARKET, BY VEHICLE TYPE, 2024–2030 (USD MILLION)
                                   TABLE 181 SPAIN: INDUSTRIAL VEHICLES MARKET, BY VEHICLE TYPE, 2019–2023 (THOUSAND UNITS)
                                   TABLE 182 SPAIN: INDUSTRIAL VEHICLES MARKET, BY VEHICLE TYPE, 2024–2030 (THOUSAND UNITS)
             11.3.7 REST OF EUROPE
                       TABLE 183 REST OF EUROPE: INDUSTRIAL VEHICLES MARKET, BY VEHICLE TYPE, 2019–2023 (USD MILLION)
                       TABLE 184 REST OF EUROPE: INDUSTRIAL VEHICLES MARKET, BY VEHICLE TYPE, 2024–2030 (USD MILLION)
                       TABLE 185 REST OF EUROPE: INDUSTRIAL VEHICLES MARKET, BY VEHICLE TYPE, 2019–2023 (THOUSAND UNITS)
                       TABLE 186 REST OF EUROPE: INDUSTRIAL VEHICLES MARKET, BY VEHICLE TYPE, 2024–2030 (THOUSAND UNITS)
     11.4 NORTH AMERICA 
             11.4.1 NORTH AMERICA: RECESSION IMPACT
                       FIGURE 63 NORTH AMERICA: INDUSTRIAL VEHICLES MARKET, BY COUNTRY, 2024 VS. 2030 (USD MILLION)
                       TABLE 187 NORTH AMERICA: INDUSTRIAL VEHICLES MARKET, BY COUNTRY, 2019–2023 (USD MILLION)
                       TABLE 188 NORTH AMERICA: INDUSTRIAL VEHICLES MARKET, BY COUNTRY, 2024–2030 (USD MILLION)
                       TABLE 189 NORTH AMERICA: INDUSTRIAL VEHICLES MARKET, BY COUNTRY, 2019–2023 (THOUSAND UNITS)
                       TABLE 190 NORTH AMERICA: INDUSTRIAL VEHICLES MARKET, BY COUNTRY, 2024–2030 (THOUSAND UNITS)
             11.4.2 US
                       11.4.2.1 E-commerce dynamics and automation trends to drive market
                                   TABLE 191 US: INDUSTRIAL VEHICLES MARKET, BY VEHICLE TYPE, 2019–2023 (USD MILLION)
                                   TABLE 192 US: INDUSTRIAL VEHICLES MARKET, BY VEHICLE TYPE, 2024–2030 (USD MILLION)
                                   TABLE 193 US: INDUSTRIAL VEHICLES MARKET, BY VEHICLE TYPE, 2019–2023 (THOUSAND UNITS)
                                   TABLE 194 US: INDUSTRIAL VEHICLES MARKET, BY VEHICLE TYPE, 2024–2030 (THOUSAND UNITS)
             11.4.3 MEXICO
                       11.4.3.1 Growing e-commerce and manufacturing sectors to drive market
                                   TABLE 195 MEXICO: INDUSTRIAL VEHICLES MARKET, BY VEHICLE TYPE, 2019–2023 (USD MILLION)
                                   TABLE 196 MEXICO: INDUSTRIAL VEHICLES MARKET, BY VEHICLE TYPE, 2024–2030 (USD MILLION)
                                   TABLE 197 MEXICO: INDUSTRIAL VEHICLES MARKET, BY VEHICLE TYPE, 2019–2023 (THOUSAND UNITS)
                                   TABLE 198 MEXICO: INDUSTRIAL VEHICLES MARKET, BY VEHICLE TYPE, 2024–2030 (THOUSAND UNITS)
             11.4.4 CANADA
                       11.4.4.1 Government initiatives on infrastructure development to drive market
                                   TABLE 199 CANADA: INDUSTRIAL VEHICLES MARKET, BY VEHICLE TYPE, 2019–2023 (USD MILLION)
                                   TABLE 200 CANADA: INDUSTRIAL VEHICLES MARKET, BY VEHICLE TYPE, 2024–2030 (USD MILLION)
                                   TABLE 201 CANADA: INDUSTRIAL VEHICLES MARKET, BY VEHICLE TYPE, 2019–2023 (THOUSAND UNITS)
                                   TABLE 202 CANADA: INDUSTRIAL VEHICLES MARKET, BY VEHICLE TYPE, 2024–2030 (THOUSAND UNITS)
     11.5 REST OF THE WORLD 
             11.5.1 REST OF THE WORLD: RECESSION IMPACT
                       FIGURE 64 REST OF THE WORLD: INDUSTRIAL VEHICLES MARKET, BY COUNTRY, 2024 VS. 2030 (USD MILLION)
                       TABLE 203 REST OF THE WORLD: INDUSTRIAL VEHICLES MARKET, BY COUNTRY, 2019–2023 (USD MILLION)
                       TABLE 204 REST OF THE WORLD: INDUSTRIAL VEHICLES MARKET, BY COUNTRY, 2024–2030 (USD MILLION)
                       TABLE 205 REST OF THE WORLD: INDUSTRIAL VEHICLES MARKET, BY COUNTRY, 2019–2023 (THOUSAND UNITS)
                       TABLE 206 REST OF THE WORLD: INDUSTRIAL VEHICLES MARKET, BY COUNTRY, 2024–2030 (THOUSAND UNITS)
             11.5.2 BRAZIL
                       11.5.2.1 Expanding food & beverages manufacturing sector to drive market
                                   TABLE 207 BRAZIL: INDUSTRIAL VEHICLES MARKET, BY VEHICLE TYPE, 2019–2023 (USD MILLION)
                                   TABLE 208 BRAZIL: INDUSTRIAL VEHICLES MARKET, BY VEHICLE TYPE, 2024–2030 (USD MILLION)
                                   TABLE 209 BRAZIL: INDUSTRIAL VEHICLES MARKET, BY VEHICLE TYPE, 2019–2023 (THOUSAND UNITS)
                                   TABLE 210 BRAZIL: INDUSTRIAL VEHICLES MARKET, BY VEHICLE TYPE, 2024–2030 (THOUSAND UNITS)
             11.5.3 SOUTH AFRICA
                       11.5.3.1 Growing manufacturing sector to drive market
                                   TABLE 211 SOUTH AFRICA: INDUSTRIAL VEHICLES MARKET, BY VEHICLE TYPE, 2019–2023 (USD MILLION)
                                   TABLE 212 SOUTH AFRICA: INDUSTRIAL VEHICLES MARKET, BY VEHICLE TYPE, 2024–2030 (USD MILLION)
                                   TABLE 213 SOUTH AFRICA: INDUSTRIAL VEHICLES MARKET, BY VEHICLE TYPE, 2019–2023 (THOUSAND UNITS)
                                   TABLE 214 SOUTH AFRICA: INDUSTRIAL VEHICLES MARKET, BY VEHICLE TYPE, 2024–2030 (THOUSAND UNITS)
             11.5.4 OTHERS
                       TABLE 215 OTHERS: INDUSTRIAL VEHICLES MARKET, BY VEHICLE TYPE, 2019–2023 (USD MILLION)
                       TABLE 216 OTHERS: INDUSTRIAL VEHICLES MARKET, BY VEHICLE TYPE, 2024–2030 (USD MILLION)
                       TABLE 217 OTHERS: INDUSTRIAL VEHICLES MARKET, BY VEHICLE TYPE, 2019–2023 (THOUSAND UNITS)
                       TABLE 218 OTHERS: INDUSTRIAL VEHICLES MARKET, BY VEHICLE TYPE, 2024–2030 (THOUSAND UNITS)
 
12 COMPETITIVE LANDSCAPE (Page No. - 232)
     12.1 INTRODUCTION 
     12.2 MARKET SHARE ANALYSIS, 2022 
               TABLE 219 MARKET SHARE ANALYSIS, 2022
               FIGURE 65 MARKET SHARE ANALYSIS OF KEY PLAYERS, 2022
     12.3 REVENUE ANALYSIS, 2018–2022 
               FIGURE 66 REVENUE ANALYSIS OF TOP FIVE PLAYERS, 2018–2022
     12.4 COMPANY VALUATION AND FINANCIAL METRICS 
               FIGURE 67 COMPANY VALUATION OF TOP FIVE PLAYERS
               FIGURE 68 FINANCIAL MATRIX OF TOP FIVE PLAYERS
     12.5 BRAND/PRODUCT COMPARISON 
               FIGURE 69 BRAND/PRODUCT COMPARISON OF TOP FIVE PLAYERS
     12.6 COMPANY EVALUATION MATRIX: KEY PLAYERS, 2024 
             12.6.1 STARS
             12.6.2 EMERGING LEADERS
             12.6.3 PERVASIVE PLAYERS
             12.6.4 PARTICIPANTS
                       FIGURE 70 INDUSTRIAL VEHICLES MARKET: COMPANY EVALUATION MATRIX (KEY PLAYERS), 2024
             12.6.5 COMPANY FOOTPRINT
                       FIGURE 71 INDUSTRIAL VEHICLES MARKET: COMPANY FOOTPRINT, 2024
                       TABLE 220 INDUSTRIAL VEHICLES MARKET: REGION FOOTPRINT, 2024
                       TABLE 221 INDUSTRIAL VEHICLES MARKET: DRIVE TYPE FOOTPRINT, 2024
                       TABLE 222 INDUSTRIAL VEHICLES MARKET: VEHICLE TYPE FOOTPRINT, 2024
                       TABLE 223 INDUSTRIAL VEHICLES MARKET: APPLICATION FOOTPRINT, 2024
     12.7 COMPANY EVALUATION MATRIX: START-UP/SMES, 2024 
             12.7.1 PROGRESSIVE COMPANIES
             12.7.2 RESPONSIVE COMPANIES
             12.7.3 DYNAMIC COMPANIES
             12.7.4 STARTING BLOCKS
                       FIGURE 72 INDUSTRIAL VEHICLES MARKET: COMPANY EVALUATION MATRIX (START-UPS/SMES), 2024
             12.7.5 COMPETITIVE BENCHMARKING
                       TABLE 224 INDUSTRIAL VEHICLES MARKET: KEY START-UPS/SMES
                       TABLE 225 INDUSTRIAL VEHICLES MARKET: COMPETITIVE BENCHMARKING OF KEY START-UPS/SMES
     12.8 COMPANY EVALUATION MATRIX FOR AERIAL WORK PLATFORMS MARKET 
             12.8.1 STARS
             12.8.2 EMERGING LEADERS
             12.8.3 PERVASIVE PLAYERS
             12.8.4 PARTICIPANTS
                       FIGURE 73 AERIAL WORK PLATFORMS MARKET: COMPANY EVALUATION MATRIX, 2024
             12.8.5 COMPANY FOOTPRINT
                       FIGURE 74 AERIAL WORK PLATFORMS MARKET: COMPANY FOOTPRINT, 2024
                       TABLE 226 AERIAL WORK PLATFORMS MARKET: REGION FOOTPRINT, 2024
                       TABLE 227 AERIAL WORK PLATFORMS MARKET: TYPE FOOTPRINT, 2024
     12.9 COMPETITIVE SCENARIO 
             12.9.1 PRODUCT LAUNCHES/DEVELOPMENTS
                       TABLE 228 INDUSTRIAL VEHICLES MARKET: PRODUCT LAUNCHES/DEVELOPMENTS, 2022–2024
             12.9.2 DEALS
                       TABLE 229 INDUSTRIAL VEHICLES MARKET: DEALS, 2022–2024
             12.9.3 EXPANSIONS
                       TABLE 230 INDUSTRIAL VEHICLES MARKET: EXPANSIONS, 2022–2024
 
13 COMPANY PROFILES (Page No. - 259)
(Business Overview, Products Offered, Recent Developments, and MnM View (Key strengths/Right to Win, Strategic Choices Made, and Weaknesses and Competitive Threats))*
     13.1 KEY PLAYERS (INDUSTRIAL VEHICLES) 
             13.1.1 TOYOTA INDUSTRIES CORPORATION
                       TABLE 231 TOYOTA INDUSTRIES CORPORATION: COMPANY OVERVIEW
                       FIGURE 75 TOYOTA INDUSTRIES CORPORATION: COMPANY SNAPSHOT
                       FIGURE 76 PERCENTAGE OF TOTAL SHARES FOR TOYOTA INDUSTRIES CORPORATION’S MAJOR SHAREHOLDERS (2023)
                       FIGURE 77 KEY PRODUCTS OF TOYOTA INDUSTRIES CORPORATION
                       TABLE 232 TOYOTA INDUSTRIES CORPORATION: PRODUCTS OFFERED
                       TABLE 233 TOYOTA INDUSTRIES CORPORATION: PRODUCT LAUNCHES/DEVELOPMENTS
                       TABLE 234 TOYOTA INDUSTRIES CORPORATION: DEALS
             13.1.2 KION GROUP AG
                       TABLE 235 KION GROUP AG: COMPANY OVERVIEW
                       FIGURE 78 KION GROUP AG: COMPANY SNAPSHOT
                       FIGURE 79 KION GROUP AG: EMPLOYEE STRENGTH, BY REGION (2023)
                       FIGURE 80 KION GROUP AG: PRODUCTION SITES (2023)
                       TABLE 236 KION GROUP AG: PRODUCTS OFFERED
                       TABLE 237 KION GROUP AG: PRODUCT LAUNCHES/DEVELOPMENTS
                       TABLE 238 KION GROUP AG: DEALS
                       TABLE 239 KION GROUP AG: EXPANSIONS
             13.1.3 MITSUBISHI LOGISNEXT CO., LTD.
                       TABLE 240 MITSUBISHI LOGISNEXT CO., LTD.: COMPANY OVERVIEW
                       FIGURE 81 MITSUBISHI LOGISNEXT CO., LTD.: COMPANY SNAPSHOT
                       TABLE 241 MITSUBISHI LOGISNEXT CO., LTD.: MAJOR SHAREHOLDERS (COMMON STOCK)
                       TABLE 242 MITSUBISHI LOGISNEXT CO., LTD.: PRODUCTS OFFERED
                       TABLE 243 MITSUBISHI LOGISNEXT CO., LTD.: PRODUCT LAUNCHES/DEVELOPMENTS
                       TABLE 244 MITSUBISHI LOGISNEXT CO., LTD.: DEALS
                       TABLE 245 MITSUBISHI LOGISNEXT CO., LTD.: EXPANSIONS
                       TABLE 246 MITSUBISHI LOGISNEXT CO., LTD.: OTHER DEVELOPMENTS
             13.1.4 JUNGHEINRICH AG
                       TABLE 247 JUNGHEINRICH AG: COMPANY OVERVIEW
                       FIGURE 82 JUNGHEINRICH AG: COMPANY SNAPSHOT
                       FIGURE 83 JUNGHEINRICH AG: GEOGRAPHIC PRESENCE
                       TABLE 248 JUNGHEINRICH AG: PRODUCTS OFFERED
                       TABLE 249 JUNGHEINRICH AG: PRODUCT LAUNCHES/DEVELOPMENTS
                       TABLE 250 JUNGHEINRICH AG: DEALS
                       TABLE 251 JUNGHEINRICH AG: EXPANSIONS
             13.1.5 CROWN EQUIPMENT CORPORATION
                       TABLE 252 CROWN EQUIPMENT CORPORATION: COMPANY OVERVIEW
                       TABLE 253 MAJOR BUYERS OF PRODUCTS & SERVICES FROM CROWN EQUIPMENT CORPORATION
                       TABLE 254 CROWN EQUIPMENT CORPORATION: PRODUCTS OFFERED
                       TABLE 255 CROWN EQUIPMENT CORPORATION: PRODUCT LAUNCHES/DEVELOPMENTS
                       TABLE 256 CROWN EQUIPMENT CORPORATION: EXPANSIONS
             13.1.6 HYSTER-YALE MATERIALS HANDLING, INC.
                       TABLE 257 HYSTER-YALE MATERIALS HANDLING, INC.: COMPANY OVERVIEW
                       FIGURE 84 HYSTER-YALE MATERIALS HANDLING, INC.: COMPANY SNAPSHOT
                       TABLE 258 HYSTER-YALE MATERIALS HANDLING, INC.: PRODUCTS OFFERED
                       TABLE 259 HYSTER-YALE MATERIALS HANDLING, INC.: WORLDWIDE LIFT TRUCK SALES, BY PRODUCT (2023)
                       TABLE 260 HYSTER-YALE MATERIALS HANDLING, INC.: PRODUCT LAUNCHES/DEVELOPMENTS
                       TABLE 261 HYSTER-YALE MATERIALS HANDLING, INC.: DEALS
                       TABLE 262 HYSTER-YALE MATERIALS HANDLING, INC.: EXPANSIONS
                       TABLE 263 HYSTER-YALE MATERIALS HANDLING, INC.: OTHER DEVELOPMENTS
             13.1.7 HANGCHA GROUP CO., LTD.
                       TABLE 264 HANGCHA GROUP CO., LTD.: COMPANY OVERVIEW
                       TABLE 265 HANGCHA GROUP CO., LTD.: PRODUCTS OFFERED
                       TABLE 266 HANGCHA GROUP CO., LTD.: PRODUCT LAUNCHES/DEVELOPMENTS
                       TABLE 267 HANGCHA GROUP CO., LTD.: EXPANSIONS
             13.1.8 CLARK
                       TABLE 268 CLARK: COMPANY OVERVIEW
                       FIGURE 85 CLARK: COMPANY SNAPSHOT
                       TABLE 269 CLARK: PRODUCTS OFFERED
                       TABLE 270 CLARK: PRODUCT LAUNCHES/DEVELOPMENTS
                       TABLE 271 CLARK: EXPANSIONS
             13.1.9 ANHUI HELI CO., LTD.
                       TABLE 272 ANHUI HELI CO., LTD.: COMPANY OVERVIEW
                       FIGURE 86 ANHUI HELI CO., LTD.: COMPANY SNAPSHOT
                       TABLE 273 ANHUI HELI CO., LTD.: PRODUCTS OFFERED
                       TABLE 274 ANHUI HELI CO., LTD.: PRODUCT LAUNCHES/DEVELOPMENTS
                       TABLE 275 ANHUI HELI CO., LTD.: DEALS
                       TABLE 276 ANHUI HELI CO., LTD.: OTHER DEVELOPMENTS
             13.1.10 KONECRANES
                                   TABLE 277 KONECRANES: COMPANY OVERVIEW
                                   FIGURE 87 KONECRANES: COMPANY SNAPSHOT
                                   TABLE 278 KONECRANES: PRODUCTS OFFERED
                                   TABLE 279 KONECRANES: PRODUCT LAUNCHES/DEVELOPMENTS
                                   TABLE 280 KONECRANES: DEALS
                                   TABLE 281 KONECRANES: OTHER DEVELOPMENTS
             13.1.11 EP EQUIPMENT
                                   TABLE 282 EP EQUIPMENT: COMPANY OVERVIEW
                                   FIGURE 88 EP EQUIPMENT: COMPANY SNAPSHOT
                                   TABLE 283 EP EQUIPMENT: PRODUCTS OFFERED
                                   TABLE 284 EP EQUIPMENT: PRODUCT LAUNCHES/DEVELOPMENTS
                                   TABLE 285 EP EQUIPMENT: EXPANSIONS
                                   TABLE 286 EP EQUIPMENT: OTHER DEVELOPMENTS
     13.2 OTHER PLAYERS (INDUSTRIAL VEHICLES) 
             13.2.1 KOMATSU LTD.
                       TABLE 287 KOMATSU LTD.: COMPANY OVERVIEW
             13.2.2 DOOSAN INDUSTRIAL VEHICLE
                       TABLE 288 DOOSAN INDUSTRIAL VEHICLE: COMPANY OVERVIEW
             13.2.3 MANITOU GROUP
                       TABLE 289 MANITOU GROUP: COMPANY OVERVIEW
             13.2.4 CARGOTEC CORPORATION
                       TABLE 290 CARGOTEC CORPORATION: COMPANY OVERVIEW
             13.2.5 ACTION CONSTRUCTION EQUIPMENT LTD.
                       TABLE 291 ACTION CONSTRUCTION EQUIPMENT LTD.: COMPANY OVERVIEW
             13.2.6 HYUNDAI CONSTRUCTION EQUIPMENT INDIA PVT. LTD.
                       TABLE 292 HYUNDAI CONSTRUCTION EQUIPMENT INDIA PVT. LTD.: COMPANY OVERVIEW
             13.2.7 V. MARIOTTI SRL
                       TABLE 293 V. MARIOTTI SRL: COMPANY OVERVIEW
             13.2.8 COMBILIFT
                       TABLE 294 COMBILIFT: COMPANY OVERVIEW
             13.2.9 DAIFUKU
                       TABLE 295 DAIFUKU: COMPANY OVERVIEW
             13.2.10 JBT
                                   TABLE 296 JBT: COMPANY OVERVIEW
             13.2.11 LONKING MACHINERY CO., LTD.
                                   TABLE 297 LONKING MACHINERY CO., LTD.: COMPANY OVERVIEW
             13.2.12 HUBTEX MASCHINENBAU GMBH & CO. KG
                                   TABLE 298 HUBTEX MASCHINENBAU GMBH & CO. KG: COMPANY OVERVIEW
             13.2.13 GODREJ & BOYCE MFG. CO. LTD.
                                   TABLE 299 GODREJ & BOYCE MFG. CO. LTD.: COMPANY OVERVIEW
             13.2.14 SVETRUCK AB
                                   TABLE 300 SVETRUCK AB: COMPANY OVERVIEW
             13.2.15 STOCKLIN LOGISTIK AG
                                   TABLE 301 STOCKLIN LOGISTIK AG: COMPANY OVERVIEW
             13.2.16 O.M.G. SRL
                                   TABLE 302 O.M.G. SRL: COMPANY OVERVIEW
             13.2.17 PALETRANS FORKLIFTS
                                   TABLE 303 PALETRANS FORKLIFTS: COMPANY OVERVIEW
             13.2.18 GENKINGER GMBH
                                   TABLE 304 GENKINGER GMBH: COMPANY OVERVIEW
             13.2.19 FLEXI TRUCKS
                                   TABLE 305 FLEXI TRUCKS: COMPANY OVERVIEW
             13.2.20 AGILOX SERVICES GMBH
                                   TABLE 306 AGILOX SERVICES GMBH: COMPANY OVERVIEW
     13.3 KEY PLAYERS (LIFTING PLATFORMS) 
             13.3.1 JLG INDUSTRIES, INC.
                       TABLE 307 JLG INDUSTRIES, INC.: COMPANY OVERVIEW
                       FIGURE 89 JLG INDUSTRIES, INC.: COMPANY SNAPSHOT
                       TABLE 308 JLG INDUSTRIES, INC.: MAJOR CENTERS
                       TABLE 309 JLG INDUSTRIES, INC.: PRODUCTS OFFERED
                       TABLE 310 JLG INDUSTRIES, INC.: PRODUCT LAUNCHES/DEVELOPMENTS
                       TABLE 311 JLG INDUSTRIES, INC.: DEALS
                       TABLE 312 JLG INDUSTRIES, INC.: EXPANSIONS
             13.3.2 TADANO LTD.
                       TABLE 313 TADANO LTD.: COMPANY OVERVIEW
                       FIGURE 90 TADANO LTD.: COMPANY SNAPSHOT
                       TABLE 314 TADANO LTD.: PRODUCTS OFFERED
                       TABLE 315 TADANO LTD.: DEALS
                       TABLE 316 TADANO LTD.: EXPANSIONS
                       TABLE 317 TADANO LTD.: OTHER DEVELOPMENTS
             13.3.3 TEREX CORPORATION
                       TABLE 318 TEREX CORPORATION: COMPANY OVERVIEW
                       FIGURE 91 TEREX CORPORATION: COMPANY SNAPSHOT
                       FIGURE 92 TEREX CORPORATION: BRANDS AND OFFERINGS
                       TABLE 319 TEREX CORPORATION: PATENTS
                       TABLE 320 TEREX CORPORATION: PRODUCTS OFFERED
                       TABLE 321 TEREX CORPORATION: PRODUCT LAUNCHES/DEVELOPMENTS
                       TABLE 322 TEREX CORPORATION: EXPANSIONS
             13.3.4 LINAMAR CORPORATION
                       TABLE 323 LINAMAR CORPORATION: COMPANY OVERVIEW
                       FIGURE 93 LINAMAR CORPORATION: COMPANY SNAPSHOT
                       TABLE 324 LINAMAR CORPORATION: MANUFACTURING FACILITIES
                       TABLE 325 LINAMAR CORPORATION: PRODUCTS OFFERED
                       TABLE 326 LINAMAR CORPORATION: PRODUCT LAUNCHES/DEVELOPMENTS
                       TABLE 327 LINAMAR CORPORATION: DEALS
                       TABLE 328 LINAMAR CORPORATION: EXPANSIONS
             13.3.5 MAGNI TELESCOPIC HANDLERS SRL
                       TABLE 329 MAGNI TELESCOPIC HANDLERS SRL: COMPANY OVERVIEW
                       TABLE 330 MAGNI TELESCOPIC HANDLERS SRL: PRODUCTS OFFERED
                       TABLE 331 MAGNI TELESCOPIC HANDLERS SRL: PRODUCT LAUNCHES/DEVELOPMENTS
                       TABLE 332 MAGNI TELESCOPIC HANDLERS SRL: DEALS
                       TABLE 333 MAGNI TELESCOPIC HANDLERS SRL: EXPANSIONS
     13.4 OTHER PLAYERS (LIFTING PLATFORMS) 
             13.4.1 HAULOTTE GROUP
                       TABLE 334 HAULOTTE GROUP: COMPANY OVERVIEW
             13.4.2 AICHI CORPORATION
                       TABLE 335 AICHI CORPORATION: COMPANY OVERVIEW
             13.4.3 PALFINGER AG
                       TABLE 336 PALFINGER AG: COMPANY OVERVIEW
             13.4.4 IMER INTERNATIONAL S.P.A.
                       TABLE 337 IMER INTERNATIONAL S.P.A.: COMPANY OVERVIEW
             13.4.5 SINOBOOM INTELLIGENT EQUIPMENT CO., LTD.
                       TABLE 338 SINOBOOM INTELLIGENT EQUIPMENT CO., LTD.: COMPANY OVERVIEW
             13.4.6 ALTEC INDUSTRIES
                       TABLE 339 ALTEC INDUSTRIES: COMPANY OVERVIEW
             13.4.7 J C BAMFORD EXCAVATORS LTD.
                       TABLE 340 JC BAMFORD EXCAVATORS LTD.: COMPANY OVERVIEW
             13.4.8 NOBLELIFT INTELLIGENT EQUIPMENT CO., LTD.
                       TABLE 341 NOBLELIFT INTELLIGENT EQUIPMENT CO., LTD.: COMPANY OVERVIEW
             13.4.9 BRONTO SKYLIFT
                       TABLE 342 BRONTO SKYLIFT: COMPANY OVERVIEW
             13.4.10 SNORKEL
                                   TABLE 343 SNORKEL: COMPANY OVERVIEW
             13.4.11 DINOLIFT OY
                                   TABLE 344 DINOLIFT OY: COMPANY OVERVIEW
 
14 RECOMMENDATIONS BY MARKETSANDMARKETS (Page No. - 358)
     14.1 ASIA PACIFIC TO BE DOMINANT MARKET FOR INDUSTRIAL VEHICLES 
     14.2 GERMANY TO BE FASTEST-GROWING MARKET IN EUROPE 
     14.3 IMPACT OF E-COMMERCE ON INDUSTRIAL VEHICLES MARKET 
     14.4 AUTONOMOUS FORKLIFTS TO BE KEY FOCUS AREA FOR INDUSTRIAL VEHICLE MANUFACTURERS 
     14.5 CONCLUSION 
 
15 APPENDIX (Page No. - 360)
     15.1 KEY INSIGHTS FROM INDUSTRY EXPERTS 
     15.2 DISCUSSION GUIDE 
     15.3 KNOWLEDGESTORE: MARKETSANDMARKETS’ SUBSCRIPTION PORTAL 
     15.4 CUSTOMIZATION OPTIONS 
             15.4.1 BY CAPACITY, AT REGIONAL LEVEL, FOR EACH VEHICLE TYPE
             15.4.2 BY DRIVE TYPE, AT REGIONAL LEVEL, FOR EACH VEHICLE TYPE
             15.4.3 BY APPLICATION, AT GLOBAL LEVEL, FOR EACH VEHICLE TYPE
             15.4.4 COMPANY INFORMATION
                       15.4.4.1 Profiling of additional market players (up to five)
     15.5 RELATED REPORTS 
     15.6 AUTHOR DETAILS 

The study involved four major activities to estimate the current size of the industrial vehicles market. Exhaustive secondary research collected information on the market, the peer market, and model mapping. The next step was to validate these findings and assumptions and size them with industry experts across value chains through primary research. The bottom-up and top-down approaches were employed to estimate the total market size. After that, market breakdown and data triangulation were used to determine the market size of segments and subsegments.

Secondary Research

In the secondary research process, various secondary sources were used to identify and collect information on the industrial vehicles market for this study. Secondary sources included annual reports, press releases, and investor presentations of companies; whitepapers, certified publications, and articles from recognized authors; directories; databases; and articles from recognized associations and government publishing sources. Secondary research has been used to obtain key information about the industry's value chain, the overall pool of key players, market classification and segmentation according to industry trends to the bottom-most level, regional markets, and key developments from the market- and technology-oriented perspectives.

Primary Research

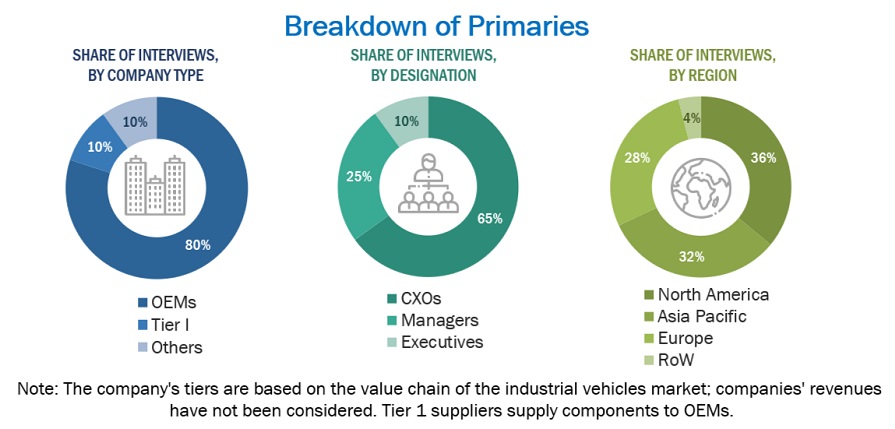
Extensive primary research has been conducted after understanding the industrial vehicles market scenario through secondary research. Several primary interviews have been conducted with market experts from demand-side industrial vehicle product providers and supply-side OEMs across four major regions: North America, Europe, and Asia Pacific. Approximately 17% and 83% of primary interviews have been conducted from the demand and supply sides, respectively. Primary data was collected through questionnaires, emails, and telephonic interviews. In the canvassing of primaries, various departments within organizations, such as sales, operations, and marketing, were covered to provide a holistic viewpoint in the report.

After interacting with industry experts, we also conducted brief sessions with highly experienced independent consultants to reinforce the findings from our primaries. This, along with the in-house subject matter expert opinions, led us to the findings as described in the remainder of this report

Industrial Vehicles  Market Size, and Share

To know about the assumptions considered for the study, download the pdf brochure

Market Size Estimation

A detailed market estimation approach was followed to estimate and validate the value of the industrial vehicles market. Key industrial vehicle market players were identified through secondary research, and their global market shares were determined through primary and secondary research. The research methodology included the study of the annual and quarterly financial reports & regulatory filings of major market players, as well as interviews with industry experts for detailed market insights. All major penetration rates, percentage shares, splits, and breakdowns for the industrial vehicles market were determined using secondary sources model mapping and verified through primary sources. All key macro indicators affecting the revenue growth of the market segments and subsegments were accounted for, viewed in extensive detail, verified through primary research, and analyzed to get the validated and verified quantitative & qualitative data. The gathered market data was consolidated and added with detailed inputs, analyzed, and presented in this report.

Global Industrial Vehicles Market Size: Bottom-Up Approach

Industrial Vehicles  Market Bottom Up Approach

To know about the assumptions considered for the study, Request for Free Sample Report

Global Industrial Vehicles Market Size: Top-Down Approach
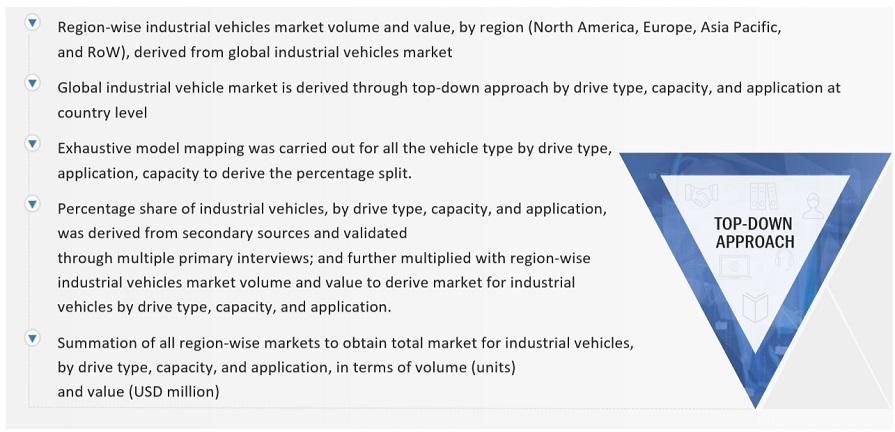
Industrial Vehicles  Market Top Down Approach

Data Triangulation

All percentage shares, splits, and breakdowns were determined using secondary sources and verified by primary sources. All parameters that affect the markets covered in this research study were accounted for, viewed in extensive detail, and analyzed to obtain the final quantitative and qualitative data. This data was consolidated and enhanced with detailed inputs and analysis from MarketsandMarkets and presented in the report. The following figure is an illustrative representation of the overall market size estimation process employed for this study.

Market Definition

Industrial vehicles: The industrial vehicles market encompasses the production, distribution, and utilization of specialized vehicles tailored for material handling, transportation, and logistical operations within industrial environments like warehouses, manufacturing facilities, distribution centers, and ports. These vehicles, including forklifts, aisle trucks, tow tractors, and container handlers, are crucial for optimizing operational productivity, safety, and efficiency. Key stakeholders involved in this market include industrial vehicle manufacturers, component manufacturers, industrial vehicle rental/leasing companies, and end-users.

Key Stakeholders

  • Associations, forums, and alliances related to industrial vehicles
  • Raw material suppliers
  • Industrial vehicle distributors and dealers
  • Manufacturers of industrial vehicles
  • Manufacturers of industrial vehicle components
  • Autonomous vehicle solution providers
  • Technology vendors
  • Industrial vehicle rental/leasing companies
  • Material handling associations
  • Standards organizations and regulatory authorities related to the material handling industry

Report Objectives

  • To segment and forecast the size of the global industrial vehicles market, by value & volume, based on vehicle type & capacity (Forklifts (<5ton, 5-10 ton, 11-36 ton, >36 ton), Aisle trucks (<1ton, 1-2 ton, >2 ton), Tow tractors (<5ton, 5-10 ton, 11-30 ton, >30 ton), Container handlers (<30ton, 30-40 ton, >40 ton), Automated Guided Vehicles, and Personnel Carriers)
  • To segment and forecast the size of the global industrial vehicles market by value & volume based on drive type (Internal Combustion Engine Industrial Vehicles, Battery-operated Industrial Vehicles, and Gas-powered Industrial Vehicles)
  • To segment and forecast the size of the global industrial vehicles market by value & volume based on application (Manufacturing (Chemical, Food & Beverages, Mining, Automotive, Metals & Heavy Machinery, and Others), Warehousing, Freight & Logistics, and Others)
  • To segment and forecast the size of the global industrial vehicles market by value, based on level of autonomy (Non/Semi-autonomous and Autonomous)
  • To segment and forecast the size of the global aerial work platforms market, by value & volume, based on Type (Scissor Lifts (Scissor Lifts by Drive Type), Boom Lifts (Articulating AWP, Telescopic AWP), and Boom Lifts by Drive Type)
  • To segment and forecast the size of the industrial vehicles market, by value & volume, based on region (Asia Pacific, Europe, North America, and Rest of the World)

Available Customizations

With the given market data, MarketsandMarkets offers customizations per the company's specific needs.

  • By capacity at the regional level for each vehicle type
  • By drive type at the regional level for each vehicle type
  • By application at the global level for each vehicle type

Company Information

  • Profiling of additional market players (up to five)
Custom Market Research Services

We will customize the research for you, in case the report listed above does not meet with your exact requirements. Our custom research will comprehensively cover the business information you require to help you arrive at strategic and profitable business decisions.

Request Customization

Instant Answers with GPT - Ask Now!

Ask real questions. Get complete answers !
Report Code
AT 4611
Published ON
Apr, 2024
Choose License Type
BUY NOW
  • SHARE
X
Request Customization
Speak to Analyst
Speak to Analyst
OR FACE-TO-FACE MEETING
PERSONALIZE THIS RESEARCH
  • Triangulate with your Own Data
  • Get Data as per your Format and Definition
  • Gain a Deeper Dive on a Specific Application, Geography, Customer or Competitor
  • Any level of Personalization
REQUEST A FREE CUSTOMIZATION
LET US HELP YOU!
  • What are the Known and Unknown Adjacencies Impacting the Industrial Vehicles Market
  • What will your New Revenue Sources be?
  • Who will be your Top Customer; what will make them switch?
  • Defend your Market Share or Win Competitors
  • Get a Scorecard for Target Partners
CUSTOMIZED WORKSHOP REQUEST
+1-888-600-6441
  • Call Us
  • +1-888-600-6441 (Corporate office hours)
  • +1-888-600-6441 (US/Can toll free)
  • +44-800-368-9399 (UK office hours)
CONNECT WITH US
ABOUT TRUST ONLINE
©2024 MarketsandMarkets Research Private Ltd. All rights reserved
DMCA.com Protection Status Website Feedback